

Courtesy of Chris Kimble
Last year’s coronavirus stock market crash turned into a BIG opportunity for active investors to buy stocks at deep discounts… especially COVID-friendly stocks.
Since the March 2020 crash low, stocks have rallied sharply for 11 months… and this rally has a couple of important stock market indices testing important resistance levels.
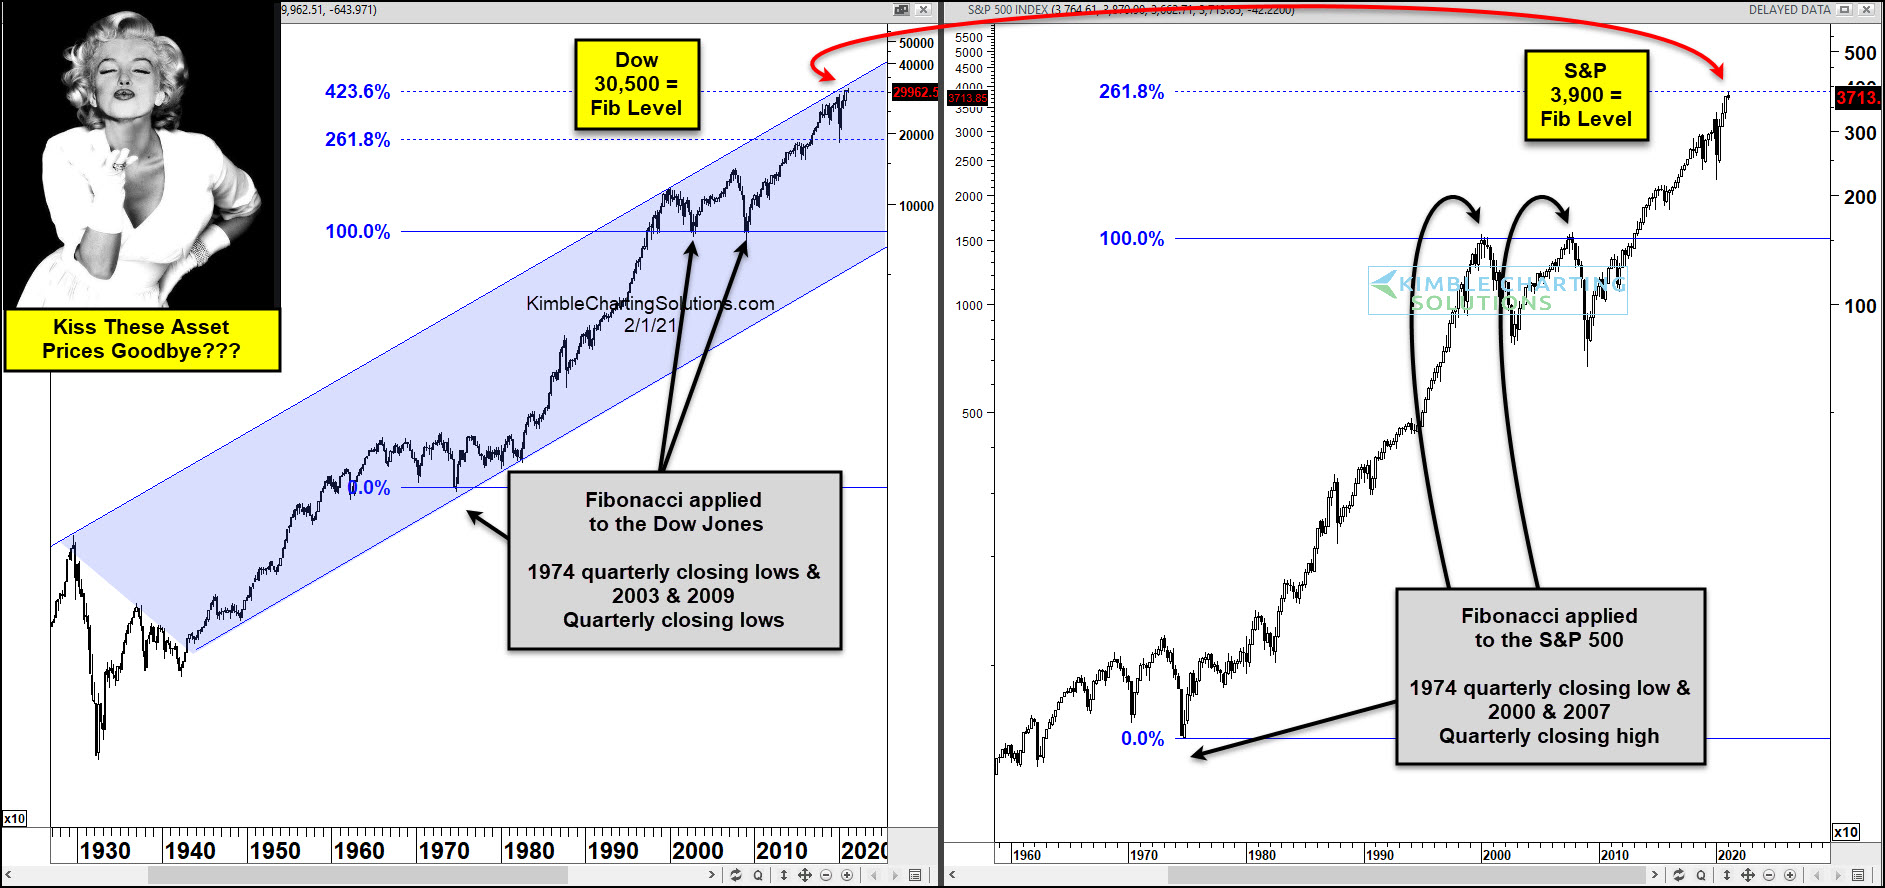
In today’s chart 2-pack, we examine these stock indices: the Dow Jones Industrial Average and S&P 500 Index. And we apply Fibonacci principles to long-term historical charts.
As you can see, when we use Fibonacci analysis on the 1974 and 2003/2009 lows, we get a 423.6% Fibonacci extension level at 30,500. This is a huge stretch breakout/resistance level… and it’s being tested right now!
At the same time, the S&P 500 is testing is testing a key Fibonacci level. When using the 1974 low and 2000/2007 closing high, you get a 261.8 Fibonacci extension level at 3900. And, yep, it’s being tested right now!
I’ve never seen fib levels from such key long-term highs and lows potentially come together like this!
With the trend being up for stocks, these Fibonacci price levels become 45-year breakout tests!
If breakouts take place, look for much higher stock prices!!!
This article was first written for See It Markets.com. To see the original post CLICK HERE.
To become a member of Kimble Charting Solutions, click here.