

Courtesy of Chris Kimble
Copper is among several commodities with elevated prices right now.
It has also formed an important price pattern that may send one of the strongest macro messages in years.
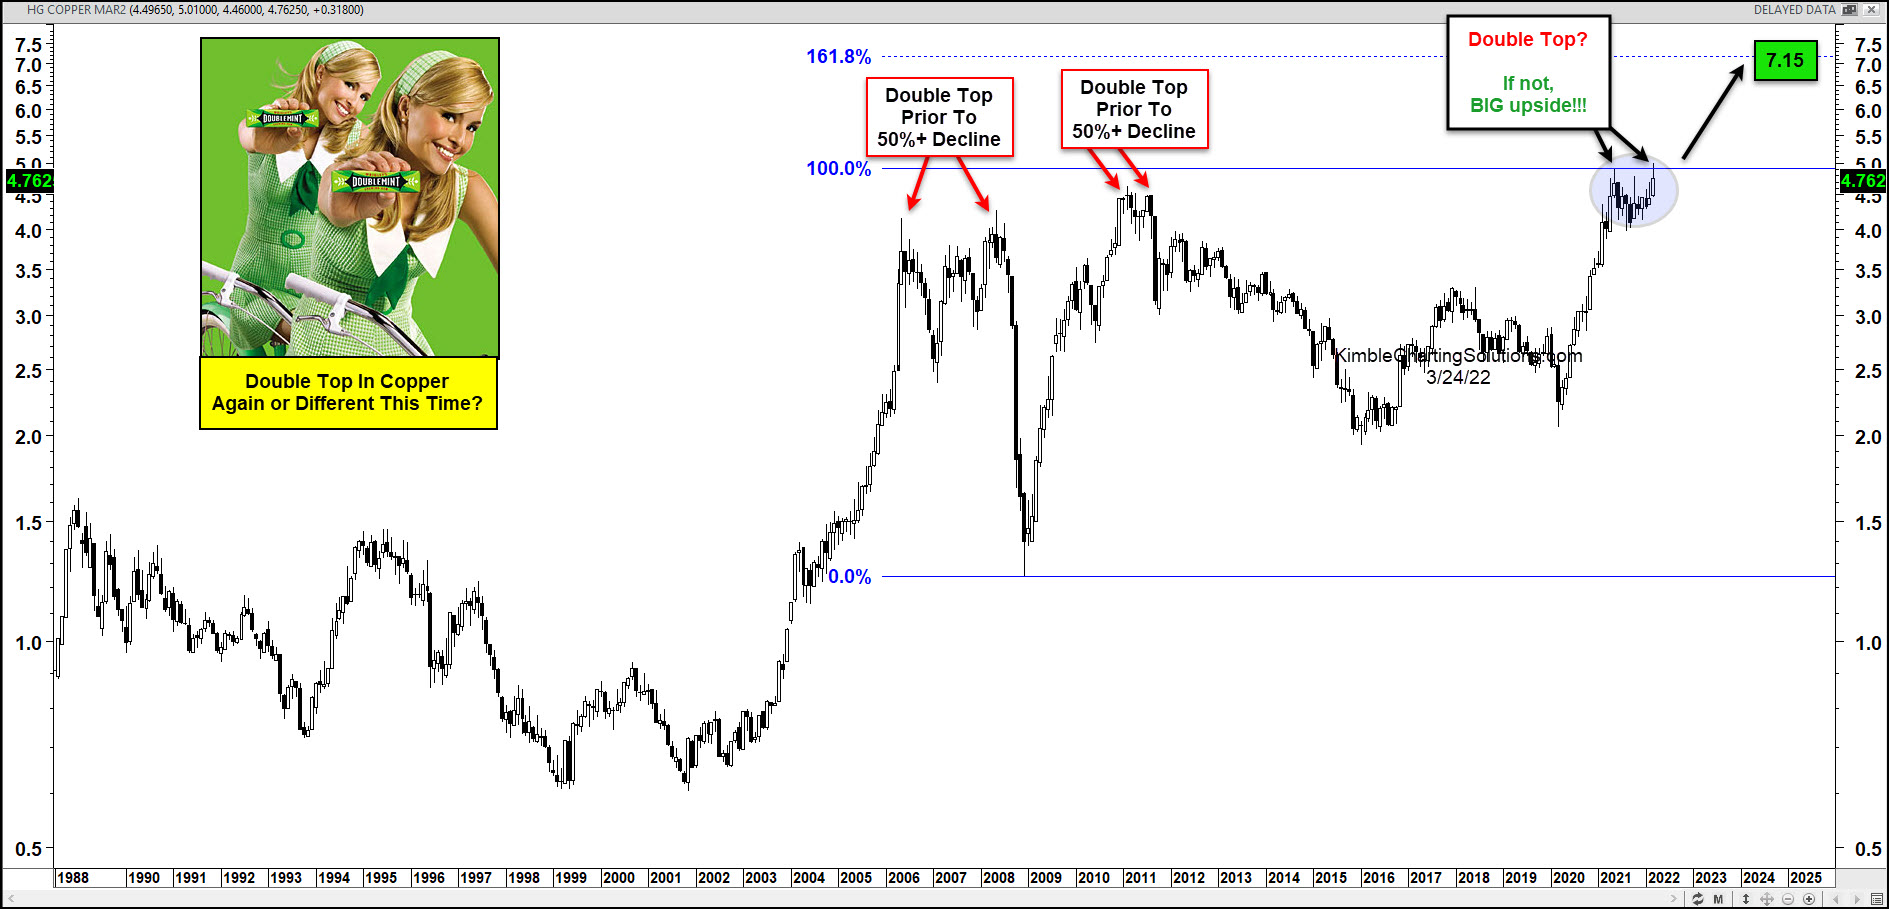
Today, we look at a long-term “monthly” chart of Copper. As you can see, in the months/years leading up to the Financial Crisis good ole Doc Copper formed a double top pattern that lead to a 50%+ decline. It then repeated that pattern again in 2011-2012 before falling 50%+ again. In both cases, this signaled an economy in recession or stagnation.
Once again, we can see that copper has formed a potential double top pattern. Bulls do not want to see prices continue to fall from here. A reversal would send yet another signal that the economy is stagnating.
However, should Doc copper avoid a reversal here and continue higher, it could bring BIG upside. This is clearly an important point for Copper prices. Stay tuned!
This article was first written for See It Markets.com. To see the original post CLICK HERE.
To become a member of Kimble Charting Solutions, click here.