

Courtesy of Chris Kimble
It’s been an ugly couple of year for US Treasury Bonds. T-bond prices have dropped sharply as yields have risen.
This has been an added pressure on retirement portfolios as treasury bonds are no longer trading like a conservative asset.
Time for a bounce in T-bonds?
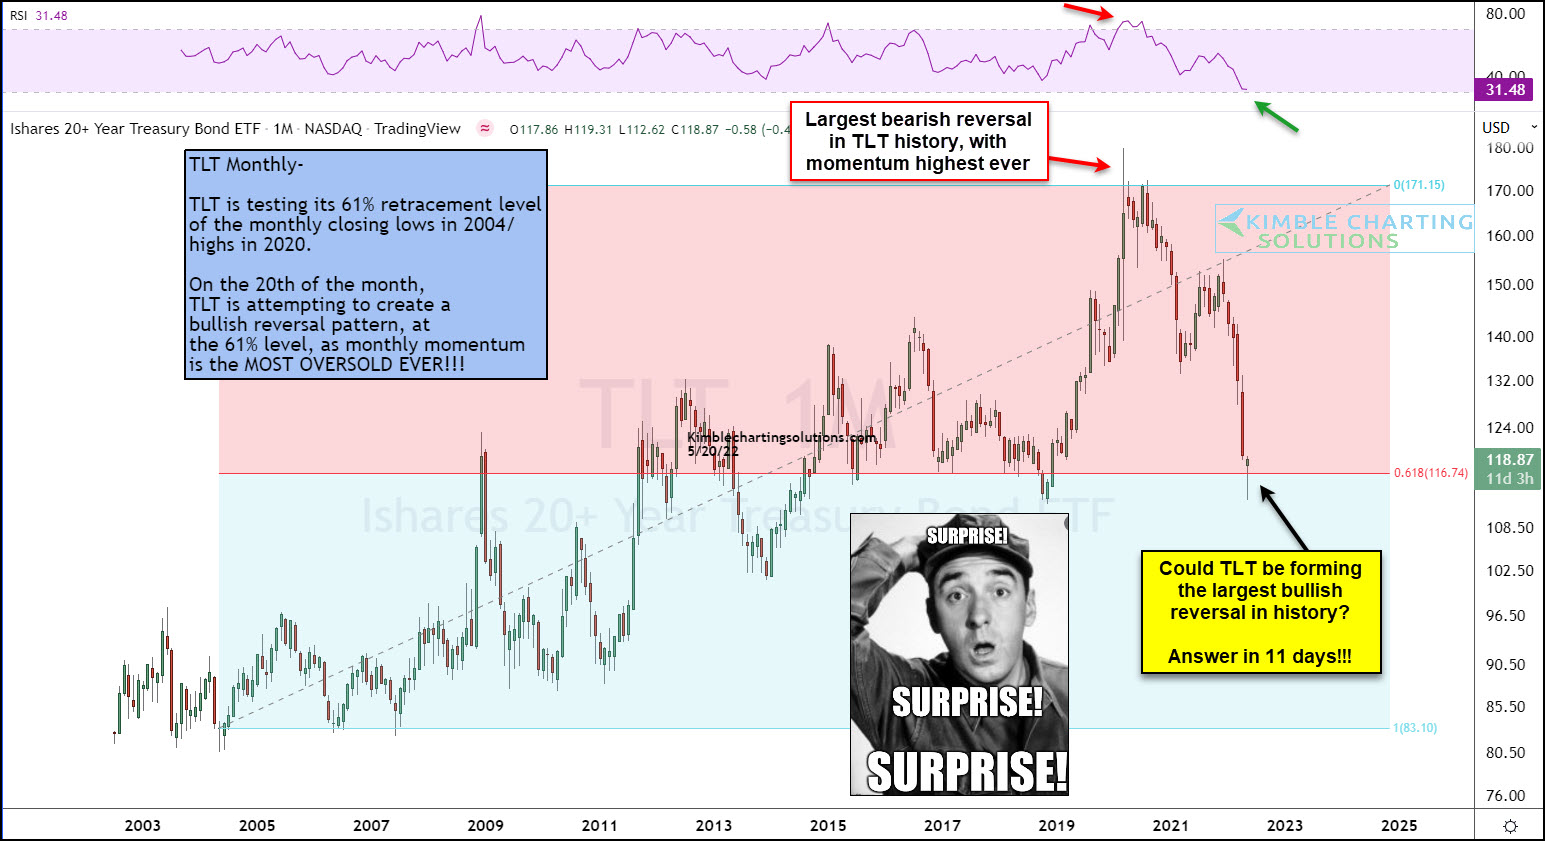
Today, we take a look at the long-term “monthly” chart of the 20+ Year US Treasury Bond ETF (TLT).
As you can see, 2 years ago bonds peaked and formed a historic bearish reversal pattern at the highest momentum reading ever.
Since then, bonds have been in a sharp decline. Currently, the 20-year bond ETF (TLT) is testing support at its 61.8 Fibonacci retracement level (using 2004 lows / 2020 highs). So far this month TLT has rallied back from a sharp decline.
Could TLT form an equally impressive bullish reversal this month (from historic oversold levels)? We should know the answer at month-end! Stay tuned!!
This article was first written for See It Markets.com. To see the original post CLICK HERE.
To become a member of Kimble Charting Solutions, click here.