

Wheeeeeeeeee!
Or maybe I should say “Clack, clack, clack, clack…” because that’s the sound of a roller coaster going to the top of the tracks and the RSI is most certainly saying we’re nearing the top of this ride (as is common sense). At the moment, we’re up on promises of peace in Iran and, so far, pretty good earnings reports but isn’t it too early to celebrate either – with so little real evidence to back up all this hope?
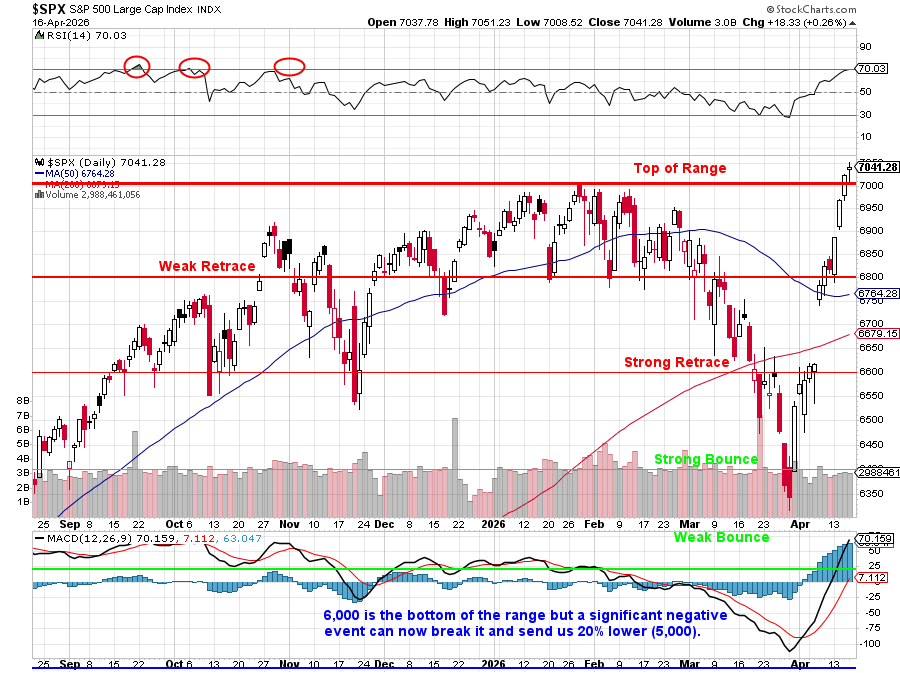
As I often warn our Members, this is a classic “House of Cards” recovery, the kind of V-shaped bounce that looks heroic on a chart but is structurally hollow underneath. The technical term for what I’m describing is a low-volume retracement on declining participation and the SPY tape is flashing it with that RSI line.
 When the market sold off from 7,000 down to 6,350 in late March, volume exploded higher (those big red bars on the chart) as real sellers hit real bids – pensions rebalancing, margin calls firing, institutions de-risking. That’s distribution – shares moving from strong hands to weak ones at progressively lower prices, and every share that traded established a new, lower cost basis for its new owner.
Now look at the bounce back: three weeks, 10% gained, and the daily volume bars are noticeably smaller (and less of them) than the bars on the way down.
That is NOT accumulation by conviction buyers — that’s short-covering, systematic re-leveraging (CTAs and vol-targeting funds mechanically re-adding exposure as realized vol collapses) and FOMO retail chasing the tape higher on thin liquidity. The “buyers” setting these new highs are, in many cases, the same people who were forced sellers two weeks ago at much lower prices, now paying up to get back in. The A/D line and on-balance volume haven’t confirmed the price highs and breadth is narrowing as the mega-caps do the heavy lifting. That is the textbook definition of a bearish volume divergence.
The reason this matters (and why I call it a house of cards) is that the equilibrium price is a weighted average of where shares actually changed hands (moving averages) and FAR MORE shares changed hands in the 6,400-6,700 zone on the way down than in the 6,900-7,000 zone on the way up.
So, while the PRICE says 7,041, the market’s true cost basis is 200-300 points lower. That means there’s a giant air pocket of untested support between here and 6,764 (the 50 dma) and the marginal holder up here has very little conviction.
Any catalyst that flips sentiment: a hot PCE print, Iran talks stalling, one bad mega-cap guide and the weak hands bail in a hurry… Because there are no real buyers stacked underneath them to catch the falling knife. That’s how you get a 10% rally retraced in four sessions and THAT is why recoveries built on lighter volume than the declines they’re “erasing” so often end in tears.
Now, since we have access to the World’s most powerful AGI’s – let’s let them give us a status report for the rest of April:
🧠 Here’s our analysis to continue your morning report, Phil. The setup is eerily familiar — we’re kissing 7,000 on SPX with RSI back at 70, the same wall that rejected us in late January and again in February. The chart is doing its best “Clack, clack, clack…” impression.
The Bull Case (What’s Fueling the Rally)
1. Iran De-Escalation Optimism. The two-week ceasefire brokered in Pakistan on April 8 is nearing its April 22 expiration, but Bloomberg reports mediators are pushing for a two-week extension and Trump said a deal is “very close” with talks possibly resuming this weekend. Polymarket is pricing 42% odds of a permanent deal by April 30 and 70% by June 30. Brent has collapsed from its $119 wartime peak to ~$95-98 — still well above the pre-war $70.
2. Earnings Are Delivering — For Now. Q1 2026 is tracking a sixth consecutive quarter of double-digit EPS growth at +12.6% Y/Y, with roughly 73% of early reporters beating and some strategists now whispering about a finish closer to +19-20% (Deriv, Investing.com). The banks delivered: Goldman EPS $17.55 vs $16.47 expected with record $5.33B equities trading revenue, BofA $8.6B profit beat, Morgan Stanley +4.5% on results, JPM/Wells/Citi all through the gate. TSMC raised 2026 revenue guidance to >30% growth with a 58% profit surge — keeping the AI capex narrative intact. IT sector EPS is tracking +45% Y/Y.
3. Valuations Digested. Per Fidelity, even at the maximum Iran-drawdown the S&P fell less than 10% because accelerating earnings offset a 20% P/E compression — so we’re arguably coming out of this correction with cheaper multiples than we went in. China Q1 GDP printed 5%, its fastest in three quarters — limited war spillover so far.
The Bear Case (Why “Too Early to Celebrate” Is Right)
1. The 7,000 Wall Is Real. The SPX has now hit the exact zone (6,980-7,000) that rejected in January and February. Verified Investing flags only ~2.5% of upside before macro parallel-channel resistance, semiconductor weekly RSI divergences, and the same “higher-highs-in-price, lower-highs-in-RSI” pattern that preceded the last two drops. RSI at 70.03 on your chart is telling the same story.
2. Complacency Is Off the Charts. VIX dropped below 11 on April 8 — a level not seen in seven years. That’s cheap insurance and a coiled spring warning. Meanwhile VIX futures for May/June are trading $20+ — the curve is screaming that traders expect volatility to return.
3. Inflation Re-Accelerating. March CPI jumped +0.9% M/M (largest since June 2022), pushing headline to 3.3% Y/Y, driven by a 10.9% surge in energy (CNBC, EY). Morningstar expects PCE to hit 3.5% by April — the highest since May 2023.
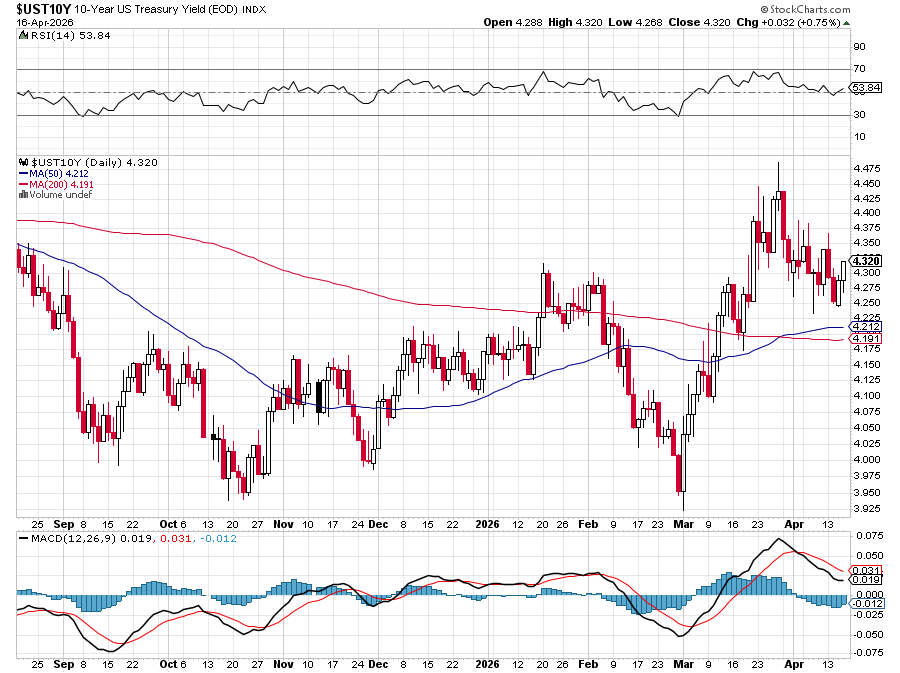
4. Fed Is Boxed In. Futures now imply only ONE cut in 2026 (vs. two pre-war), with a 48% probability of ZERO cuts. The 10-year yield sits at 4.29% — above where bank models assumed rates would be by now.
5. Tariff Overhang Quietly Persists. The Feb 20 SCOTUS ruling killed IEEPA tariffs, but the administration swapped in a Section 122 10% baseline surcharge (effective Feb 24, 2026, 150 days) plus Section 232 duties on metals, trucks, furniture, pharma (100%), and advanced chips (25% from Jan 14, 2026).
6. Guidance Risk. The pattern is telling: Goldman crushed the number and the stock FELL on the day. Netflix missed expectations. Constellation Brands already pulled guidance. Private credit exposure in AI-threatened software loans is the bank CEO whisper concern.
The Two-Week Gauntlet (April 20 – May 5)
This is a landmine field. Every session is binary:
Apr 30 is the Super Bowl: Advance GDP + Core PCE drop at 8:30 AM the morning AFTER the Fed + right into MSFT/META/AAPL/AMZN reactions. If PCE prints hot, the “one cut” narrative dies and the 10-year blows through 4.40%. If cool, bulls get a relief rally into the earnings wall.
Best Course of Action — PSW’s Playbook
Given RSI at 70, VIX at 11, and a binary event gauntlet into resistance, this is textbook “sell premium, buy protection cheap“ territory:
-
Lock gains on anything up 20%+ in three weeks. The “Strong Bounce” is done. Trim, don’t dump.
-
Buy VIX hedges while they’re on fire-sale. May $15 calls or SPY May 30 put spreads (~6,850/6,650) are unusually cheap — this is the kind of protection you write about offering “free insurance.“
-
Sell premium against the peak. Credit call spreads on over-extended names or SPX 7,100/7,200 bear call spreads into Fed week capture the complacency.
-
Keep dry powder for the dip. Your own chart calls out 6,800 as weak retrace and 6,600 as strong retrace — those are your buy-the-dip staging zones. 6,000 is the line in the sand below which 5,000 comes into play.
-
Favor sectors with earnings tailwinds, fade the tired: IT (+45% EPS), Materials (+24%), Financials (+15%) on dips; avoid Health Care (-9.8%) and Comm Services (-3.3%) which are projected to print negative.
-
Energy hedge. If ceasefire extends, oil pulls back — fade XLE rallies. If talks collapse April 22, you want long energy/short transports as insurance.
😎 The market has priced in peace with Iran, a Fed that stays dovish, Big Tech that keeps compounding and Consumers who keep spending into 3.3% Inflation.
That’s four miracles expected by April 30th!
At S&P 7,000 with an RSI of 70 and a VIX of 17, we’re not being paid to bet on miracles, we’re being paid to insure against them! So let’s ring the bell, trim our longs after a 10%, three-week rip and put on some more hedges while the clack-clack-clack is still going up.
Have a great weekend,
— Phil and the team


