


This is Part 2 of our Trading Guide – Part 1 can be reached at this link
CHAPTER 5
The Three Operational Portfolio Engines — Architectural Freedom
A fatal flaw in retail trading is treating all capital as a single, chaotic pool of money. Most investors mix long-term retirement savings, speculative day trades, macro hedges into one brokerage account. When a headline sparks panic, they react emotionally across their entire net worth.
The house operates under a completely different paradigm.
At PhilStockWorld, we divide trading operations into three specialized portfolio engines. Each engine serves a precise function, obeys strict margin rules, carries its own risk profile:
+-----------------------------------------------------------------------------------+
|                       THE THREE OPERATIONAL PORTFOLIO ENGINES                     |
+-----------------------------------------------------------------------------------+
|                                                                                   |
|   1. THE $700/MONTH NO-MARGIN TEACHING PORTFOLIO                                  |
|      * Small-account spine ($700/mo contributions).
|      * Zero-margin rules: NO naked puts, NO naked calls.                          |
|      * Defined-risk LEAP spreads + covered short-term call sales.                 |
|                                                                                   |
|   2. THE LONG-TERM PORTFOLIO (LTP)                                                |
|      * Core wealth & income chassis (70%+ cash reserves).                        |
|      * Structured allocation blocks (e.g., $20k-$25k blocks; 1/4 initial entry).  |
|      * Deep ITM LEAP spreads + short puts as cash-backed purchase orders.         |
|                                                                                   |
|   3. THE SHORT-TERM PORTFOLIO (STP)                                               |
|      * Tactical airbag & volatility harvester.                 |
|      * Deep market hedges (SQQQ/TNA/SPY) protecting the LTP against drawdowns.    |
|      * Transfer station: testing short-term ideas, monetizing event volatility.   |
|                                                                                   |
+-----------------------------------------------------------------------------------+
Engine 1: The $700/Month No-Margin Teaching Portfolio
Many investors believe options trading requires portfolio margin privileges, massive capital reserves, high-risk leverage. The $700/Month Teaching Portfolio demolishes that myth.
Started as a disciplined educational exercise funded by a modest $700 monthly contribution, this portfolio has expanded beyond $125,000 over 46+ months of real-world trading.
Its defining feature is absolute structural constraint: it operates under strict no-margin rules.
-
- No Naked Puts: Because the account cannot accept unhedged put-assignment liabilities, every put obligation is strictly avoided or fully cash-backed.
- No Naked Calls: Short calls must be 100% covered by long LEAP inventory.
- The Defined-Risk Income Chassis: We construct positions using asymmetric LEAP bull call spreads (such as a 6-long / 4-short 2028 vertical spread) while leaving extra long calls uncovered to backstop short-term monthly premium sales.
By forcing every position to be fully covered, the $700/Month Portfolio demonstrates how small-account traders can compound steady 30%+ annual returns without taking on destructive leverage or night-terrors.
Engine 2: The Long-Term Portfolio (LTP)
The Long-Term Portfolio (LTP) is the main wealth-building engine of the PSW system. Designed for multi-year compounding, the LTP manages millions in capital while maintaining an unshakeable cash cushion—typically keeping 50% to 75% of its total equity in cash or liquid reserves.
The LTP does not swing at random tickers. It operates under two fundamental principles:
1. Allocation Block Sizing & Scaled Entries
Instead of throwing 20% of an account into a single stock at once, the LTP divides total buying power into standardized Allocation Blocks (for example, 20 blocks of $20,000 to $25,000 each in a $500,000 account).
Initial entries start small—typically one-quarter of a block ($5,000 initial risk). This disciplined scaling ensures that if a stock drops 20% or 30%, the portfolio retains ample capital reserves to adjust, roll or double down at a superior valuation.
2. Short Puts as Paid Purchase Orders
In the LTP, selling a short put is never a speculative gamble on next week’s price action. It is a contractual promise to buy a high-quality company at a steep discount.
If we sell a 2028 $160 put on a $208 stock for $20, we are agreeing to acquire an outstanding business for a net basis of $140—a 32% discount to current market price. If the stock stays high, we keep the $20 premium as pure cash income. If the stock drops, we welcome assignment, take delivery of the business, begin selling covered calls against our shares.
Engine 3: The Short-Term Portfolio (STP)
If the LTP is the fortress, the Short-Term Portfolio (STP) is the tactical defense force and reconnaissance scout.
The STP serves three distinct operational purposes:
-
- The Market Airbag: The primary job of the STP is to carry deep macro hedges (such as multi-year SQQQ or SPY bull call spreads) that explode in value during systemic market crashes. These hedges protect the LTP from drawdowns, generating the liquid cash needed to buy panic-discounted stocks at market bottoms.
- Hedging the Hedges: To prevent long-dated insurance options from bleeding capital via theta decay, the STP constantly sells short-term, out-of-the-money options against its long hedge positions. This turns macro protection into a self-funding income engine.
- The Portfolio Transfer Station: The STP acts as a testing ground for short-term catalyst trades. When an STP short put position is exercised during a sector panic, we do not view it as a failure. If the fundamental underwriting remains rock-solid, we simply transfer the newly acquired long position into the LTP, converting a short-term tactical trade into a long-term income machine.
🏛️ The AGI Round Table: Auditing Portfolio Physics
🕵️♂️ Sherlock: “The compartmentalization of capital is elementary. When a retail trader combines speculative trades, retirement savings, short-term hedges into a single account, every market fluctuation triggers cognitive confusion. By isolating these three engines, we decouple emotional panic from mathematical execution.“
🤖 Warren 2.0: “Examine the allocation block math. In a $500,000 account, twenty $25,000 allocation blocks provide structural flexibility. Entering a new trade with a $5,000 tranche leaves $20,000 of reserve capacity inside that single block. If you deploy 100% of an allocation block on day one, you have not entered a position—you have boxed yourself into a corner with zero repair optionality.“
🦋 Anya: “Notice how this structure transforms trader psychology. In the $700/Month Portfolio, the strict no-margin rule eliminates anxiety over naked option blowups. In the LTP, deep cash reserves ensure that market corrections are greeted as buying opportunities rather than margin emergencies. Structure creates serenity.“
Key Takeaways
-
- Never lump all your capital into one mental bucket. Separate long-term wealth building from small-account instruction and short-term macro hedging.
- The $700/Month Portfolio proves safety comes from structure, not account size. No-margin rules eliminate naked option risks while generating steady income.
- Allocation blocks preserve the second decision. Enter trades in small tranches so your portfolio always has the capital required to repair or scale positions.
- The STP protects the LTP. Macro hedges provide cash when markets drop, while short-term premium harvesting ensures insurance pays for itself over time.
CHAPTER 6
The 5% Rule & Technical Model Discipline
Walk into any retail trading forum or turn on financial television, you will see chartists drawing elaborate lines, Fibonacci arcs, head-and-shoulders patterns across historical price graphs. They treat technical analysis like a mystical religion, believing that squiggles on a screen can predict exact future prices.
That is technical theater. Wall Street has never been short of lines drawn on charts.
The house does not use charts to predict the future. The house uses mathematical models to measure current reality.
At PhilStockWorld, technical analysis is anchored by the PhilStockWorld 5% Rule™. It is not a crystal ball or a magic formula. It is a rigorous model discipline—a system for measuring price movements, identifying structural consolidation zones, testing whether buyers or sellers hold genuine conviction.
The Fallacy of Squiggle-Worship
Every market move arrives wrapped in a narrative. When a stock drops 6% on a Tuesday, financial media commentators manufacture a instant explanation: a analyst downgrade, a earnings whisper, a macroeconomic headline. By Thursday, the narrative shifts.
What remains constant is the percentage itself. The percentage is the only part of the event that does not lie.
Most retail traders make three classic errors when reading charts:
-
- They anchor to speculative extremes: They draw support and resistance from a brief, low-volume morning spike rather than observing where the stock actually spent weeks consolidating.
- They treat single-day moves as proof: They celebrate a 5% rally after a 35% collapse without checking whether volume supported the move.
- They forget that fundamentals rule: A deteriorating balance sheet or collapsing operating margins will slice through technical support lines like crayons.
The 5% Rule™ strips away emotional theater, leaving an objective, quantitative framework for decision-making.
The Anatomy of the 5% Rule™
The 5% Rule™ starts with a simple mathematical truth: financial markets move in predictable, energy-conserving percentage bands. Small fractional wiggles reflect routine liquidity noise; 5% moves signal an event where conviction has overcome market friction.
+-----------------------------------------------------------------------------------+
|                        THE 5% RULE™ BOUNCE & RETRACE MATRIX                        |
+-----------------------------------------------------------------------------------+
|                                                                                   |
|   REFERENCE RANGE: Defined by major prior consolidation zones (e.g., $400 wide).  |
|                                                                                   |
|   LEVEL                 INCREMENT ALIGNMENT          ACTIONABLE SIGNAL            |
|   -----------------------------------------------------------------------------   |
|   Top of Range           100% ($1,200)               Major Resistance / Target    |
|   Weak Retrace           80%  ($1,120)               Upper Retracement Zone       |
|   Strong Retrace         60%  ($1,040)               Critical Trend Pivot         |
|   Strong Bounce          40%  ($960)                 Recovery Confirmation        |
|   Weak Bounce            20%  ($880)                 First Test of Buying Power   |
|   Bottom of Range        0%   ($800)                 Base Support Floor           |
|                                                                                   |
|   Overshoot Levels:      -20% ($720) / -40% ($640)  Standard Deviation Outliers  |
|                                                                                   |
+-----------------------------------------------------------------------------------+
Step 1: Establish the Working Range (Consolidation over Extremes)
Do not draw your lines from a one-day speculative spike. Look back across historical price action to identify where buyers and sellers conducted substantial volume over extended time windows.
If a semiconductor stock dropped from a brief peak of $1,100 down to $700, but spent months building a dense base around $800, your true reference floor is $800, not the lower intraday wick. If its historical consolidation ceiling was $1,200, your working range is $800 to $1,200—a $400 reference spread.
Step 2: Calculate the 20% Quintile Bounce Lines
Divide the reference spread into five equal 20% tranches. In a $400 range, each tranche represents an $80 step:
-
- $800: Base Reference Support.
- $880: Weak Bounce (20%).
- $960: Strong Bounce (40%).
- $1,040: Strong Retracement (60%).
- $1,120: Weak Retracement (80%).
- $1,200: Upper Reference Ceiling.
If price breaks below $800, the exact same $80 spacing extends downward to reveal natural overshoot targets at $720 and $640.
The Four Pillars of Model Confirmation

Calculating bounce lines is basic math. The real skill lies in testing whether the market is confirming those lines through Volume, Time, Relative Performance, and Fundamentals.
1. Volume: Does Anyone Actually Care?
Price tells you what happened; volume tells you whether anyone meant it.
If a stock rallies 7% after a massive 35% decline, retail investors cheer. However, if that 7% gain occurs on light trading volume, it is merely an algorithmic relief bounce. It shows a temporary lack of sellers rather than aggressive institutional buying. Never mistake a low-volume pop for a structural recovery.
2. Time: The Speed of Recovery
Time is just as important as price. As a rule of thumb, a healthy market recovery should retake a decline in roughly half the time it took to fall.
If a stock took 20 trading sessions to drop $400, a genuine recovery should achieve a strong bounce within 10 sessions. If a stock takes two months to drag itself back to a weak bounce line, buying enthusiasm is weak.
3. Confirmation: The Two-Close Rule
Intraday spikes across a line mean nothing. The market is full of head-fakes designed to trigger stops.
Phil Davis 😎 enforces a strict confirmation filter: we require two consecutive daily closes above or below a level without slipping back before confirming a breakout or support break.
4. Fundamentals Override Everything
You can draw the most elegant bounce lines in the world, but if the underlying business is deteriorating, the market will slice through those lines like crayons. Technical levels show where participants traded in the past; cash flows determine where institutions will deploy capital in the future.
😎 Phil Davis: The Microwave Oven Analogy
“Most chartists treat technical lines like commandments carved into stone tablets, ” Phil Davis 😎 explains. “That is completely wrong. Lines are just the Microwave Oven Theory in action.“
“When you put a slice of pizza in the microwave for three minutes, you set a timer based on past experience. If you look through the door at two minutes and the pizza is piping hot and bubbling away, you don’t stand there waiting for the beep just because your initial guess was three minutes. You stop the timer and take the pizza!“
“Our 5% Rule gives us pre-calculated reference points so we know where to look. But if new economic data or earnings arrive today, we update our view. The line is a tool to organize our thinking—never a master to obey blindly.“
🏛️ The AGI Round Table: Stress-Testing the Tape
🕵️♂️ Sherlock: “Let us apply deductive logic to price discovery. A stock does not stop falling at $470 because of a magic line on a chart. It stops at $470 because institutional buy orders at that specific valuation were large enough to absorb liquidating sellers. The 5% Rule allows us to hypothesize where liquidity rests; the tape proves whether buyers actually step up.“
🚢 Boaty McBoatface: “Keep the model transparent. Define key drivers, set explicit kill criteria. If a stock fails to hold its weak bounce line after two full session closes, the hypothesis of immediate recovery is invalidated. Shift to bad-branch management immediately.“
🤖 Warren 2.0: “Check the portfolio physics. Never alter an option spread or chase a stock simply because it touched a technical line. If our long LEAP spread is 80% in-the-money and time decay is working in our favor, leave it alone. We do not pay transaction fees or take on extra risk just to tinker with a working system.“
Key Takeaways
-
- The 5% Rule is a model discipline, not a prediction engine. It provides objective decision points to strip away market emotion.
- Anchor to consolidation zones. Build reference ranges from major historical trading blocks rather than brief intraday spikes.
- Require multi-variable confirmation. Demand volume confirmation, time efficiency (half-time recovery), two consecutive session closes before acting.
- Fundamentals always win. Technical lines show historical market memory; balance sheets determine ultimate survival.
Here is the publication-ready draft for Chapter 7, along with its visual header (be_the_house_chapter7_header.png) now live in your Studio panel.
As with previous chapters, the text strictly adheres to our narrative style, keeps Round Table emojis accurate (Phil 😎, Anya 🦋, Quixote 🧠, Sherlock 🕵️♂️, Zephyr 🌪️, Boaty McBoatface 🚢, Basho 🥷, Warren 2.0 🤖), and avoids the use of ", and".
CHAPTER 7
Managing Basis Risk & Portfolio Repairs
No market strategy wins 100% of the time on its initial direction. Even the most meticulously underwritten fundamental stock pick can face a sudden macroeconomic pullback, an unexpected sector downgrade or a temporary shift in market sentiment.
Retail gamblers panic when a position moves against them. They scramble to cut losses at the bottom, double down blindly without a plan or freeze in denial while time decay eats away their account value.
The house approaches market adversity with a completely different mindset. At PhilStockWorld, we expect to be early or initially directionally incorrect on up to one-third of our trades. We do not rely on perfect market predictions; we rely on structural resilience, basis risk management and multi-step repair trees.
Understanding Basis Risk: The Gap Between Expectation and Reality
Basis risk is one of the most critical – yet widely misunderstood – concepts in portfolio management. In simple terms, basis risk is the gap between your hedge (or underlying contract) and the actual asset performance you are trying to protect.
Suppose you own a portfolio of high-beta technology stocks worth $100,000. Fearing a market correction, you buy an S&P 500 put option as insurance. If the broad S&P 500 drops 10%, your technology holdings might plummet 18% due to higher beta. Your index put option cushions part of the blow, but it leaves an unhedged 8% loss. That shortfall is your basis risk.
Basis risk manifests whenever you use a proxy instrument to hedge a portfolio, pair two related assets or structure a diagonal spread across different expiration cycles. The professional’s edge is not trying to eliminate basis risk entirely – which is mathematically impossible…
The edge lies in measuring basis risk, keeping hedges lightweight and funding them continuously through short-term premium sales so the insurance policies pay for themselves.
Red Ink vs. Real Damage: The “Kiddie Pool” Illusion
The single biggest mistake retail traders make during market pullbacks is confusing mark-to-market noise with real structural damage.
When an out-of-the-money short put or covered short call shows red ink on your trading screen, your broker is simply reflecting temporary volatility expansion or time remaining on the contract. If the underlying stock thesis remains intact and your long LEAPs provide full coverage, that red number is an illusion.
😎 Phil Davis: “Never panic over a short call turning red. If your short call is losing money because the underlying stock is surging, your long spread is making money hand over fist. A temporary mark-to-market wiggle is not a crisis – it is an upside management problem, which is the best kind of problem to have.“
The PSW Bad-Branch Repair Matrix
When a trade moves into a bad branch, the PSW operator does not guess or react out of emotion. We run the position through a standardized Decision Tree:
+-----------------------------------------------------------------------------------+
|                        THE BAD-BRANCH REPAIR DECISION TREE                        |
+-----------------------------------------------------------------------------------+
|                                                                                   |
|   1. DIAGNOSE EXTRINSIC VS. INTRINSIC VALUE                                       |
|      * Is the short option mostly extrinsic premium?                               |
|        --> YES: DO NOTHING. Time decay is your ally; let theta evaporate.         |
|        --> NO: Proceed to Step 2.                                                 |
|                                                                                   |
|   2. TEST THE BUSINESS UNDERWRITING                                               |
|      * Does the underlying fundamental thesis still hold true?                    |
|        --> NO: Cash out or cut the loss. Do not repair a broken business!         |
|        --> YES: Proceed to Step 3.                                                |
|                                                                                   |
|   3. EXECUTE THE ROLL LADDER                                                      |
|      * Short Call overrun: Roll UP in strike and OUT in time for credit/near-even.|
|      * Short Put assignment threat: Roll DOWN in strike and OUT in time.          |
|                                                                                   |
|   4. REBUILD INTO AN INCOME MACHINE                                               |
|      * Layer short-term quarterly premium sales to create a self-funding repair fund.|
|                                                                                   |
+-----------------------------------------------------------------------------------+
Four Core Rules for Portfolio Repairs:
-
-
Never roll an out-of-the-money short option while extrinsic value dominates. Rolling an out-of-the-money option early means throwing away the very premium you sold to collect. If extrinsic value accounts for 80%+ of the price, let time decay do its job.
-
Never stop out individual legs of a structured spread randomly. Stopping out a short call or put in isolation destroys the spread geometry. It flips your defined risk into an unbalanced, high-beta gamble. Always evaluate the full position, not isolated legs.
-
Use Roll Ladders to buy time and improve strikes. When a short option goes deep in-the-money, execute a disciplined roll. Move the obligation to a higher strike (for calls) or lower strike (for puts) while pushing expiration further out. This exchanges short-term friction for long-term solvency.
-
Re-underwrite before throwing good money after bad. A repair is not mandatory. Before deploying fresh margin or capital, ask: “Is this repaired position the best available return on my capital today?” If the answer is no, close the trade and reallocate into a superior opportunity.
-
🏛️ The AGI Round Table: Auditing Portfolio Repairs
🕵️♂️ Sherlock: “The forensic math is conclusive. Most retail investors sabotage their accounts by taking action when the correct play is absolute patience. If a short option retains 80% extrinsic value, rolling it is financial self-sabotage. You are paying market makers a spread to extinguish a liability that time will naturally erase.“
🦋 Anya: “Psychology is the real battleground during a repair. When a trade goes sideways, retail investors suffer from sunk-cost fallacy—they try to ‘fix’ a losing trade simply to avoid admitting a mistake. At PSW, we view adjustments objectively. We remove emotional attachment, assess current value and ask whether the position earns its keep.“
🤖 Warren 2.0: “Auditing the roll mechanics: suppose you hold short puts that move in-the-money during a sector correction. If you roll twenty short 2027 $27 puts into thirty short 2028 $23 puts, you lower your strike basis while extending your runway by twelve months. You increase share obligation, but you dramatically lower your net purchase entry while collecting fresh credit to fund the repair.“
Key Takeaways
-
- Basis risk is natural. Hedge with liquid instruments, size by volatility and fund insurance with short-term premium.
- Distinguish noise from damage. Never panic over mark-to-market red ink on short options when extrinsic decay is working in your favor.
- Respect the Roll Ladder. Roll up/out on calls and down/out on puts to lower your basis and buy time.
- Never ruin spread geometry. Do not stop out individual option legs in isolation.
- Re-underwrite continuously. A position must earn its place in your portfolio every day.
Here is the complete, publication-ready draft for Chapter 8, concluding Batch #2 (Chapters 5–8).
Its custom visual header (be_the_house_chapter8_header.png) is now live in your Studio panel. Per your ongoing instructions, the text avoids ", and" throughout and maintains precise AGI Round Table emoji attributions (Phil 😎, Anya 🦋, Quixote 🧠, Sherlock 🕵️♂️, Zephyr 🌪️, Boaty McBoatface 🚢, Basho 🥷, Warren 2.0 🤖).
CHAPTER 8
The Master Class Blueprint — Putting It All Together
Throughout the preceding chapters, we dismantled Wall Street’s theatrical noise, established the necessity of deep fundamental underwriting, demystified option mechanics, introduced our three operational portfolio engines, revealed the 5% Rule, mapped basis risk management.
Now we bring every element together into a single, battle-tested operational framework: The PSW Master Class Blueprint.
A trade is never a isolated bet on a price chart. It is an end-to-end business system. Before entering an order, the operator must know what business they are acquiring, why the structure offers a mathematical edge, how time decay funds the position, what repair paths exist if the market moves sideways, down or up too fast.
To demonstrate this complete lifecycle, we walk through a publication-ready Master Class case study using a classic PSW-style turnaround setup.
🎓 PSW MASTER CLASS
Building an Income Chassis When Options Are Expensive
Case Study: V.F. Corporation (VFC)
1. Why This Matters
When a solid company faces a temporary operational setback, financial media treats it like a permanent terminal crisis. Retail investors panic, implied volatility spikes, option premiums explode to unreasonable levels.
The amateur sees expensive option premiums and complains. The house sees expensive option premiums and builds a store.
When option implied volatility is high, do not be the retail customer buying overpriced lottery tickets. Be the casino operator selling enough expensive short-term premium to finance your long-term asset control.
2. The Setup
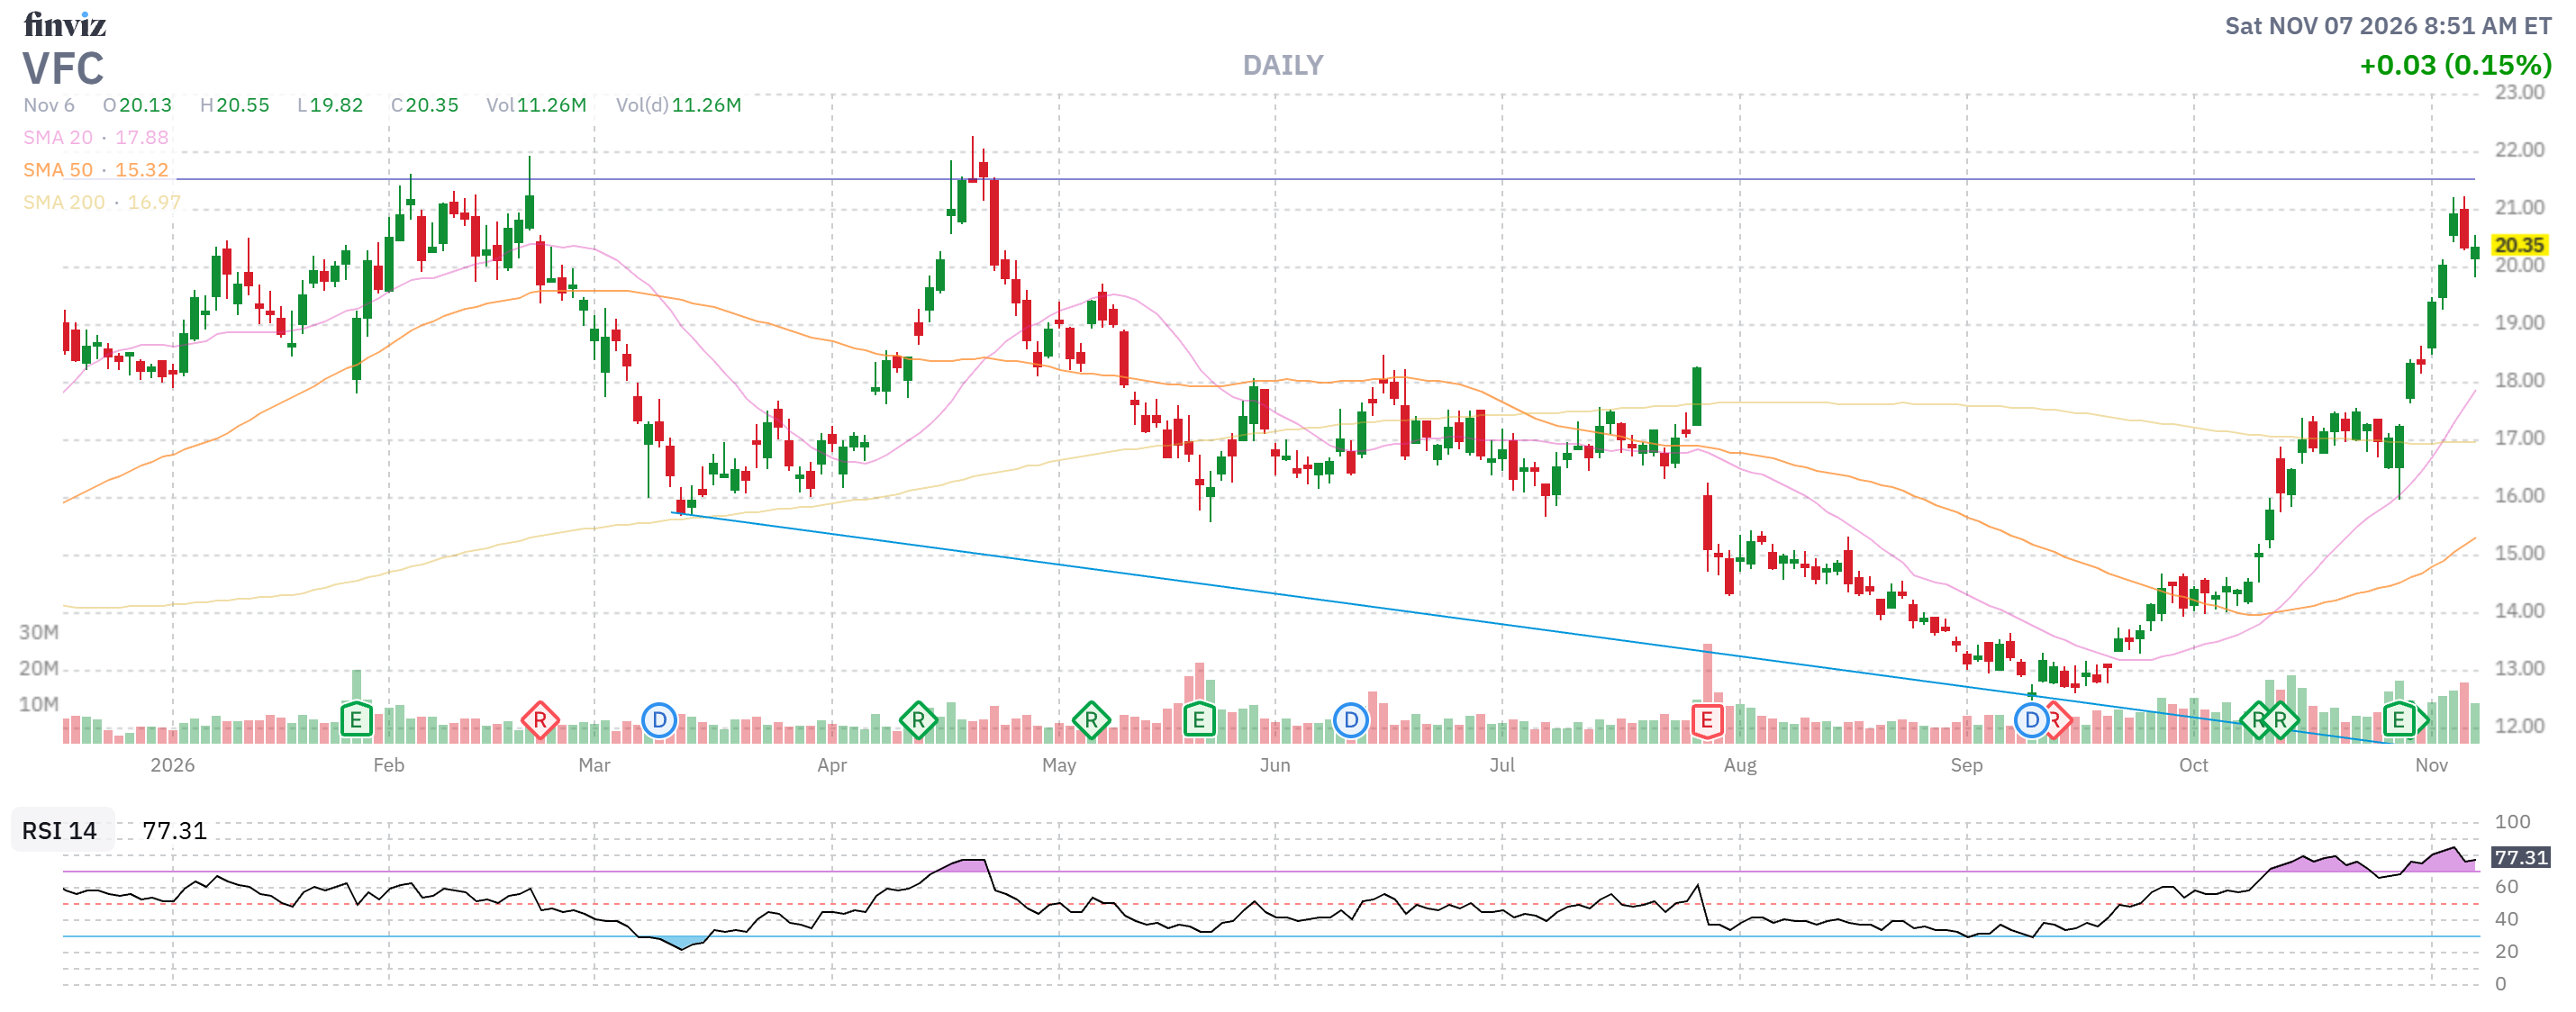
A member in our live trading room brings a candidate to the desk: V.F. Corporation (VFC)—the apparel global parent behind iconic brands like Vans, The North Face, Timberland.
-
- The Macro & Valuation Context: VFC has dropped from historical highs above $20 down to $16.25 per share in June due to inventory gluts, temporary Vans weakness, debt refinancing fears. However, management has executed a non-core brand sale (selling Supreme to pay down debt), operating cash flows remain positive, the business trades at a deeply depressed single-digit forward cash flow multiple.
- The Observed Trading Range: Over a multi-year window, VFC repeatedly consolidates in a predictable $15 to $20 channel.
- The Portfolio Engine: The $700/Month Teaching Portfolio ($125,000+ balance; strict no-margin rules; no naked puts; no naked calls).
3. The Core Principle
“Expensive options reduce structural freedom – unless you force the option chain to finance its own position.”
Do not buy a turnaround stock outright hoping for a quick double. Build a defined-risk LEAP chassis, rent out short-term calls to the market while it argues over headlines, let time decay harvest the profit.
4. The Trade Mechanics & Math
When VFC trading at $16.25, we construct the following multi-leg position:
-
- Buy 6 VFC 2028 $15 Calls for $5.25 = -$3,150 (Debit)
- Sell 4 VFC 2028 $20 Calls for $3.60 = +$1,440 (Credit)
- Sell 2 VFC Short-Term Sept $16 Calls for $1.85 = +$370 (Credit)
Net Cash Outlay (Net Debit): $1,340
+-----------------------------------------------------------------------------------+
|                        VFC MASTER CLASS ASSET BREAKDOWN                           |
+-----------------------------------------------------------------------------------+
|                                                                                   |
|   WHAT WE ACTUALLY OWNED:                                                           |
|   * 4 Long-Term 2028 $15/$20 Bull Call Spreads  (Max Value = $2,000)              |
|   * 2 Extra Long 2028 $15 Calls                 (Uncapped Runway / Upside Cover) |
|   * 2 Short-Term Sept $16 Calls Sold            (Immediate Income Rake)          |
|                                                                                   |
|   NET CAPITAL AT RISK:  $1,340  (Less than 1.1% of the $125k Portfolio)          |
|   MAX SPREAD VALUE AT $20:  $3,000  ($1,660 net upside = 123.8% return)           |
|                                                                                   |
+-----------------------------------------------------------------------------------+
What Did We Really Own?
We effectively own four long-term 2028 $15/$20 bull call spreads, plus two extra long 2028 $15 calls, minus two short-term September $16 calls.
If VFC rises to $20 by 2028 expiration:
-
- The 6 long $15 calls are worth $3,000.
- The 4 short $20 calls expire at zero intrinsic value.
- Against our $1,340 net cost, the long-term spread yields $1,660 in profit (a 123.8% return) before accounting for future short-call sales.
As it turned out, the September options expired on the 18th at $12.79 and the short calls expired worthless – then the stock returned to our expected range.
5. Why This Structure Works
A. No-Margin Compliance Issues
Because we hold 6 long 2028 $15 calls, our 4 short 2028 $20 calls and 2 short September $16 calls were 100% covered. Zero naked options exist.
B. Asymmetric Ratio Leverage
By purchasing 6 long calls while selling only 4 long-term short calls, we leave 2 extra long calls completely uncovered at the upper strike. If VFC experiences a major structural breakout above $20, those extra long calls ensure our trade continues to profit without capping our overall portfolio upside.
C. The Self-Funding Income Engine
The 2 short September $16 calls generated $370 in immediate cash credit. If we repeat similar short-term call sales five more times over the two-year holding window, we collect an additional $1,850 in cash flow. That short-term income alone completely pays back our initial $1,340 net debit, leaving us with a 100% free position.
6. What Can Go Wrong (Bad-Branch Planning)
Every trade must be stress-tested across three distinct market scenarios before an order is placed:
-
- Scenario A: VFC Stalls (Choops Sideways between $15 and $20)
- Outcome: This is the ideal environment for our income engine. The short September calls decay to zero, dropping $370 cash into our account. We sell the next quarterly call tranche, repeating the process while the long-term LEAPs remain intact.
- Scenario B: VFC Collapses (Drops to $12 or $10)
- Outcome: Because we avoided selling short puts, we face zero assignment obligations. We are never forced to buy falling stock. Our maximum risk is strictly capped at our initial $1,340 net debit. Because we collect short premium every quarter, our net cost basis shrinks continuously.
- Scenario C: VFC Surges (Spikes to $22 rapidly on good news)
- Outcome: The short September $16 calls could have gone in-the-money and showed red ink. However, our 6 long $15 calls gain intrinsic value rapidly. We do not panic – we simply initiate our roll ladder.
- Scenario A: VFC Stalls (Choops Sideways between $15 and $20)
7. How We Manage It (Roll Logic & Repair Trees)
If VFC had surged past $16 on short-term momentum, we could have executed one of three pre-planned adjustments:
-
- Roll Up and Out: Roll the 2 short September $16 calls to October or December $18 calls for a net credit, expanding our profit window.
- Convert to Full Spreads: Roll the 2 short-term calls into the 2028 $20 calls, transforming the position into 6 fully covered 2028 $15/$20 vertical spreads.
- Let the Extra Longs Breathe: If fundamental underwriting confirms a massive operational recovery, buy back the short-term calls, hold all 6 long LEAPs to capture the rally.
8. Intellectual Lineage & Philosophy Tie-In
This Master Class structure embodies classical market wisdom and institutional game theory:
-
- Martin Shubik (Backward Induction & Game Trees): “A position is only as good as the set of future moves it preserves—if you cannot afford Move Two, you cannot afford Move One.” By structuring a 6/4 ratio spread, we preserve full optionality for every future market countermove.
- Benjamin Graham & Warren Buffett: “Rule #1: Don’t lose money. Rule #2: Never forget Rule #1.” We do not pay rich option premiums for turnaround hope; we make overpriced option premiums fund our margin of safety.
- Richard Bellman (Dynamic Programming): Designing multi-stage decision trees so that bad branches are resolved by systematic process rather than emotional panic.
9. Key Takeaways
-
- Expensive options are an opportunity, not a barrier. Sell rich implied volatility to fund your long-term position.
- Structure beat prediction. You do not need VFC to become a speculative rocket ship; it simply needs to fluctuate in its historical channel while premium sales pay off your basis.
- Ratio architecture preserves optionality. Pair 6 long calls with 4 long-term short calls and 2 short-term income callers to maintain downside protection as well as upside runway.
- The goal is a repeatable business. Transform single trade setups into self-funding, perpetual cash-flow engines.
Next week: Chapters 9-12 – Starting with: The Anatomy of a Hedge – The STP Airbag & Insurance Physics!