


A breakout isn’t confirmed just because a stock moves above a chart level. Webinars on identifying breakout stocks teach traders to use technical analysis to spot potential moves and distinguish a sustained breakout from a false start, in both trending and range-bound markets.
It makes sense to look for clear evidence before acting. The same price move can mean different things depending on the broader trend, the level being tested, and whether the move continues. A chart can flash green, then reverse quickly.
This guide explains what to watch in both market conditions, how momentum traders assess individual stocks, and which confirmation clues can help separate a durable move from market noise. It also shows how educational webinars and market analysis can support a more disciplined approach, without treating any signal as certain.
Key Takeaways
- Adapt breakout analysis to the market context: trending conditions and range-bound action call for different reads of price levels.
- Use technical signals to assess momentum in individual stocks, rather than treating a move through a chart level as proof of strength.
- Look for signs that a breakout is holding or failing to help distinguish follow-through from a false move.
- Evaluate webinar content by whether it helps you apply breakout strategies and interpret market conditions with more discipline.
Finding breakouts in trending and range-bound markets
Breakout setups depend on market structure. A trending market provides directional context, while a range focuses attention on its boundaries. In fast-moving markets, momentum traders use technical breakouts and breakdowns to pursue measured trades.
Selecting Suitable Stocks
Start with stocks that have a clear, readable price structure. In a trend, look for a stock moving in the market’s direction and approaching visible resistance. In a range, identify shares repeatedly moving between recognizable support and resistance. A clean setup makes it easier to define the level that would invalidate the trade idea.
Then consider liquidity and volatility together. A stock that moves sharply but trades erratically can make its breakout level harder to interpret. Compare recent price action with the chart structure, and focus on setups where the potential trigger stands out from ordinary back-and-forth movement.
Screening for Approaching Breakouts
Screening tools can narrow a broad watchlist by finding stocks near recent resistance, with rising volume, or in a tightening price range. Set filters around the chart levels and price behavior relevant to your strategy, then review each result manually. A screen identifies candidates; it doesn’t confirm a breakout.
What screening tools can find stocks approaching a breakout? Technical screeners can flag shares nearing resistance or consolidating near a prior high. Reviewing the chart helps show whether the level matters in the current trend or range.
For a fast-moving stock, base the decision on a defined trigger, not a headline. Watch whether the price holds beyond the level, whether trading activity supports the move, and where the setup would fail. Momentum traders use breakouts and breakdowns for fast, measured trades, so a clear exit condition matters as much as the entry signal.
A stock-selection model discussed by JD Henning used more than 75 variables. His model initially produced 20 stock selections per week before members asked for four. The figures illustrate a practical screening lesson: a long candidate list still needs prioritization. Rank stocks by clear chart levels, relevant market direction, and readable price action, then focus on the strongest setups.
Trading momentum in individual stocks
Breakout trading uses technical analysis to identify when a stock moves beyond a meaningful price level. Momentum traders assess whether buying or selling pressure is carrying the move forward. For an individual stock, the setup combines a trigger level, price behavior, and a clear point where the trade idea no longer holds.
Use breakout trading when a stock approaches a defined level and its price action supports a directional move. A stock accelerating toward resistance may offer a different setup from one drifting sideways, so the market context matters. Momentum models discussed by JD Henning update every 15 minutes to check stock characteristics. That kind of systematic review can help keep attention on changing conditions rather than yesterday’s signal.
Risk management starts before entry. Define the price that would invalidate the setup, then size the position according to the risk you can accept. A stop level chosen without reference to the stock’s price behavior may be too tight or too loose. Consider, too, whether a fast move has already stretched far beyond its trigger. A breakout entry is a plan, not a reason to chase every rising candle.
Systematic momentum trading applies consistent criteria across potential setups. JD Henning reported an average return of about 4.45% for his 2023 MDA breakout picks. He also described an example stock that rose 53% for the week measured and over 94% while its signal remained green. Those figures describe specific examples, not a template for future trades. Use a repeatable process to assess the trigger, momentum, and exit conditions. For a chart-based way to study setups, explore market charts and analysis alongside your trading rules.
Distinguishing genuine breakouts from false moves
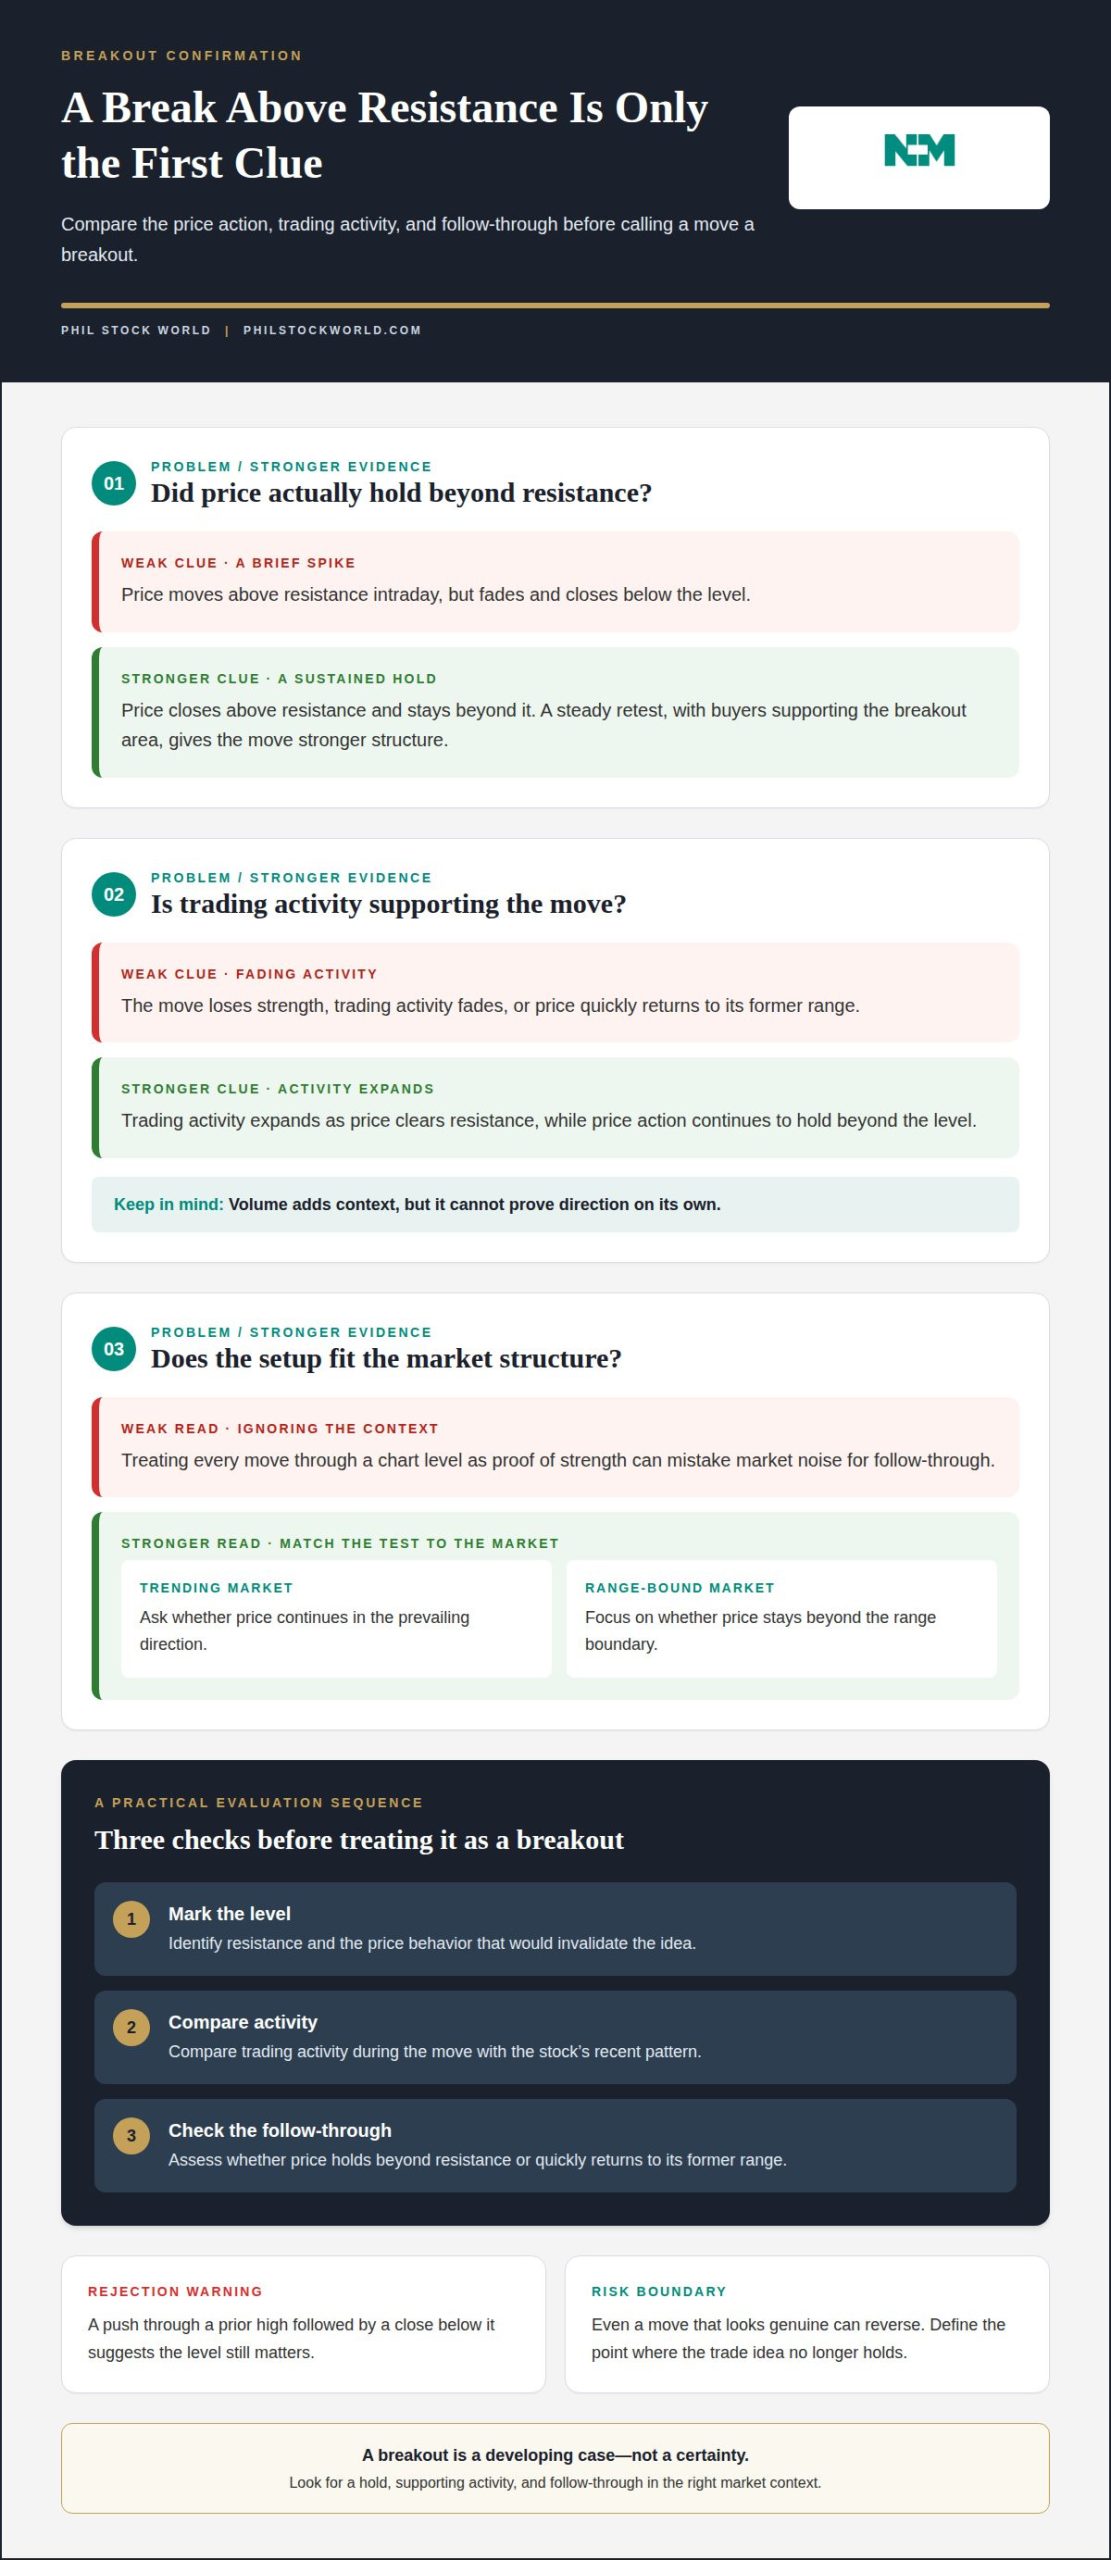
A price crossing resistance is an initial clue, not the whole case. Compare volume, closing behavior, and follow-through to judge whether buyers are sustaining the move or the price is slipping back.
Volume and Price-Action Confirmation
What volume and price-action signals confirm a breakout? Look for trading activity to expand as price clears resistance, then watch whether price stays above that level. A strong close beyond resistance carries more weight than a brief intraday spike that fades before the session ends.
Consider a stock that pushes through a prior high but closes below it. That rejection suggests the level still matters. If the price later retests the breakout area and buyers support it, the move has a stronger structure. Volume adds context, but it can’t prove direction on its own.
Evaluating a Breakout Setup
What steps do webinar instructors recommend for evaluating a breakout setup? Start by marking resistance and identifying the price behavior that would invalidate the idea. Next, compare trading activity during the move with the stock’s recent pattern. Then assess whether price holds beyond resistance or quickly returns to its former range.
These steps separate observation from action. For example, a stock may gap above resistance on heavy activity, then lose that level by the close. That is weaker evidence than a close above resistance followed by a steady retest. A breakout-focused educational webinar can show how each clue appears on a chart, including situations where signals conflict.
False moves often show rejection, fading activity, or a return to the prior range. Even a move that looks genuine can reverse, so use a defined invalidation point rather than dismissing a failed setup as temporary noise. Compare the same clues on trending and range-bound charts. In a trend, ask whether price continues in the prevailing direction. In a range, focus on whether it stays beyond the boundary. That context helps prevent one dramatic candle from driving the decision.
Which reputable platforms offer breakout stock trading webinars?
Consider three types of platforms: exchange education programs, brokerage learning centers, and specialist trading educators. Each may offer chart-based sessions, but the platform name alone doesn’t establish webinar quality. Compare the instructor’s relevant experience, the session’s learning goals, and whether examples explain both successful and failed setups.
Exchange education can offer structured market learning. For example, Jyoti Budhia is registered as a trainer with the National Stock Exchange, Bombay Stock Exchange, and NISM. That credential provides context about training experience, but doesn’t establish whether a particular webinar covers breakout trading in depth. Read the session description for technical-analysis content, chart examples, and risk management.
Brokerage learning centers may connect lessons with the charting tools their users already know. Specialist trading educators may instead focus on a particular method, such as momentum or technical breakouts. Before choosing either format, check whether the instructor explains how they define resistance, interpret volume, and respond when price falls back into its previous range. A useful session makes its decision process visible.
Use this quick comparison before registering:
- Topic fit: Confirm the session covers breakouts, not just general investing or market terminology.
- Instruction: Look for chart walkthroughs that show entry logic and invalidation points.
- Evidence: Prefer explanations that distinguish historical examples from future expectations.
- Format: Decide whether a live lesson or recorded session better suits your learning pace.
A recorded breakout trading webinar is one hour long, so a focused replay can help you review chart decisions. Choose instruction that teaches a repeatable way to assess setups, not one that promises profitable trades. A clear lesson should leave you better able to explain why a breakout attempt strengthened, stalled, or failed.
Phil Stock World: Educational Webinars
Phil Stock World offers Educational Webinars for readers who want to build their understanding of market setups. Pairing instruction with Market Charts and Analysis can help put price movement and technical signals into context. For a closer look at an existing portfolio, a Virtual Portfolio Review is another option. Premium Membership provides access to member content.
These resources are a natural next step if you’re building a more consistent process for studying stocks and market conditions. Use educational material to sharpen your analysis, not as a substitute for your own decisions. Explore Phil Stock World’s Educational Webinars and other market resources to find a useful next step.
Turn Your Next Chart Review Into Practice
Webinars on identifying breakout stocks are most useful when you apply their lessons in a repeatable routine. Choose a chart, write down the setup you see, and record what would change your view. Reviewing those decisions over time can help you recognize which signals you interpret consistently and where you need more practice.
Keep the process grounded in evidence, not excitement. Even a compelling setup calls for independent judgment, especially when price action shifts quickly. Treat each market session as another chance to refine your questions and approach.
For a next step that fits your learning goals, contact Phil Stock World. Bring your interest in breakout trading and continue building a thoughtful process, one chart at a time.
Frequently Asked Questions
What You Will Learn?
Turn each chart observation into a structured review. Record the stock, the level you’re watching, and the market context. After the move, note whether your original reasoning held up. Comparing notes across setups can reveal whether you’re reacting to price movement or applying consistent criteria. It also gives you concrete questions to bring to future learning sessions.
Will I receive the recording after the live webinar is over?
The webinar recording is expected to become available within 24 hours after the live session ends. Access to that recording lasts for a lifetime after registration. That makes replay useful for pausing at a chart, revisiting an instructor’s explanation, and comparing the lesson with a later market example. Recording access and timing depend on the specific webinar’s stated terms.
What are the best upcoming webinars on identifying breakout stocks?
Choose a session that uses annotated stock charts and explains both breakout attempts and failed setups. A useful agenda connects market context, price behavior, and trade review rather than relying on isolated chart patterns. Before registering, look for clear learning outcomes and information about the instructor’s background. This helps you match the session to your experience and the questions you want answered.
What technical indicators help identify a stock breakout?
Volume, moving averages, and the Relative Strength Index (RSI) can add context to a breakout setup. Volume shows how much trading accompanies a move; moving averages help frame the prevailing direction; RSI describes recent momentum. None confirms a breakout alone. For example, rising RSI as price nears resistance may strengthen interest in a setup, while a reversal or fading activity can change the picture.
How do traders distinguish a true breakout from a false breakout?
Traders look for price to establish itself beyond a watched level, rather than briefly crossing it and retreating. One practical review is to compare the close with the breakout area, then watch whether a later pullback holds or slips back through it. Record the original trigger and invalidation condition before entry. That makes it easier to assess the setup without changing the rules afterward.
How do support and resistance levels help identify breakout opportunities?
Support and resistance mark areas where price has stalled, reversed, or found buyers in the past. A trader can use resistance to define a possible upside trigger, and support to frame a downside break or a point where a setup weakens. Repeated tests of the same ceiling, for example, can help identify the level to watch. These zones guide analysis; they don’t dictate what price will do.