


A quiet price chart can be doing more than going nowhere. Understanding market cycles for trading decisions means recognizing the shift from accumulation to mark-up, then distribution and mark-down. During accumulation, prices may move sideways within a range for years before a clearer trend emerges.
It’s easy to focus on the latest rally or sell-off and miss the phase taking shape underneath. The useful question isn’t just whether prices are rising or falling, but what buying and selling pressure may signal, and how much confidence the evidence warrants.
This guide explains market cycles and the difference between accumulation and distribution. You’ll also see how cycle phases can inform decisions about timing, trend confirmation, and risk, without treating a pattern as a promise. By connecting the broader cycle framework to practical chart signals, you can read market movements in context and make decisions with a steadier hand.
Key Takeaways
- Use the four cycle phases as context for price action, not as a timetable for what the market will do next.
- In accumulation, a sideways range can matter; look for signs that buying pressure is building before assuming a breakout is underway.
- Rising trading volume without a corresponding price increase can signal distribution, so weigh volume alongside the trend.
- Match cycle signals to your trading time frame, and use tools such as moving averages to assess trends and possible turning points.
Accumulation phase
Accumulation is a market-cycle phase in which buying absorbs selling without immediately driving prices higher. In the Wyckoff sequence, it comes before mark-up, distribution, and mark-down.
Accumulation Within the Wyckoff Sequence
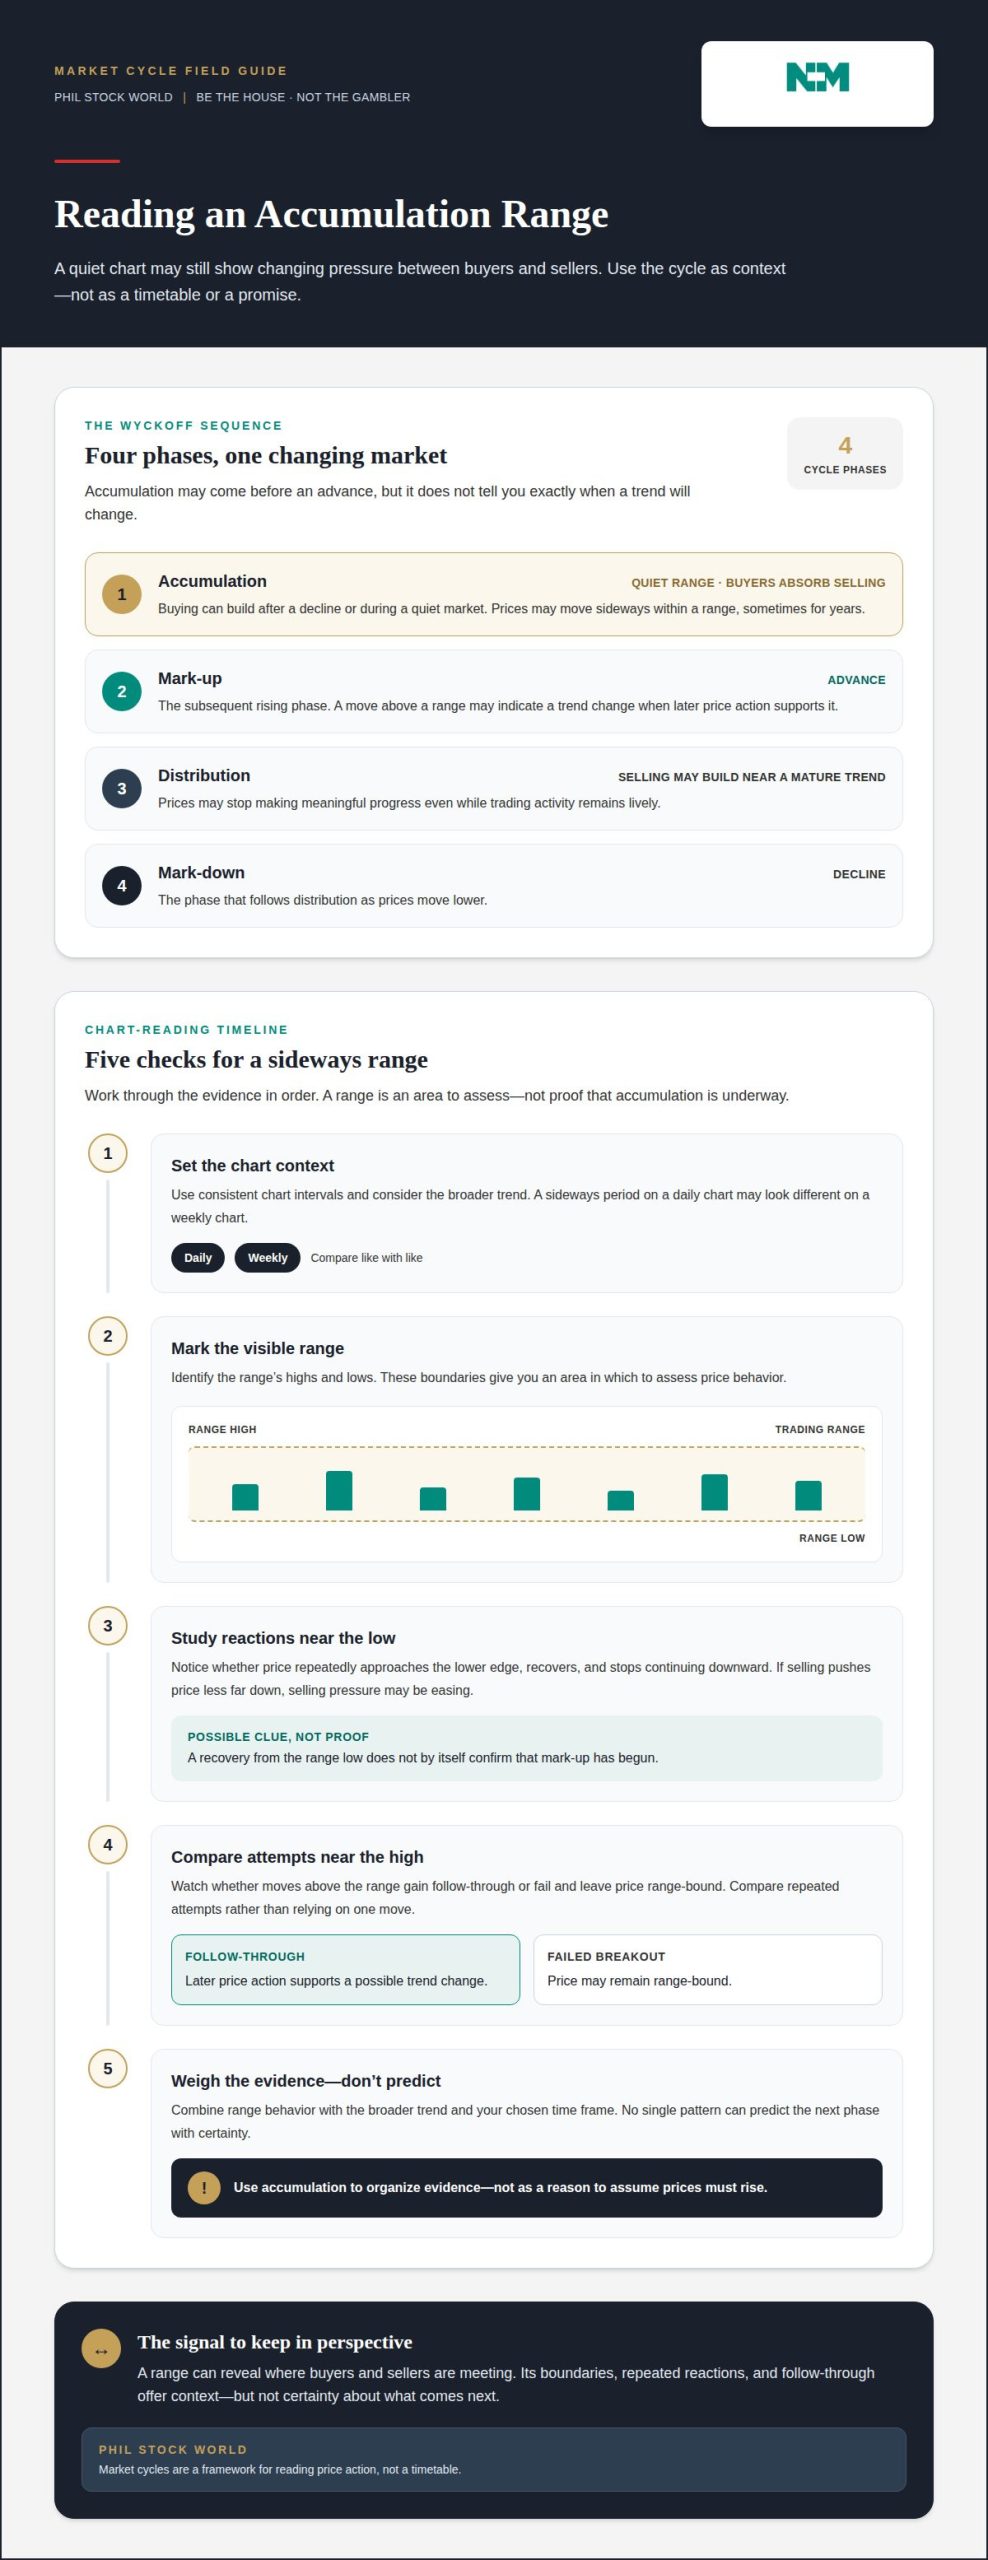
In the Wyckoff framework, accumulation is the phase in which buyers build positions after a decline or during a quiet market. It can precede a trend shift, but it doesn’t show exactly when that shift will happen. Mark-up describes the subsequent advance; distribution is where selling may build near a mature trend, followed by mark-down as prices decline. These phases provide context, not a timetable.
Sideways Price Action During Accumulation
Sideways price action means a stock moves within a trading range instead of establishing a clear upward or downward trend. During accumulation, prices can remain in a range for years. That pause matters because a chart that looks inactive may still reflect changing pressure between buyers and sellers. The range alone doesn’t prove accumulation, but it gives traders a defined area in which to assess price behavior.
Consider a stock that repeatedly falls toward the lower edge of its range, then recovers without continuing to decline. A trader can compare those reactions with moves near the upper edge. If selling no longer pushes the price as far down, that may suggest selling pressure is easing. It’s a clue to weigh, not proof that mark-up has begun.
To assess the setup, mark the range’s visible highs and lows on the chart. Then note whether the price repeatedly holds those boundaries and whether breakouts or breakdowns gain follow-through. A move above the range may indicate a trend change if subsequent price action supports it. A failed breakout, by contrast, can leave the stock range-bound. No single pattern can predict the next phase with certainty.
Time frame matters, too. A sideways period on a daily chart may look different on a weekly chart, where shorter swings blend into a broader pattern. Compare like with like: use consistent chart intervals and consider the stock’s broader trend before interpreting a quiet range. Accumulation is most useful as a framework for organizing evidence, not as a reason to assume prices must rise.
What Are Market Cycles?
Market cycles are recurring shifts in economic conditions, investor behavior, and stock prices. Traders identify phases by combining economic signals with chart evidence, rather than relying on a single indicator.
Economic and Technical Cycle Indicators
Economic and technical indicators are data points that help describe market conditions and price behavior. GDP, inflation, interest rates, and corporate earnings can show changes in the economy, while trading volume, market breadth, and price trends show how stocks are responding. To assess a likely phase, compare these signals rather than treating any one data point as a verdict.
Traders can assess the current phase by checking whether economic conditions and price action support expansion, weakening momentum, or recovery. For example, rising earnings alongside stronger market breadth may support an advancing trend, while deteriorating breadth can reveal weakness beneath a headline index.
Technical Analysis and Dow Theory
Technical analysis studies historical price and volume behavior to assess trends and possible turning points. A chart can help confirm whether market action supports an economic interpretation. Dow Theory is a framework for reading market trends through price action; traders can use it to assess whether a move is broad and sustained or merely a short-lived swing.
For instance, higher highs and higher lows after a breakout can indicate that a stock’s mark-up stage has begun. Weekly charts also help put short-term moves in context, rather than treating each daily fluctuation as a new cycle.
Cycle Duration and Historical Examples
Market-cycle duration depends on the market and time frame being analyzed, so cycles can span minutes to years. This matters because a day trader and a long-term investor may read the same price movement differently. Short-term trading cycles can last 1-30 days, while intermediate cycles may last 1-6 months.
The U.S. business cycle typically lasts 4 to 10 years. Historical examples include the 2007-2009 Global Financial Crisis and the 2020 pandemic crash, both useful turning-point case studies. These events show why historical comparisons can add context, but they don’t supply a precise schedule for the next cycle.
Interest Rates, Inflation, and Central Bank Policy
Interest rates, inflation, and central bank policy influence borrowing costs, spending, and expectations, which can shift economic growth and stock valuations. Their effects matter because markets may respond to the direction of policy as well as incoming economic data. In early 2022, the U.S. 10-year Treasury yield was below 1.5%, then climbed to a peak above 4.5% by 2023.
That change illustrates how a shift in rates can alter the backdrop for stocks, but it doesn’t identify a cycle phase by itself. Pair policy and inflation trends with earnings and chart behavior; Market Charts and Analysis can help bring those signals into view.
Distribution phase
Distribution is a market-cycle phase in which selling meets demand near the end of an advance. Prices may stop making meaningful progress even as trading activity remains lively. One possible clue is a mismatch: volume increases, but prices don’t rise. That pattern can suggest buyers and sellers are active while upward momentum is losing force.
Picture a stock repeatedly approaching a recent high, then slipping back despite heavy trading. The repeated stall matters more than one busy session. Compare each attempt: does the price make sustained progress, or does selling absorb buying near the same area? In distribution, optimistic sentiment can remain strong even as price action becomes less convincing. That gap may precede a downturn, but it doesn’t establish one on its own.
Volume needs context. Rising trading volume without a price increase can be a hallmark of distribution, but volume alone doesn’t reveal who is trading or why. Consider it alongside the stock’s trend, repeated reactions around resistance, and market breadth. If several measures weaken together, the distribution interpretation has more context. If the price continues advancing and holds new ground, a single volume surge may simply reflect active trading.
For trading decisions, the practical use is to reassess exposure and avoid treating optimism as confirmation. A trader tracking a stock near a prior high might note whether each rally attracts buyers but fails to extend. If the price later breaks support, that can add evidence of weakening demand; it should still be weighed against the broader market trend. Retail traders may have different advantages from smart-money traders, but neither group can infer a market turn from volume alone.
Treat distribution as a developing condition, not a precise sell signal. Mark the price areas where advances repeatedly stall, then watch whether selling starts pushing the stock lower. A shift toward lower highs and lower lows would provide stronger evidence of a downturn than rising volume alone. Keeping these signals distinct helps traders tell fading momentum from ordinary market noise.
How market cycles influence trading decisions
Cycle awareness helps traders adapt their approach as trends and volatility change. Understanding market cycles for trading decisions means using phase signals to plan, not to call an exact top or bottom.
Trading Decisions Across Cycle Phases
Using cycle phases in trading means adjusting entry, exposure, and expectations to current price action. This matters because the same strategy can behave differently in a steady advance and a sharp downturn. A trader following a 7-10 day swing cycle, for example, can use shorter-term signals while keeping the broader market direction in view.
To manage risk and position size, define the price level that would weaken the trade idea, then size the position around the loss you’re prepared to accept. If volatility rises or the invalidation point moves farther away, reducing exposure can keep one position from dominating the portfolio. A 200-day moving average can frame the broader trend, while shorter-term patterns inform timing.
Understanding market cycles for trading decisions also means resisting the urge to declare a bottom too early. Markets have historically recovered after markdown phases, but timing varies. Instead, traders can look for improving price behavior and reassess when a move misses its expected timing window. That keeps a thesis responsive to new evidence.
Risks of Mistiming Cycle Transitions
Mistiming a transition means acting as though a new phase has begun before price action supports that view. Entering prematurely near a supposed bottom can expose a position to further declines; exiting too early can leave a trader out of a continuing advance. Exact tops and bottoms are extremely difficult to predict.
Unexpected global events, geopolitical developments, or monetary-policy shifts can disrupt familiar patterns. Track cycle performance data for 90 days to assess emerging signals, and revisit the thesis when movement diverges from expectations.
For a clearer view of cycle signals across market conditions, explore Market Charts and Analysis and connect chart evidence to your trading decisions.
Phil Stock World: Market Charts and Analysis
Phil Stock World’s Market Charts and Analysis can help readers place cycle signals in a broader market context. When a chart suggests a shift but the evidence is mixed, reviewing price trends alongside market commentary can help clarify what the movement may mean.
Educational Webinars offer another way to build familiarity with market concepts, while a Virtual Portfolio Review provides a setting to examine how market conditions relate to portfolio positions. Premium Membership gives readers access to member content, including market charts and analysis.
These resources support learning and analysis; they don’t remove the uncertainty inherent in trading or make decisions for you. If you’d like to explore how these resources fit your approach, contact Phil Stock World.
Make Your Next Market Decision More Deliberate
A useful next step is to turn cycle analysis into a repeatable decision process. Before acting, write down what current market behavior suggests, what evidence would challenge that view, and what change would prompt you to reassess. This simple discipline shifts attention from predicting every turn to responding thoughtfully as conditions evolve.
Understanding market cycles for trading decisions is most valuable when it shapes how you evaluate uncertainty, not when it becomes a forecast you follow blindly. Keep your reasoning tied to observable evidence, and let new information update your view. The goal isn’t to catch every move. It’s to make each decision with a clearer sense of its assumptions and risks.
If you’d like to continue the conversation about applying market analysis to your approach, contact Phil Stock World. Keep learning, stay curious, and take your next step with intention.
Frequently Asked Questions
How Do Phases Impact Financial Instruments?
Each phase can affect assets through different market forces, including earnings expectations, interest rates, and supply and demand. For example, a stock’s outlook may shift as investors revise expectations for company earnings, while bond prices can respond to changing interest-rate expectations. The same economic backdrop won’t affect every instrument in the same way, so compare the forces relevant to each asset rather than assuming one cycle signal applies equally across markets.
How Do Sentiments Impact Market Trends?
Investor sentiment can influence how strongly buyers and sellers respond to new information. Optimistic expectations, for example, may support a stock after encouraging earnings news, while growing concern can make negative news weigh more heavily. Sentiment is useful context, not a stand-alone trading signal: compare it with actual price behavior and market breadth. A mismatch between upbeat expectations and weakening prices may warrant closer analysis.
What are the main phases of a market cycle?
The four commonly described phases are accumulation, mark-up, distribution, and mark-down. They describe a possible progression from a quieter trading range to rising prices, then weakening advances and declining prices. The sequence is a framework, not a fixed schedule: phases can be difficult to identify in real time, and price action may not follow a neat path. Traders use the labels to organize observations, not to assume what comes next.
Which economic indicators signal changes in market cycles?
GDP, inflation, interest rates, and corporate earnings can help reveal shifts in economic conditions. Their signals are more useful when considered together. For example, changing inflation alongside interest-rate movements can alter expectations for borrowing and spending, while earnings show how businesses are performing. Compare these indicators with market behavior rather than treating a single report as proof that a cycle has changed.
How do market cycles differ across stocks, bonds, commodities, and crypto?
Cycles can differ because each market responds to distinct drivers. Stock prices reflect expectations about companies and earnings; bonds are sensitive to interest-rate and inflation expectations. Commodity prices can respond to shifts in supply and demand, while crypto prices may be especially responsive to changes in investor appetite and market liquidity. These are broad influences, not guarantees, so assess each asset’s own price behavior and relevant context.
What technical indicators help confirm market cycle trends and reversals?
Moving averages, trading volume, market breadth, and price trends can help assess whether a move is gaining or losing support. A moving average, for instance, can smooth short-term fluctuations, while breadth shows whether participation extends beyond a few stocks. Look for agreement across indicators and the relevant chart time frame. A signal that conflicts with the broader price trend calls for caution, not automatic action.