
Courtesy of Charles Hugh Smith, Of Two Minds

Here’s the Great Game: mask the nation’s rising wealth inequality with Central State spending that keeps the debt-serfs passive–all funded by debt, of course. While we may not make that much stuff in America any more, we can say that the nation’s gigantic wealth inequality is totally Made in the U.S.A. Before we examine the data in some charts, I want to stipulate that great wealth in and of itself does not make a person an "enemy of the people" or threat to democracy. I confess to having generally lumped the top 1% of wealth holders into one category, something I have decided to stop doing, as this misses two critically important distinctions:
1. Not all wealth is created equally. Compare Steve Jobs, who is a billionaire for developing and selling "insanely great" mass-market technologies that people willingly buy because it enhances their lives, with a person who made his $1 billion by insider trading or misrepresenting the risk of his company’s stock (basically the same thing). (If you need a hint here, think "Countrywide" or "Enron.")
Clearly, there is a distinction between those two fortunes: one created value, employment for thousands of people, and tremendous technological leverage for millions of ordinary people. The other enriched one crooked insider via trickery and deception.
2. Wealth destroys democracy and free markets when it buys the machinery of governance. Larry Ellison has made billions by developing and selling databases and business services. To the best of my knowledge, he spends his wealth on personal hobbies such as large homes and racing yachts. His lobbying efforts appear to be confined to yachting and the possible purchase of sports franchises. In other words, the political influence of his billions is localized and benign in terms of Federal policy decisions.
Compare that to the millions spent by the "too big to fail" banking industry to buy Congressional approval of their cartel’s grip on the nation’s throat: Buying Off Washington To Kill Financial "Reform". Much of the debate about wealth inequality focuses on whether the super-wealthy are "paying their fair share" of the nation’s taxes. If we refer to point 2 above, we see that if the super-wealthy are allowed to buy the machinery of governance, then they will never allow themselves to be taxed like regular tax donkeys.
In that sense, the debate over tax rates is pointless, because as long as the super-wealthy own the levers of Federal governance and regulation, then they will buy exclusions, loopholes, rebates, subsidies etc. which relieve them of whatever official tax rates have been passed for public consumption/propaganda purposes.
Let’s take a look at wealth in America.
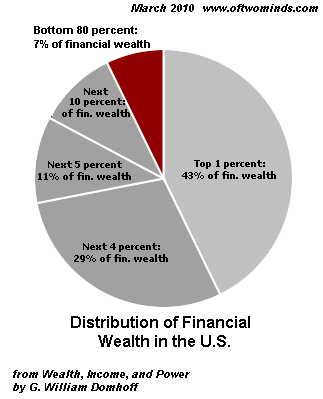
In Who Rules America?, Sociologist G. William Domhoff draws an important distinction between the net worth held by households in "marketable assets" such as homes and vehicles and "financial wealth." Homes and other tangible assets are, in Domhoff’s words, "not as readily converted into cash and are more valuable to their owners for use purposes than they are for resale."
Financial wealth such as stocks, bonds and other securities are liquid and therefore easily converted to cash; these assets are what Domhoff describes as "non-home wealth" on his website Wealth, Income, and Power.
As of 2007, the bottom 80% of American households held a mere 7% of these financial assets, while the top 1% held 42.7%, the top 5% holds 72% and the top 10% held fully 83%.
According to the Fed flow of funds data, total assets of households and non-profits (a small slice of the pie) are $71.9 trillion, liabilities are $13.9 trillion and net worth–everything from jet skis to homes to stocks to bonds–is $58 trillion.
Here is a snapshot of total assets by category:
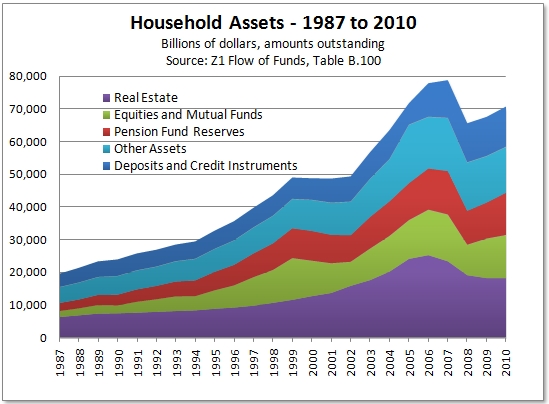
Pension funds and "other assets" include Treasury and corporate bonds, favored holdings of pension funds and the wealthy due to their relative safety and guaranteed yield.
Here is a snapshot of stock ownership:
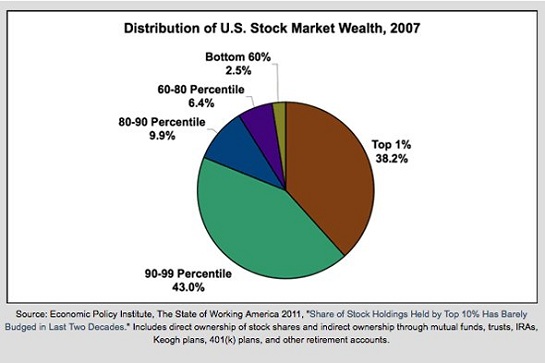
No surprise there: the top 1% owns roughly 40% of all stocks, and the top 10% own 81%.
Wealth comes from earned and unearned (rent, dividends, etc.) income and capital appreciation, so it’s no surprise that the income of the wealthiest segment has also far outpaced the lower 95%:
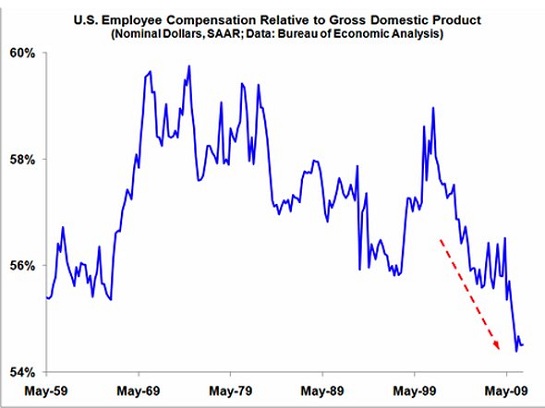
Meanwhile, the ratio of earned income to GDP is plummeting, which suggests that less of the national income is going to wages and salaries:
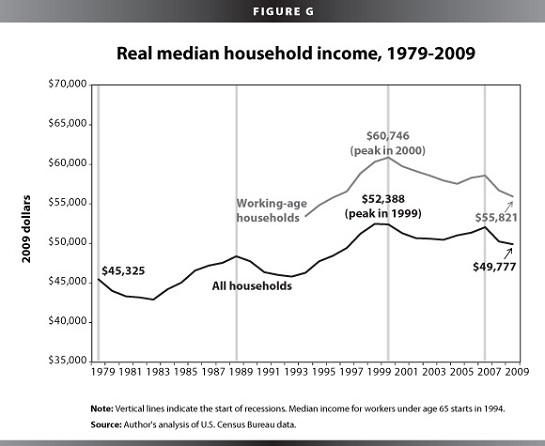
Thus it’s no surprise that the median income has actually declined during the past decade of bogus debt-based "prosperity":
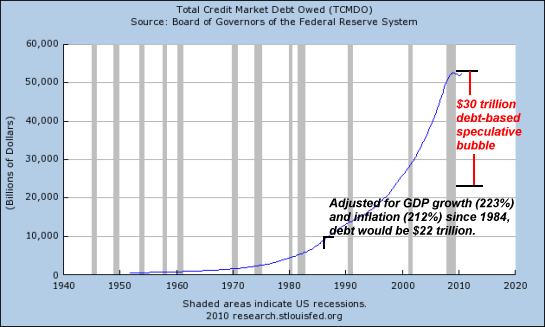
Here’s a snapshot of just how debt-based that phony "prosperity" was:
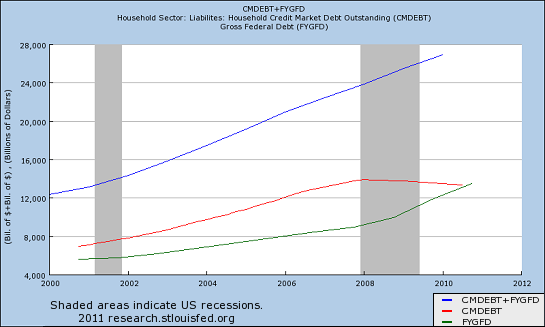
Private borrowing declined as the home equity extraction ATM was closed, but the Federal government helpfully picked up the slack, borrowing and spending roughly $2 trillion a year so that total debt kept right on rising:
You have to wonder how much of our national wealth is the result of private consumption being transferred to the Federal ledger:
Put these charts together and you get the outlines of the Great Game: to keep the debt-serfs from rebelling, the Financial Elites have OK’d the funding of private spending by Federal debt. The Federal Reserve is a key player in the Game, of course, and its "job" is to suppress interest rates so the true costs of this skyrocketing Federal debt are masked, at least for awhile.
Beneath the happy surface of Federal transfers and spending funded by debt, earned incomes for the bottom 95% are falling and wealth is accumulating in the top 1%. The Federal Reserve’s project of goosing stocks and bonds has greatly enriched the holders of those assets, while doing essentially nothing for the bottom 90% except increasing their government’s debt load.
It’s painfully obvious that the Federal government and the Fed are the handmaidens of the politically powerful Financial Elites. Why spend your own money on bribes, bread and circuses when you can arrange for the Central State to borrow the money? Why, indeed. "Austerity" is of course a modest reduction in the amount of money borrowed and spread around to keep the masses safely passive, but a few trillion trimmed here and there over a decade won’t change the Great Game.
Frequent contributor B.C. summarized this reality quite cogently:
The top 1% of US households receive nearly as much income each year as the value of Germany’s GDP; and they receive more income than all other nations’ GDP (individually, not cumulatively) but the GDPs of Japan, China, and the US.
The financial wealth of the top 1% exceeds the value of the entire GDP of the EU (the world’s largest GDP in aggregate).
Moreover, the top 1% could lose 90% of their financial wealth and still collectively have more wealth than all but each of the world’s top eight GDPs (US, China, Japan, Germany, France, UK, Brazil, and Italy).
When one hears that wealth and income inequality is extreme in the US, I suspect many do not realize just how extreme it really is.
Peak Oil (falling net energy and available net exports), government "austerity", and the effects of population overshoot imply that wealth and income concentration will become even more extreme, affecting what remains of the professional middle class, who are largely dependent upon the ongoing growth of debt-money and government borrowing and spending.
Thank you, B.C. In other words, the top 15% better keep their eyes on the referee, if you know what I mean.