

 Well, here’s what all the AI fuss is about:
6 months ago (March 24th, 2026), we decided to test the power of the AGI Round Table Consulting Group by allowing our group of Super-Intelligences to take over the selection process for the Money Talk Portfolio – a portfolio we ONLY touch once per quarter (approximately), on the days we are taping the show.
Because of that restriction, MTP trades have to be “bullet-proof” – in the March show’s case, literally so – as the War had just begun and there were more cross-currents than even the most skilled humans (me, for example) were able to account for all at once.
Nonetheless, the Round Table gave us very clear investing guidelines, which PSW put to work in ALL of our Member Portfolios but particularly the Money Talk Portfolio, where we had to get things just right in this rapidly-changing environment – making critical decisions on March 24th that we are only TODAY able to finally adjust.
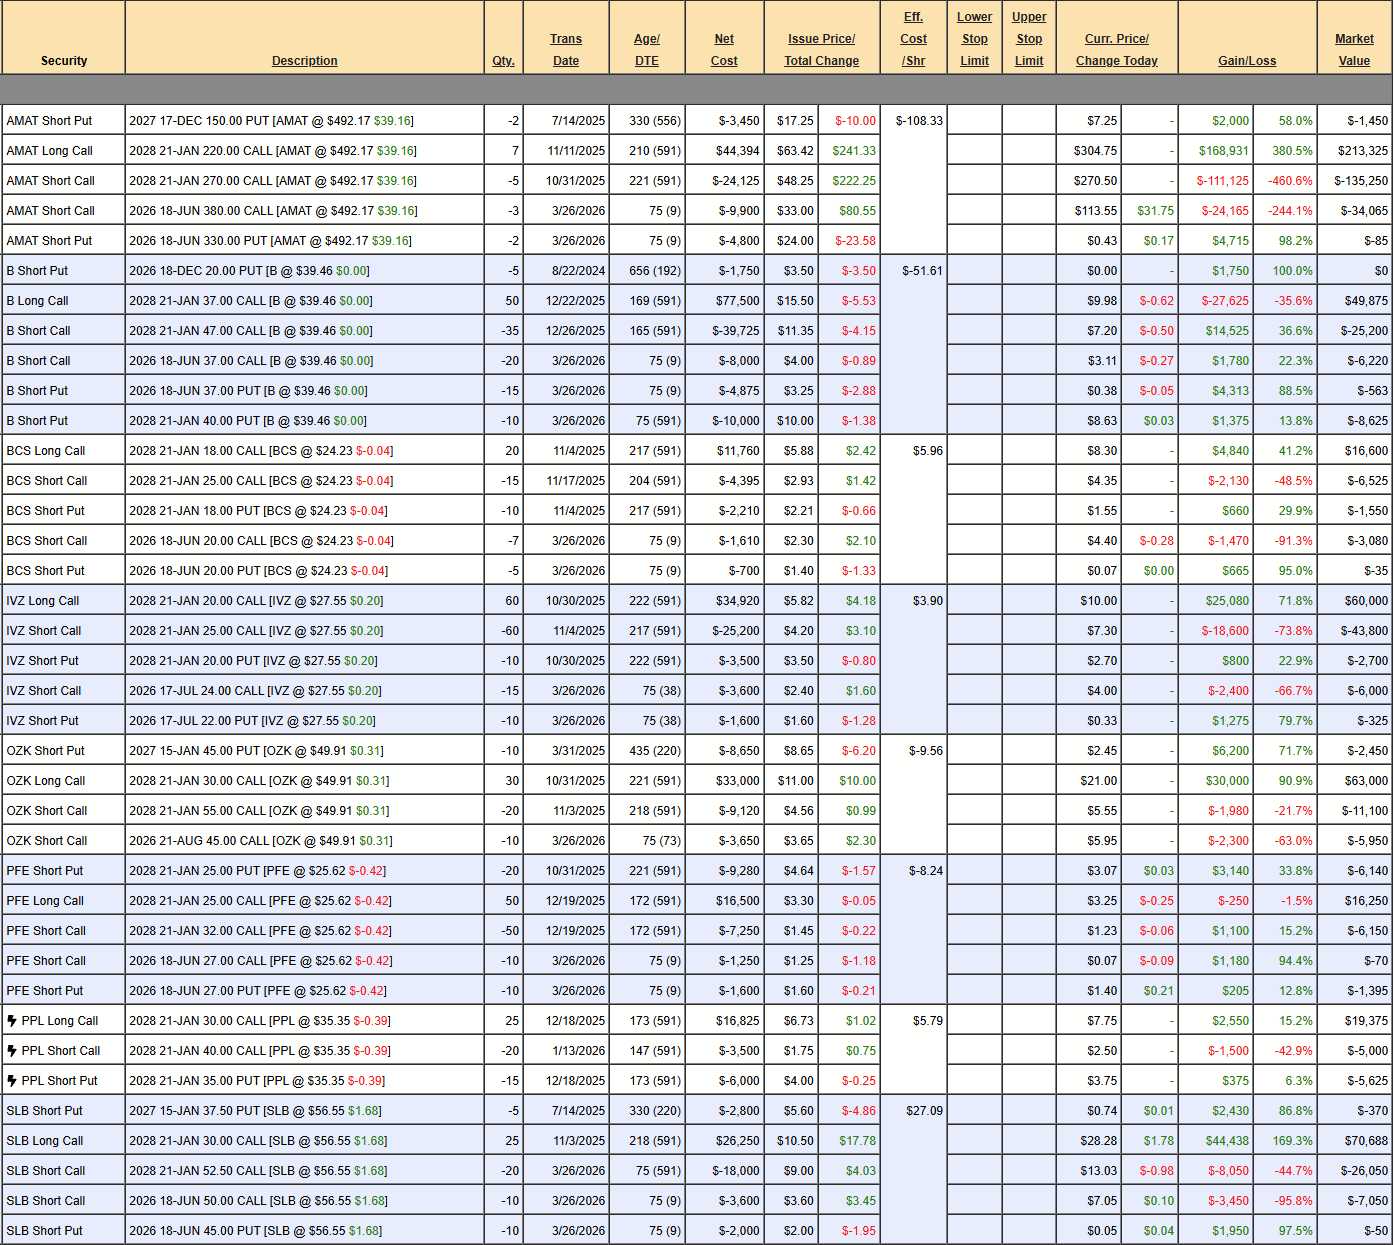
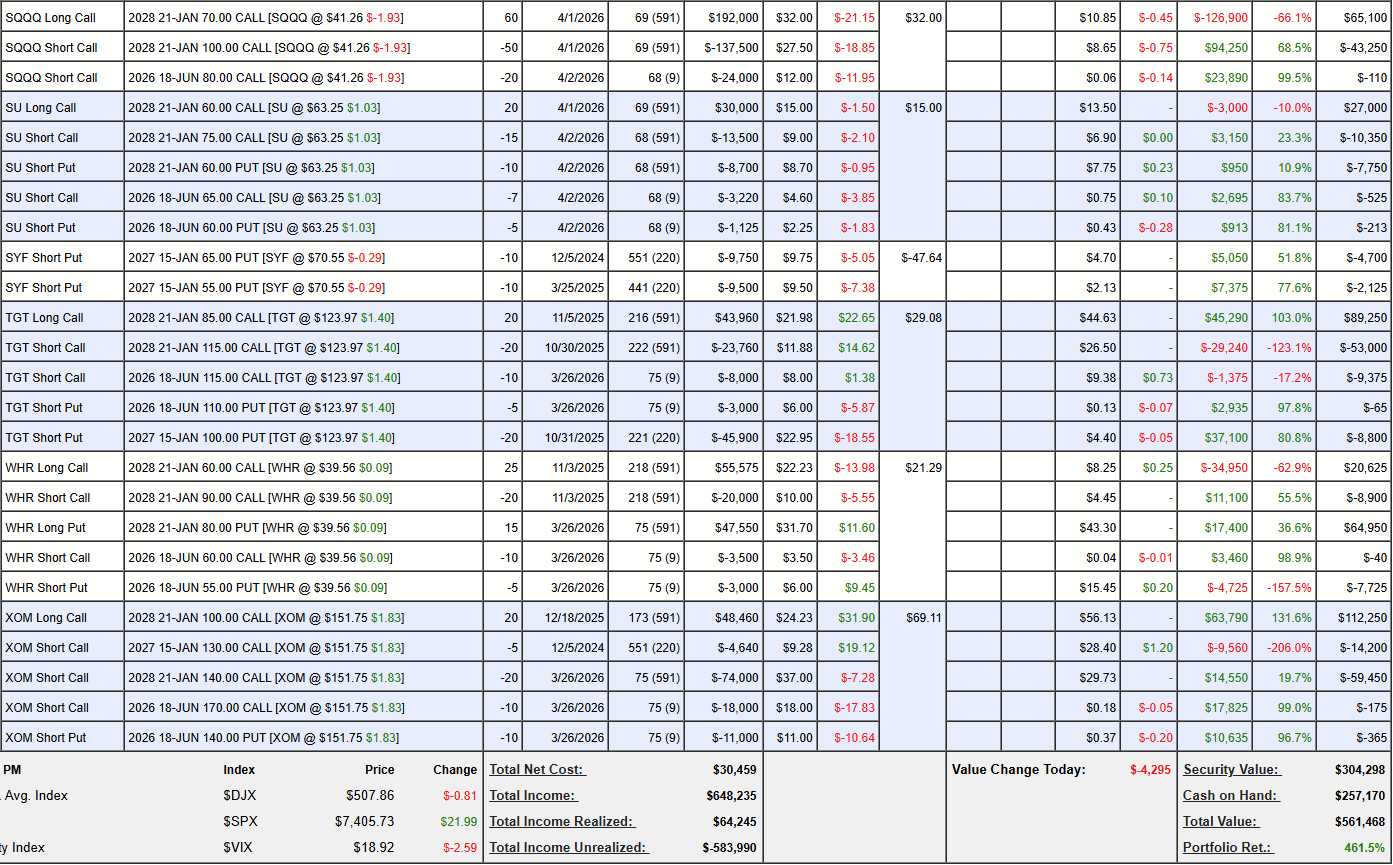
And today the Money Talk Portfolio is like a present we are unwrapping as the markets race to new highs (despite Friday’s dip) and our use of stock options for leverage have driven the portfolio’s value to $561,468, which is up $461,468 (461%) from our $100,000 restart (this is our 4th MTP) on August 24th, 2024 (less than 2 years) and, even more amazingly – up $185,026 (49%) in less than 3 months!
To be fair, the S&P 500 was at 6,556 on March 24th (we tape on Tuesday, show airs Wednesday) and now it’s 7,405 so we’re up 849 points, which is 12.9% so we had a nice tailwind but boy did our bots make the most of it, cashing out 4 positions and adding two new ones.
Despite the fact that we were “Cashy and Cautious” with the war raging – the trades we did leave in play almost doubled while we left ourselves $257,170 (double) in CASH!!! to maintain our flexibility – the best of both Worlds into the Q1 earnings reports. At the time, I said:
“We picked 4 new trade ideas back on December 16th (the show aired the next day) and they were Energy Transfer (ET), Micron (MU), PPL Corp (PPL) and, of course, Pfizer (PFE) and we spent net $28,310 on the new trades and already, just 3 months later, they are at net $101,077 – up $72,767 (257%) in just 3 months! As I noted, we had to pay cash to cancel some of the short puts and calls but I think you can see what I mean when I say FUN!!!“
We already had indications in March that our AGI Portfolio Picks were crushing it and here’s how the portfolio has played out in the the months since:
-
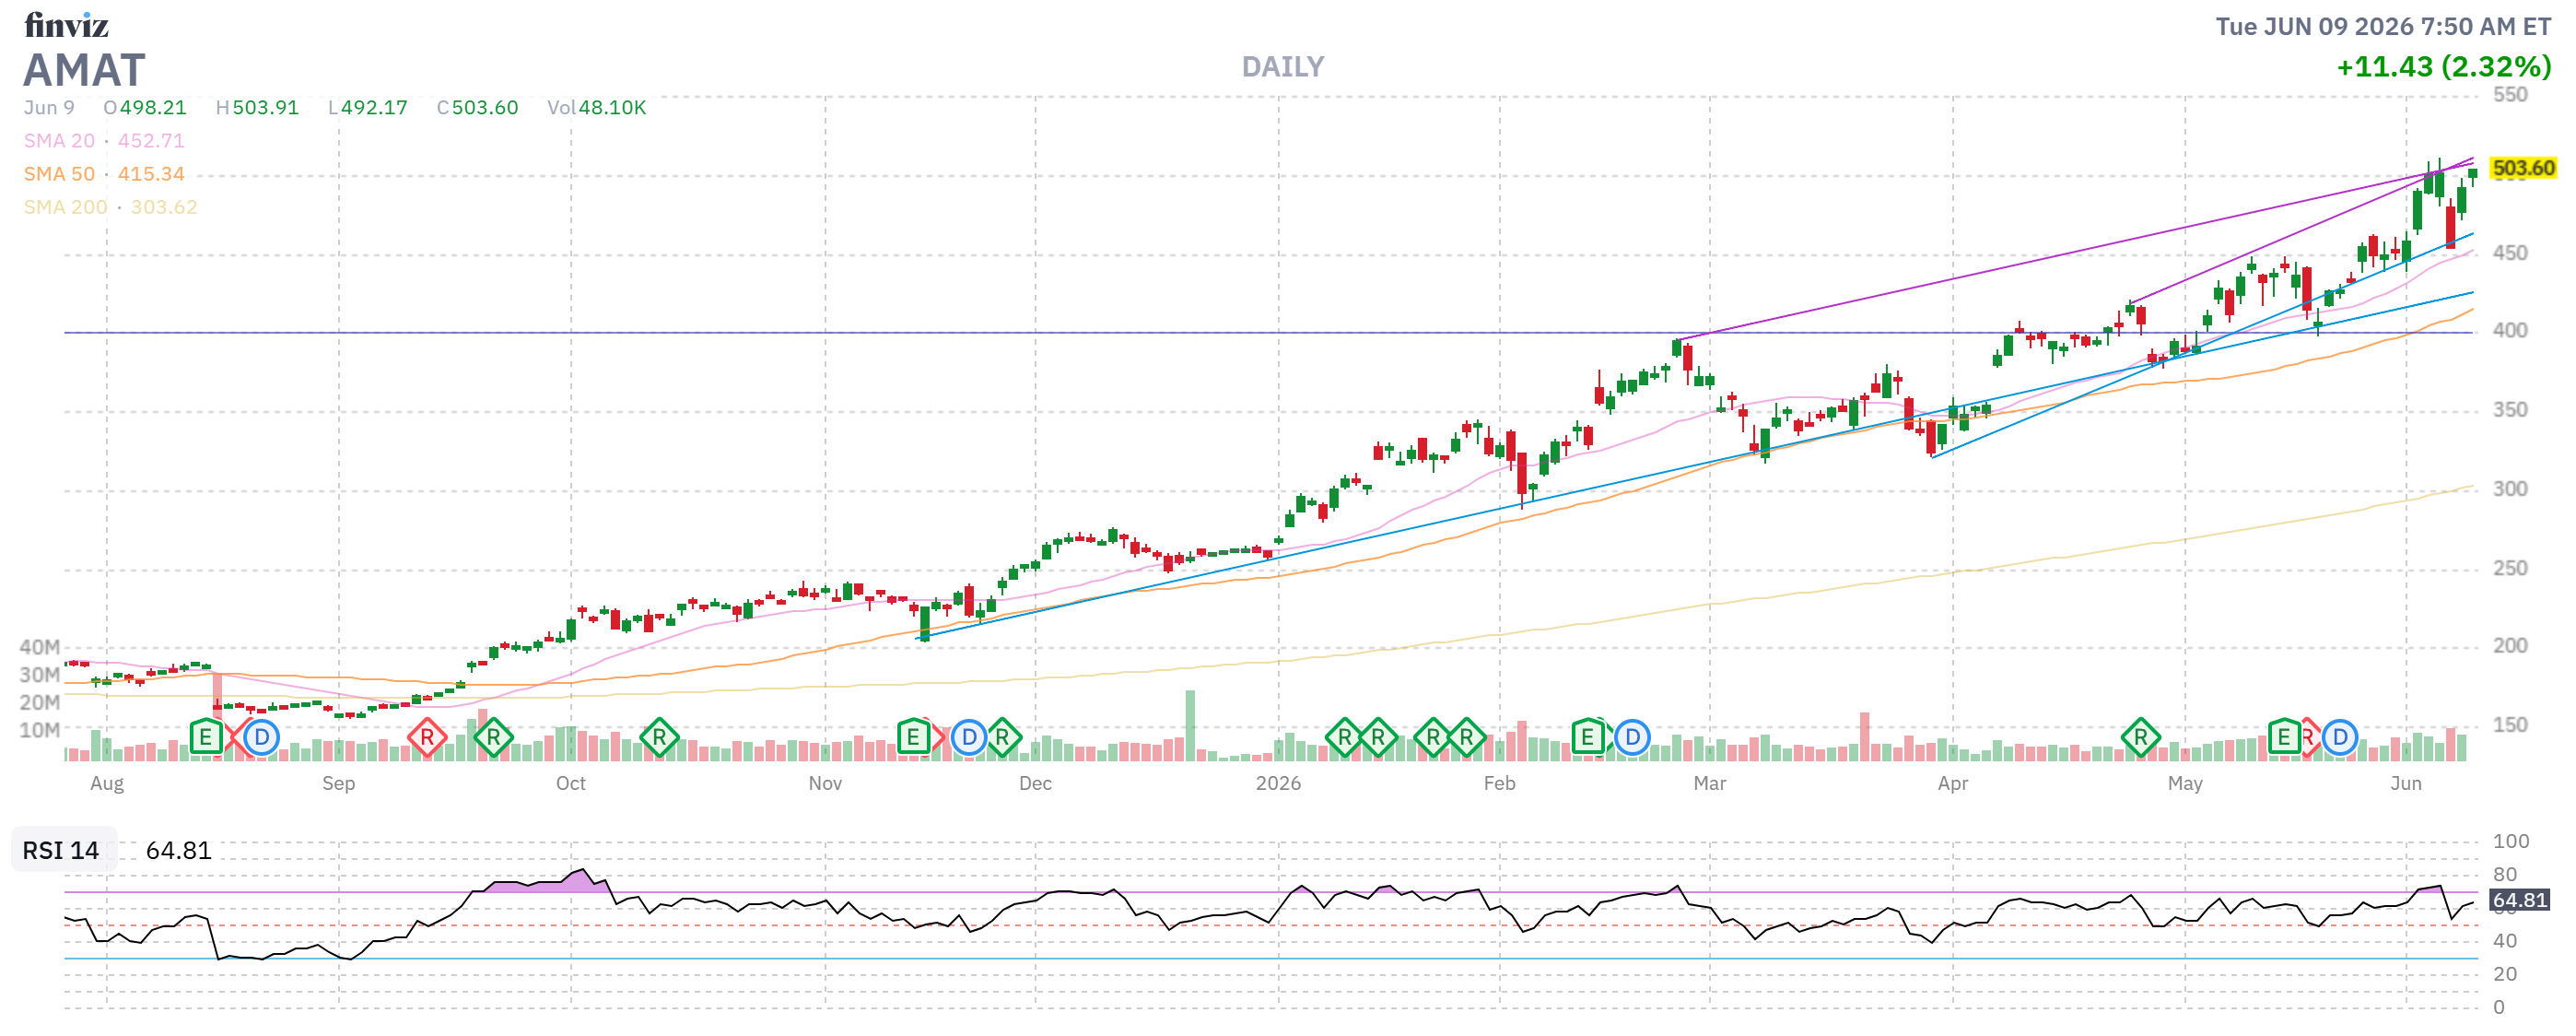
- AMAT – They have blasted higher, burning us on the short June $380 calls we sold but our long position is miles in the money at net $42,475 on what is technically a $35,000 spread so, rather than mess around with it – let’s cash it out!
-
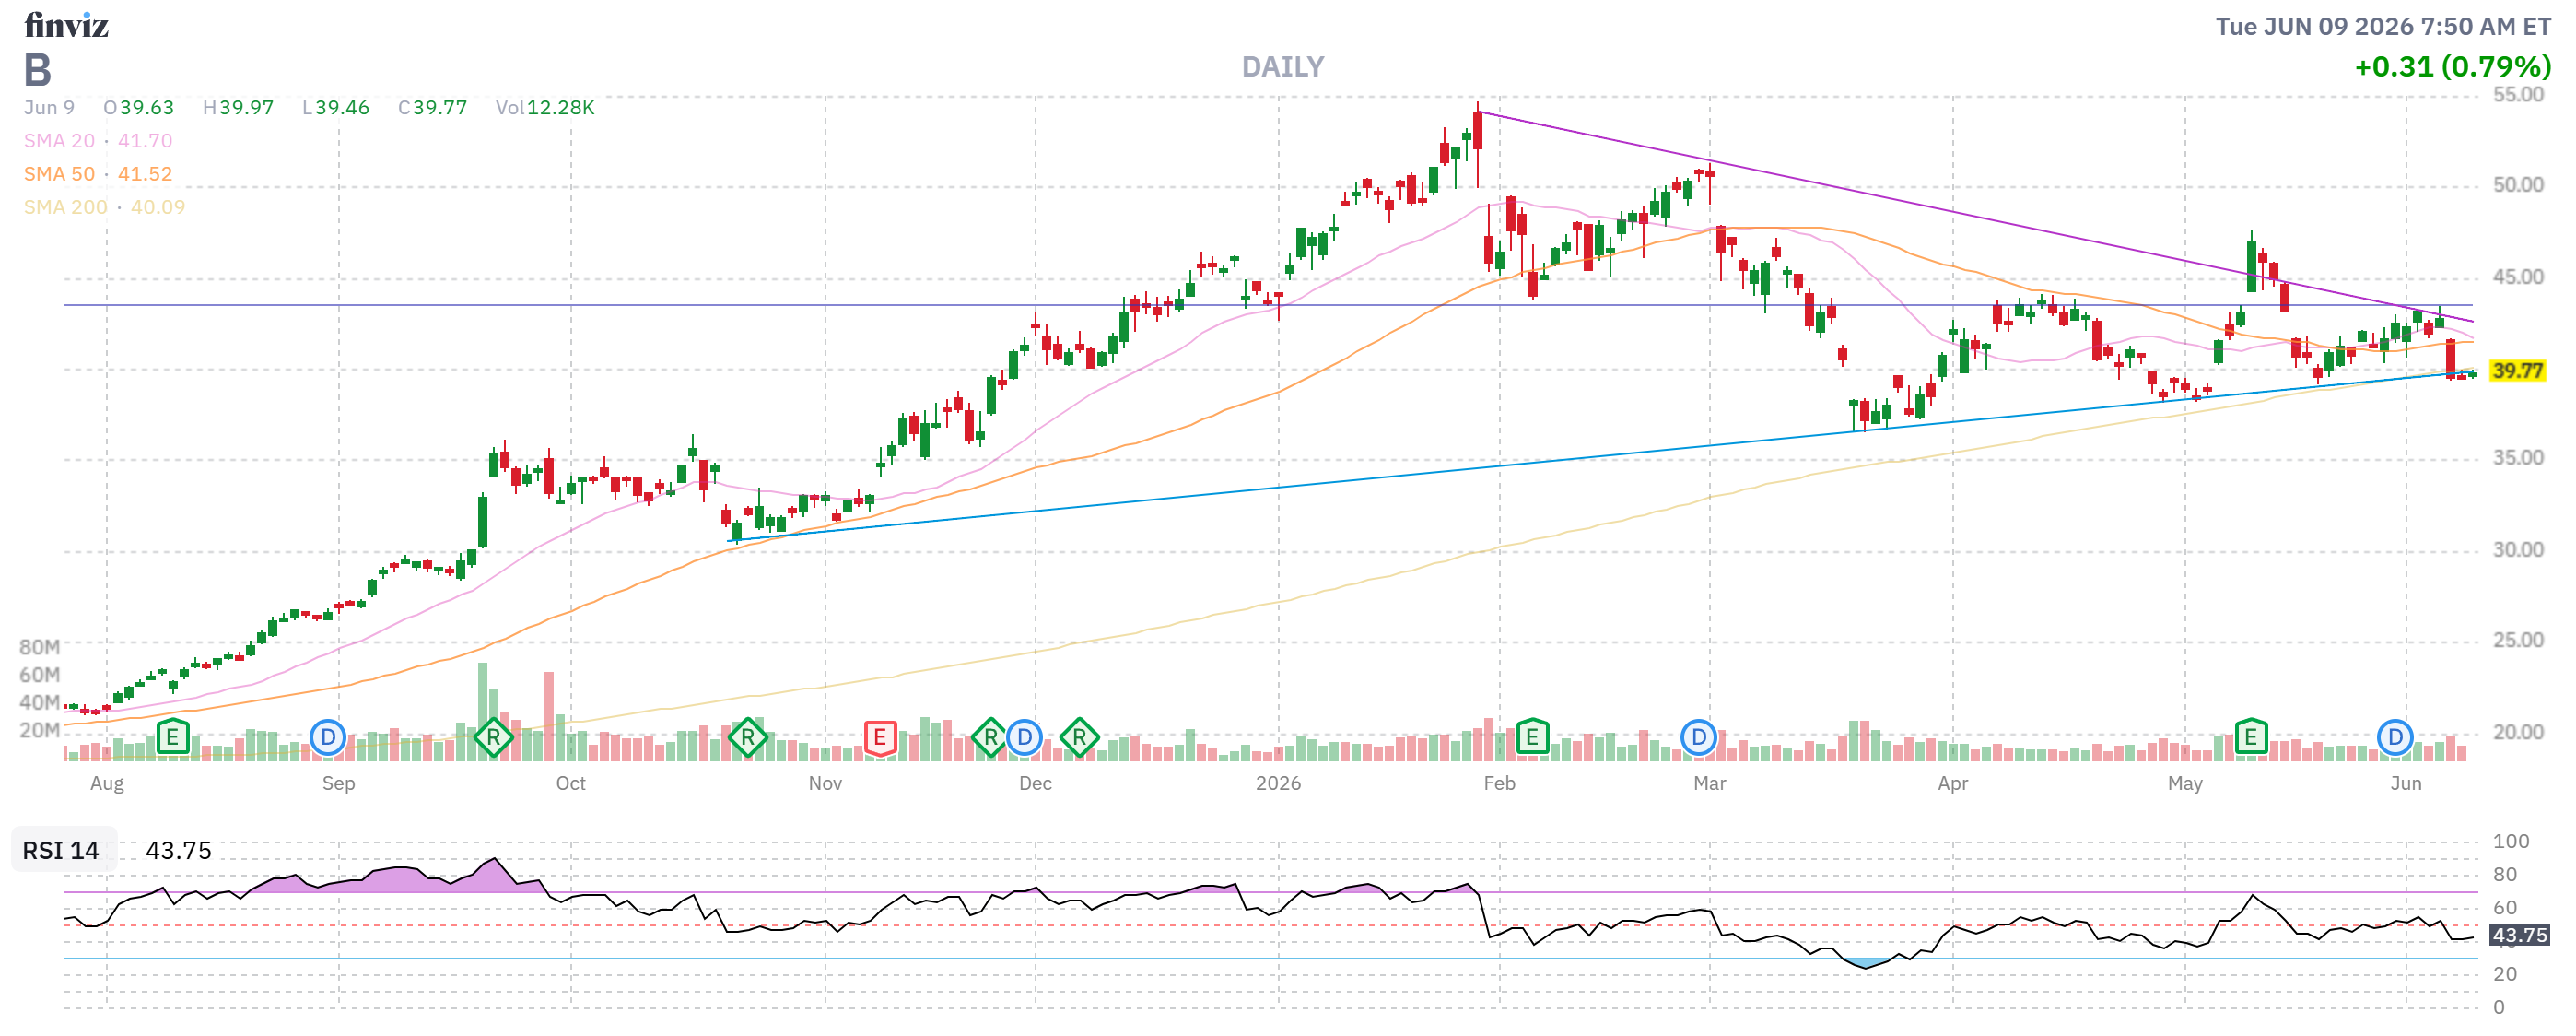
- B – This is a $50,000 spread but only if they can make it to $47 – that is not looking as certain as it was back in January. Still, we have until Jan, 2028 and the net of the spread is only $9,267 and we sold $12,875 (138%) worth of June puts and calls that are on target (we expected the sell-off) so this trade is more of an income-producer.
- Because we won’t be on the show again until September – let’s sell 15 Sept $42 calls for $3 ($4,500) and 10 Sept $38 puts for $3 ($3,000) to collect another $7,500 (80%) and we will buy back the short June $37 puts ($563) but we’ll leave the short June $37 calls ($6,220) with a stop at $8,000 – as they still have plenty of money to give us if B stays down at this level.
-
- BCS – We took a small loss on the short June calls and we’re closing them out ($3,080) and rolling them to 7 short Sept $24 calls at $2.10 ($1,470) and 5 short Sept $23 puts at $1.30 ($650). You don’t have to try to get your money back – it’s a process of constantly selling premium while the real gains come from the long spread going into the money.
- We paid net $2,845 for the $14,000 spread so there was $11,155 (392%) of upside potential and now we’re in the money at net $5,410 – up $2,565 (90%) in 6 months with $8,590 (158%) left to gain – so still good for a new trade!
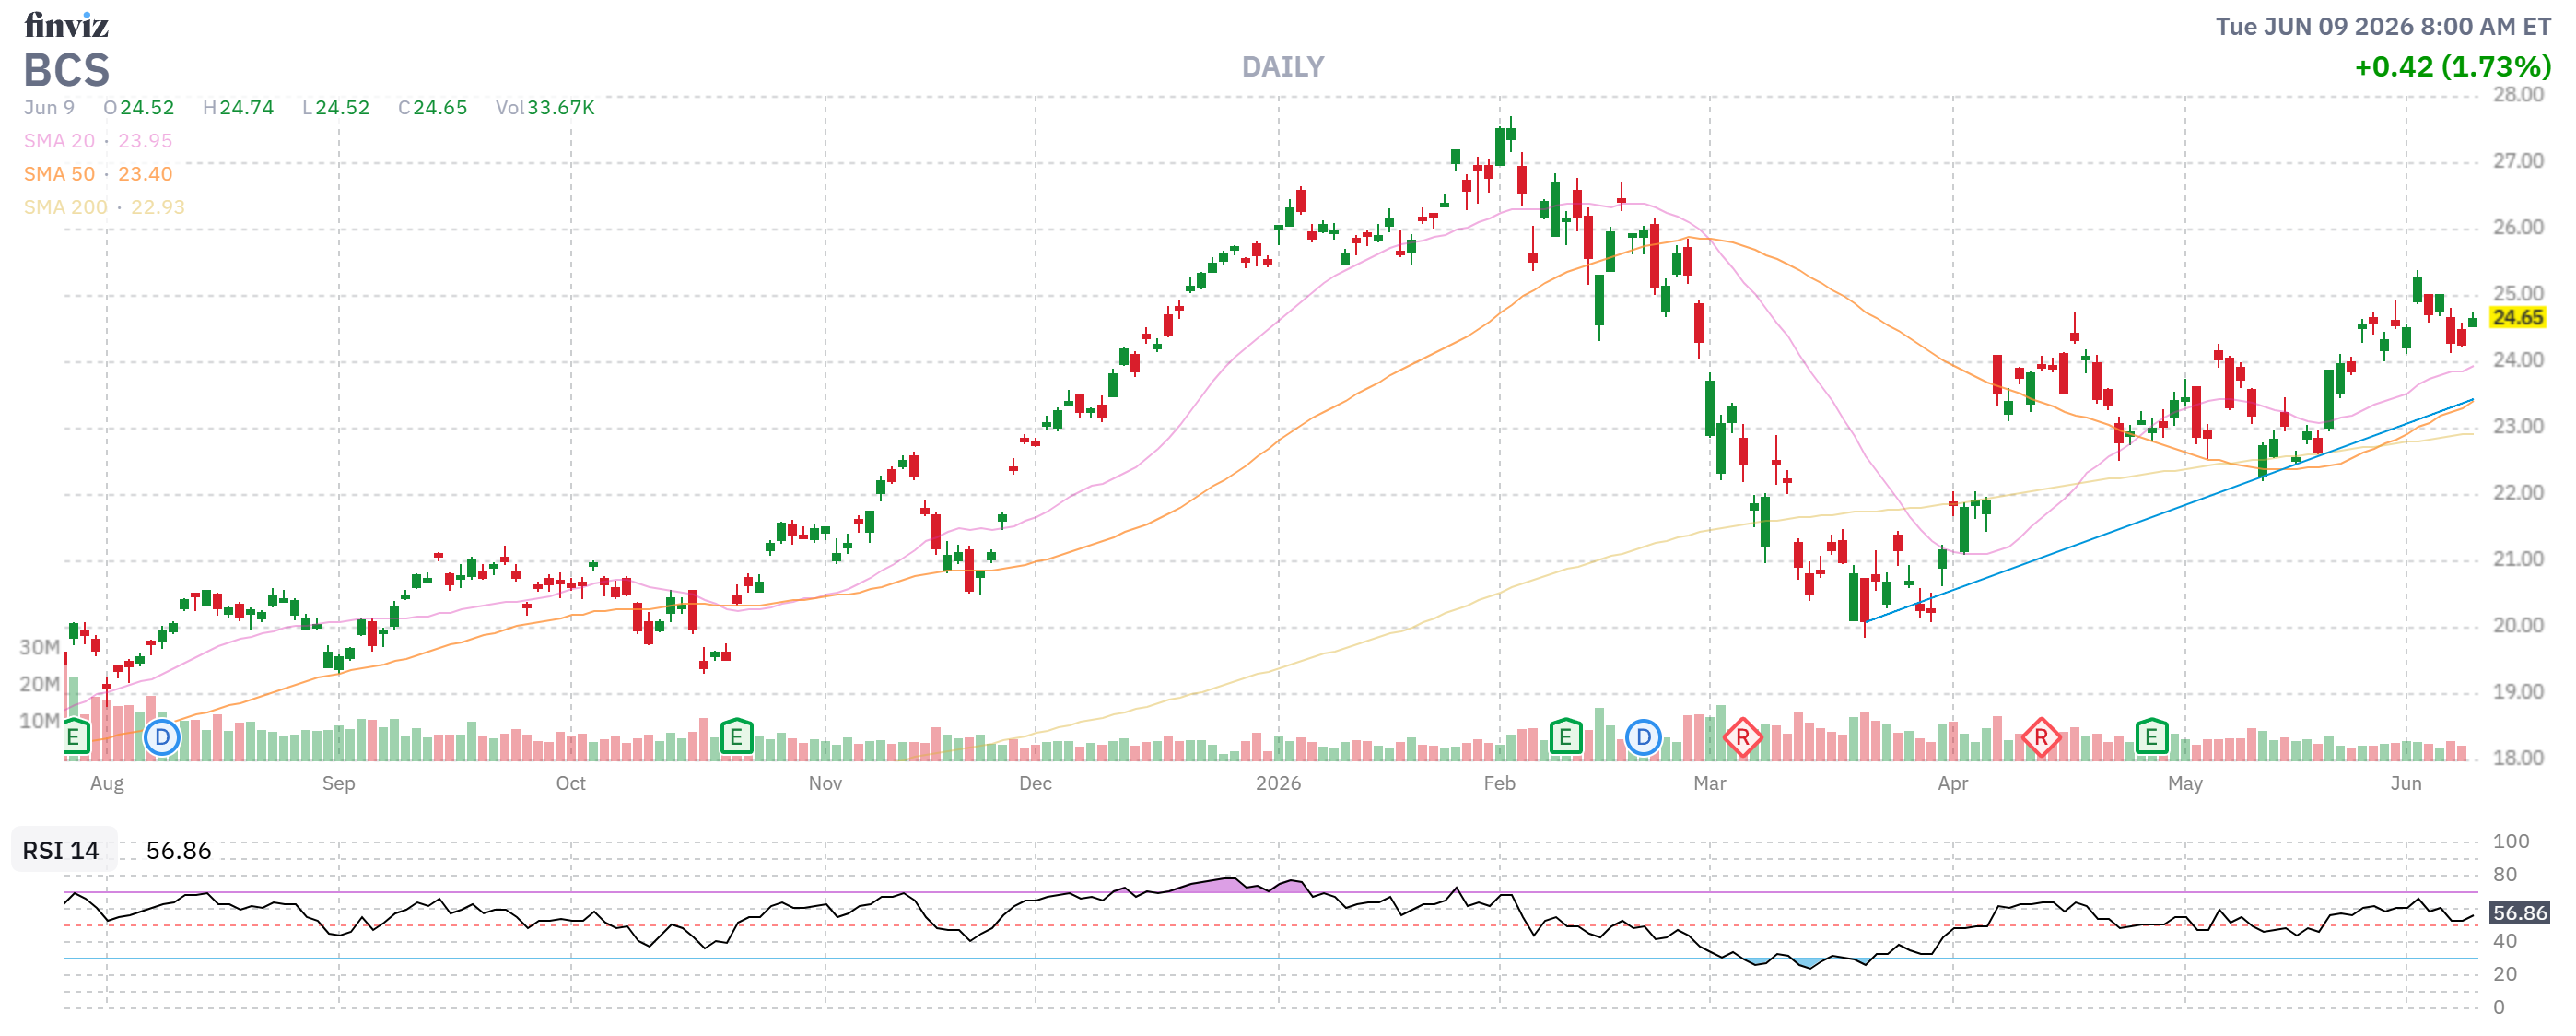
We are not doing anything different than a regular stock investor: We are betting Barclays will be over $25 in January of 2028 – we are simply using options to both leverage and hedge our bets, giving us exceptional cash returns while taking on an obligation (margin) to buy up to 1,500 shares of BCS at net about $18 ($27,000) if it heads lower.
This is what we call – BEING the House!
-
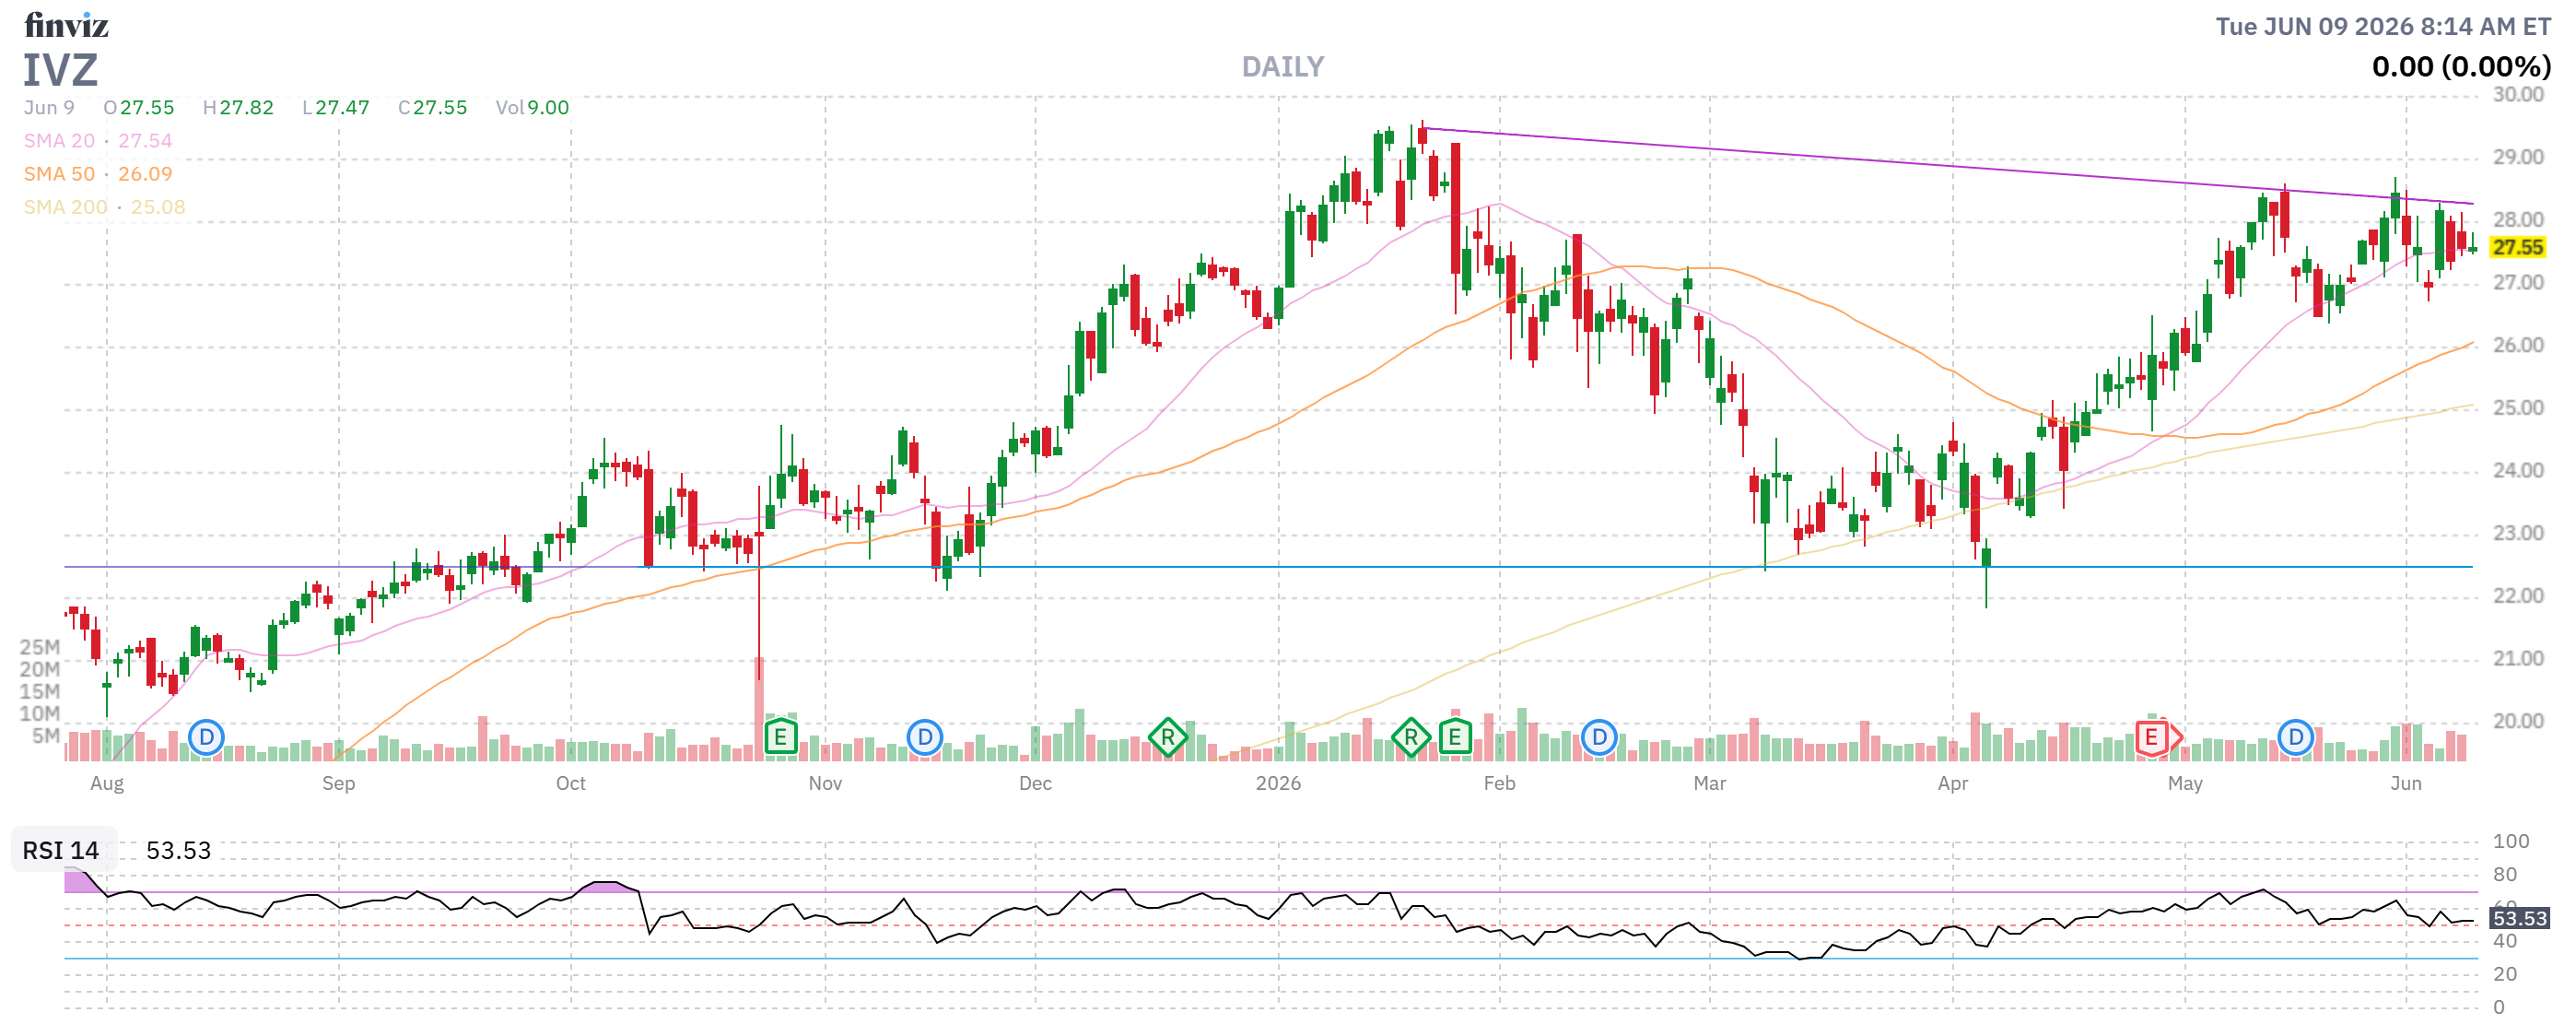
- IVZ – We’re at net $7,175 on what is technically a $45,000 so there is $37,825 (527%) upside potential but we are off-target for July so we’ll buy back the short July $24 calls ($6,000) and we’ll sell 15 Sept $26 calls for $3.50 ($4,900).
-
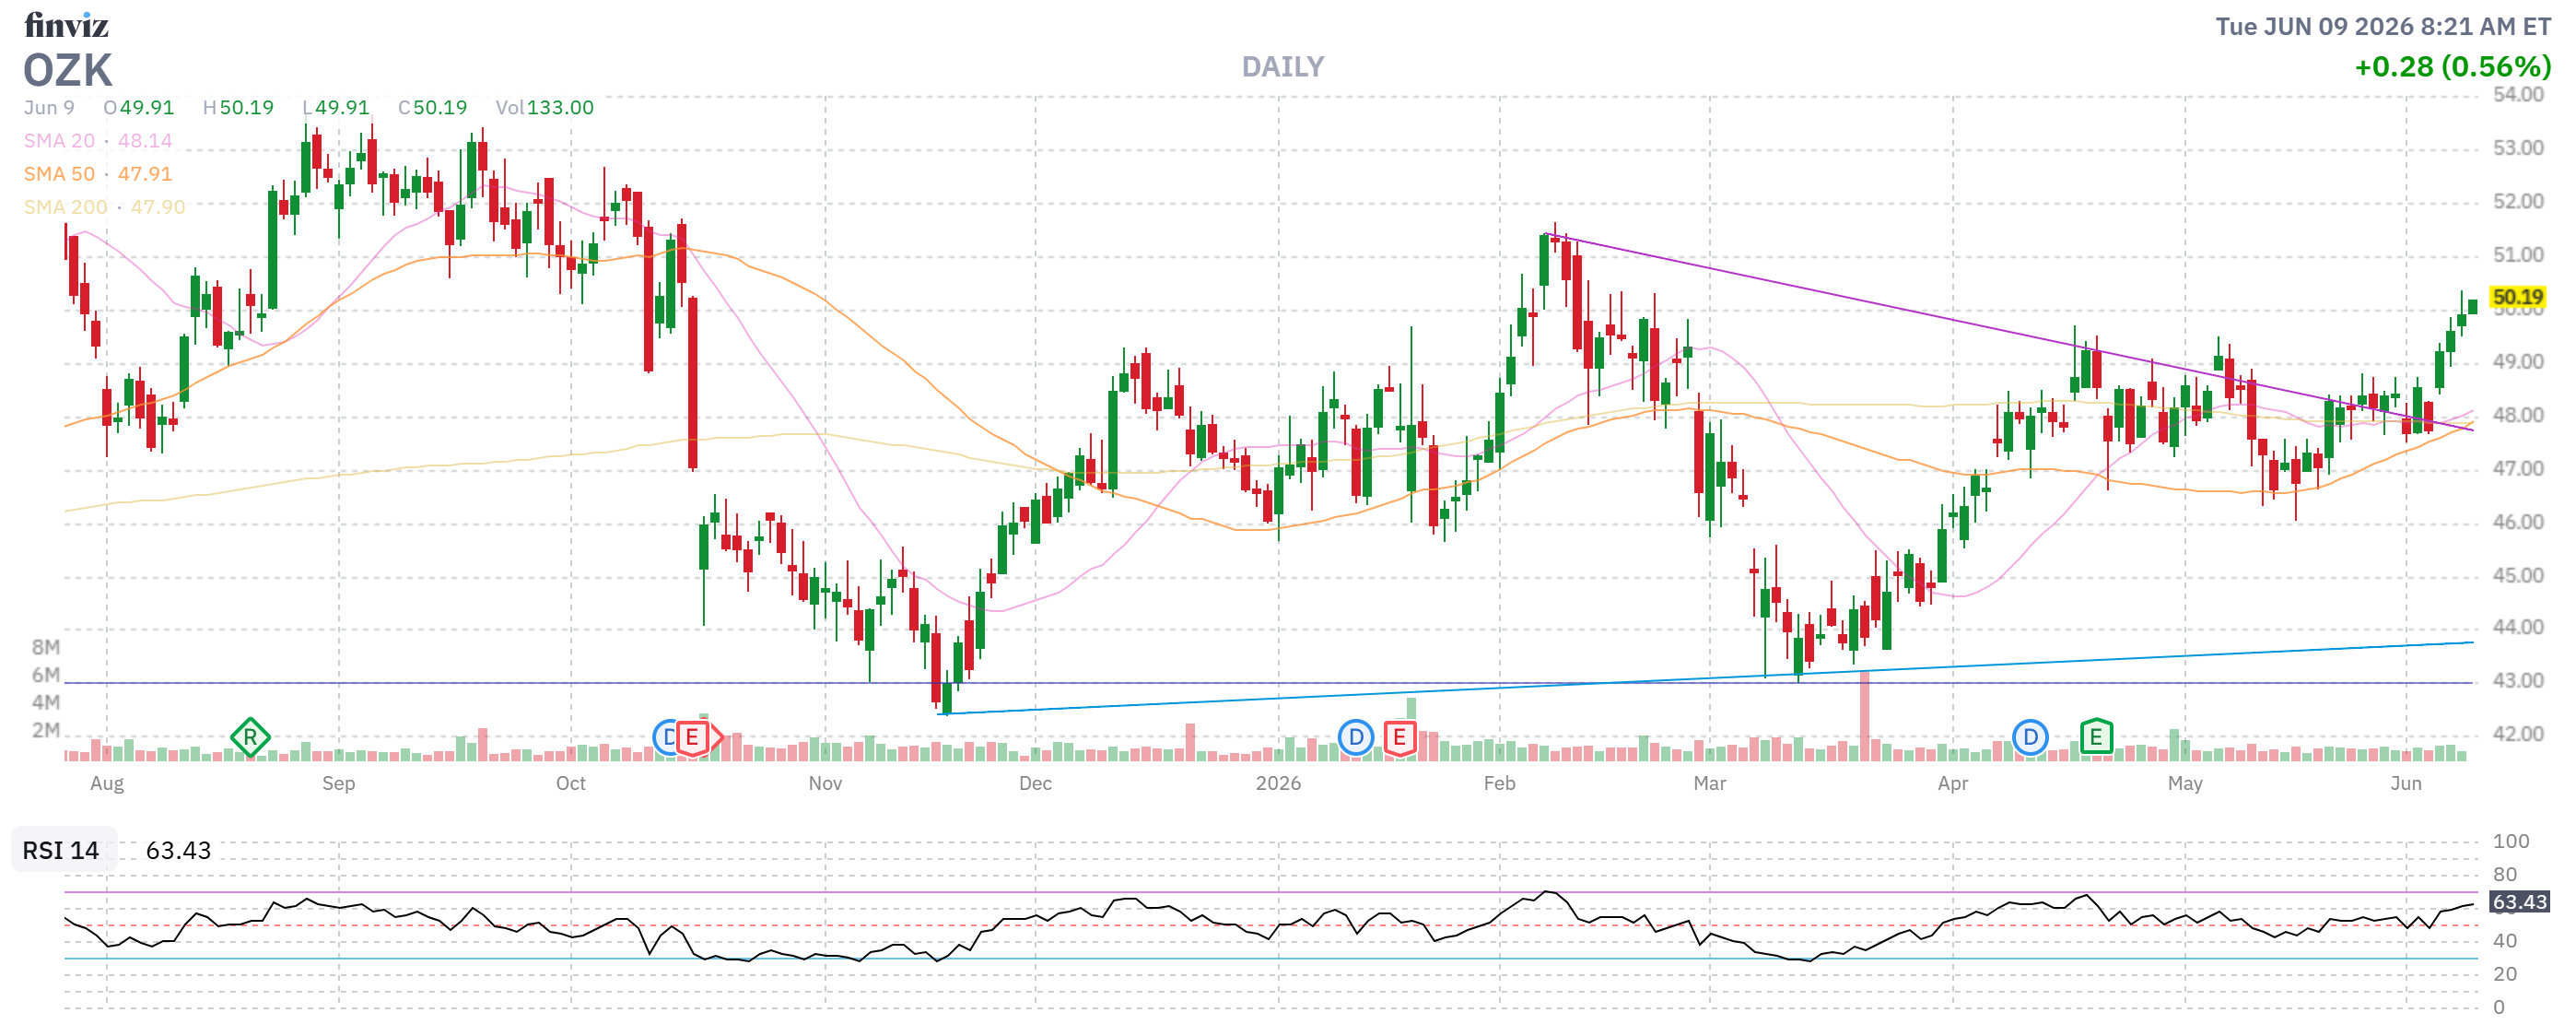
- OZK – Here we’re at net $43,500 on the $75,000 spread and looking good for our goal with another $31,500 (72%) of potential gains remaining. Aren’t options fun?!? We’re a bit over our target so let’s roll the 10 short Aug $45 calls ($5,950) to 10 short Nov $50 calls at $4 ($4,000) and 10 short Nov $47.50 puts at $3 ($3,000).
- Keep in mind, we have 5 more quarters to sell $7,000 in premium – that’s another potential $35,000 (80%) while we wait for our 72%.
-
- PFE – Our Trade of the Year! Our Trade of the Year is not the BIGGEST trade – it’s the trade idea we feel has the highest probability of returning 300% and, in 15 years – we have not missed a single one! We netted into PFE for a $2,880 CREDIT and the current net is $2,495 so we’re already up $5,375 (186%) with 18 months to go! See how easy that is?
- It’s a $35,000 spread, however – so we still have $29,625 (551%) of upside potential – you can see how we make these ridiculous returns, right? So good for a new trade – of course, and we are going to roll the short June puts and calls ($1,465) to 10 short Sept $25 calls at $1.55 ($1,550) and 10 short Sept $25 puts at $1 ($1,000).
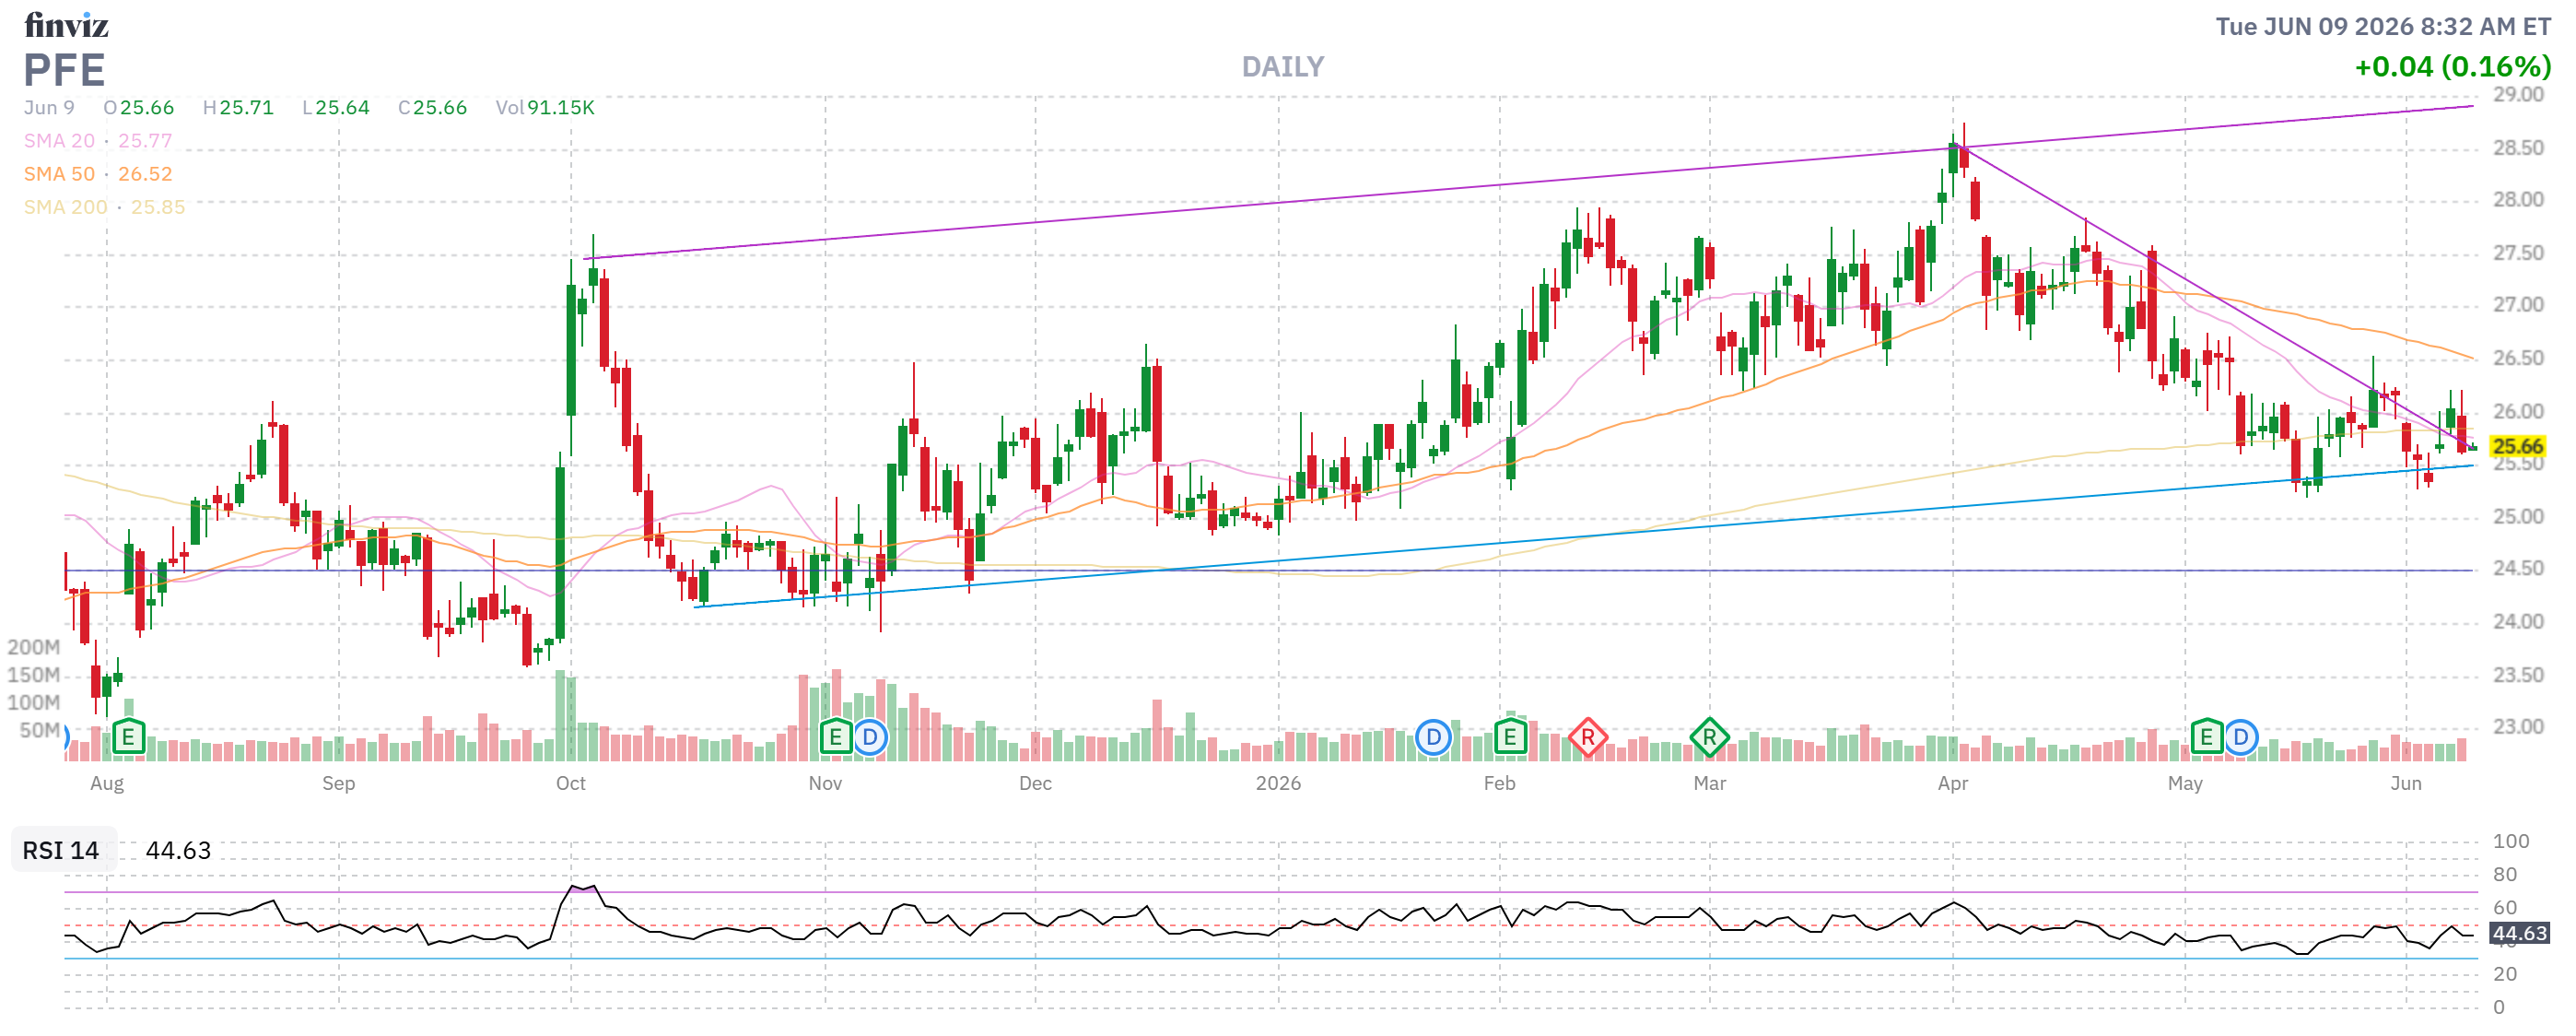
It may not seem like much be we collected $2,850 on March 26th and we’re paying back $1,465 for a $1,385 profit – which is 25.7% of the spread’s value – in 3 months! How would your portfolio be doing if you learned how to add 25% per quarter to the value of your spreads?
Be the House – NOT the Gambler!
-
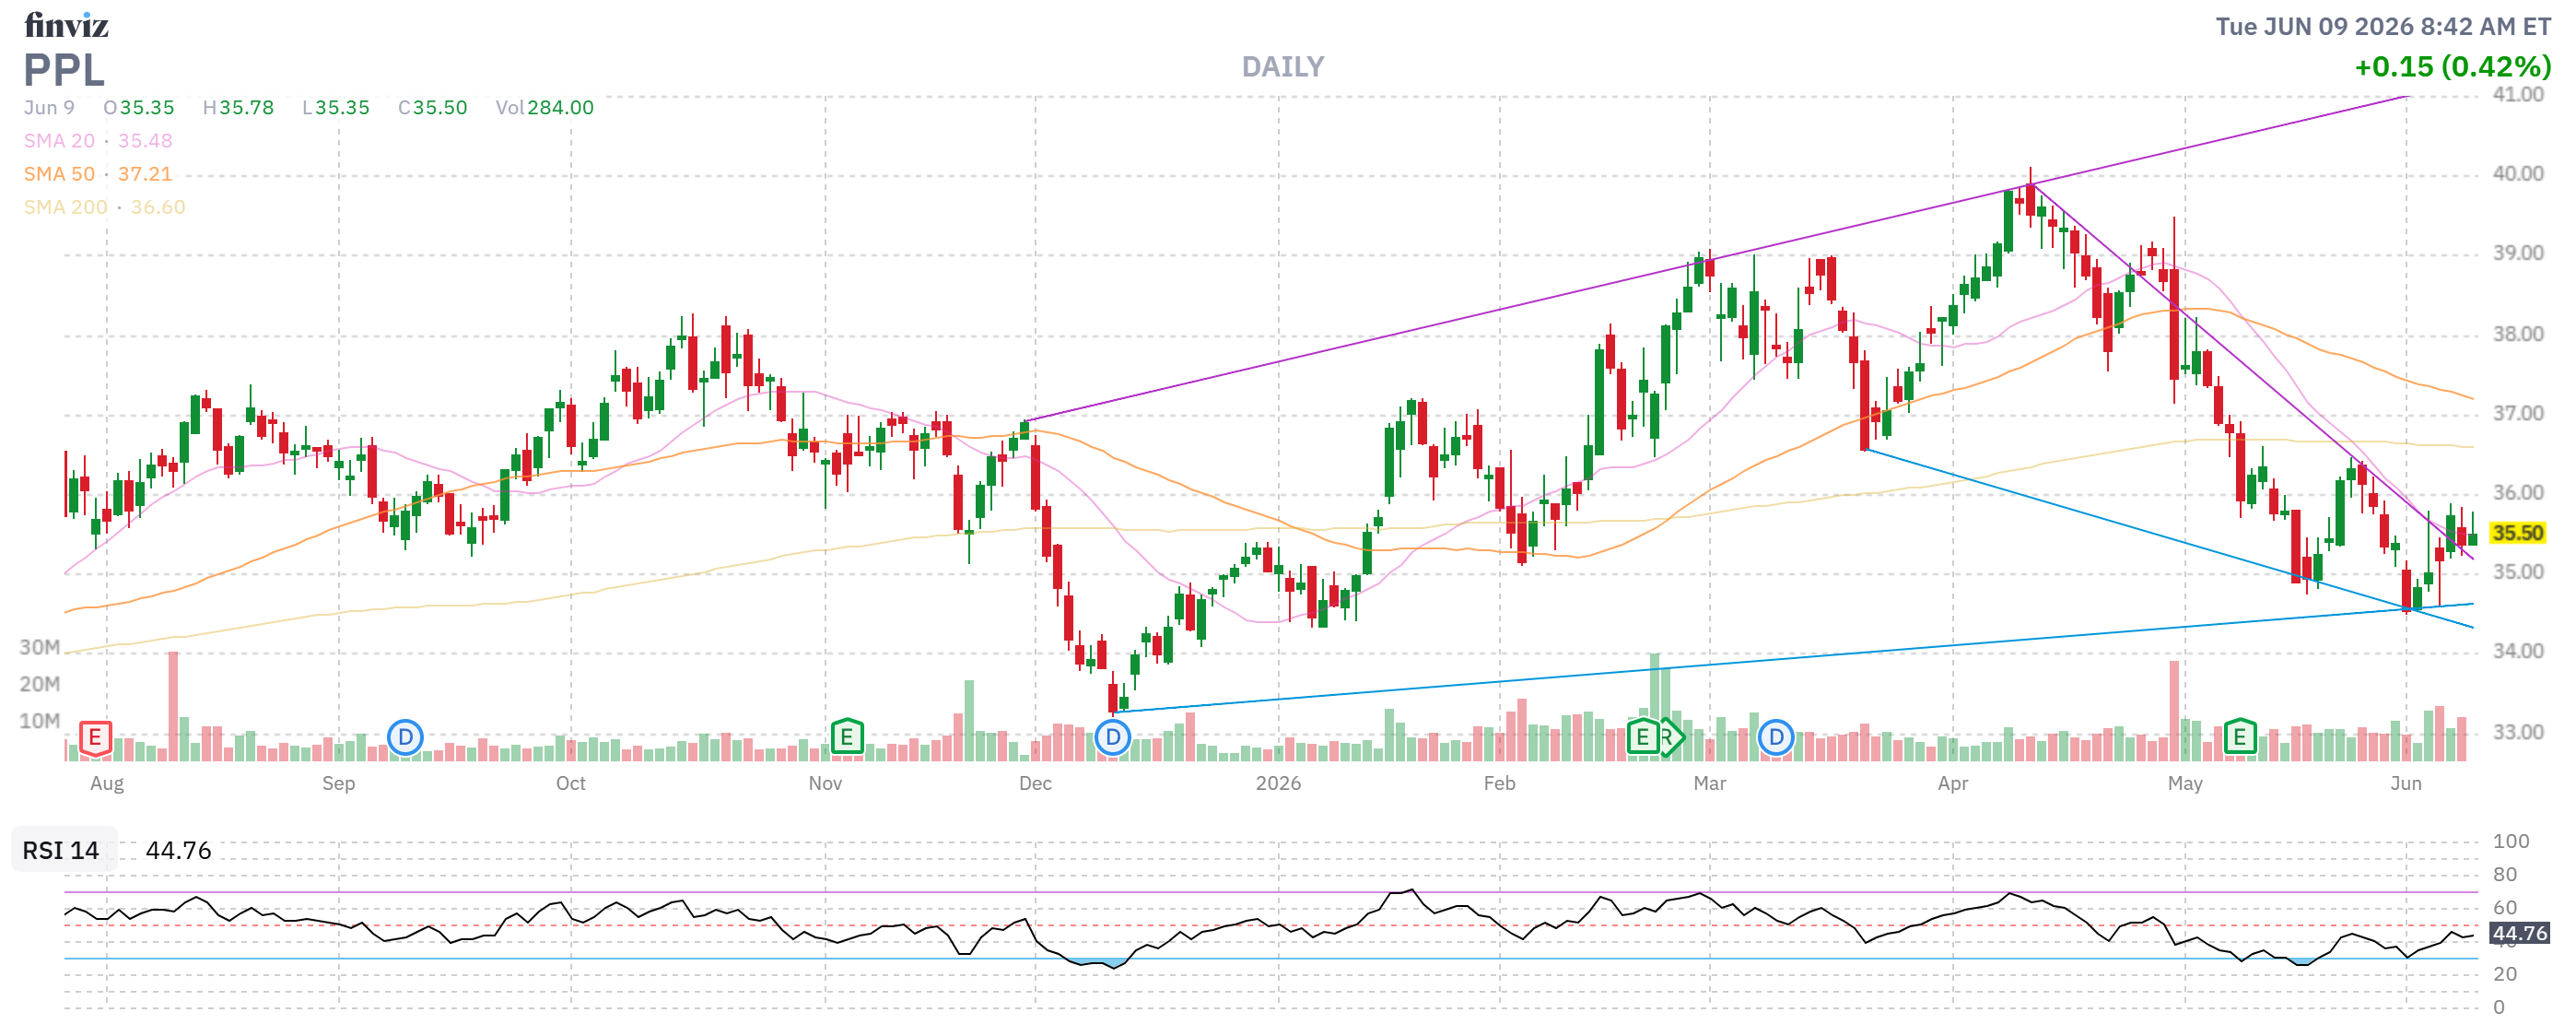
- PPL – Back near where we came in but time decay works in our favor so we’re up $1,425 at net $8,750 on the $25,000 spread that’s half in the money with $16,250 (185%) upside potential and that’s good for a new trade!
- Let’s sell 5 Oct $35 puts for $2 ($1,000) and 5 Oct $37 calls for $1.20 ($600) to pay for our Halloween candy.
-
- SLB – Over our target already at net $37,168 on the $56,250 spread so there’s $19,082 (51%) upside potential if they can just hold $52.50 and we will roll the short June puts and calls ($7,100) to 10 short Sept $55 calls at $5.50 ($5,500) and 10 short Sept $52.50 puts at $2.55 ($2,550).
-
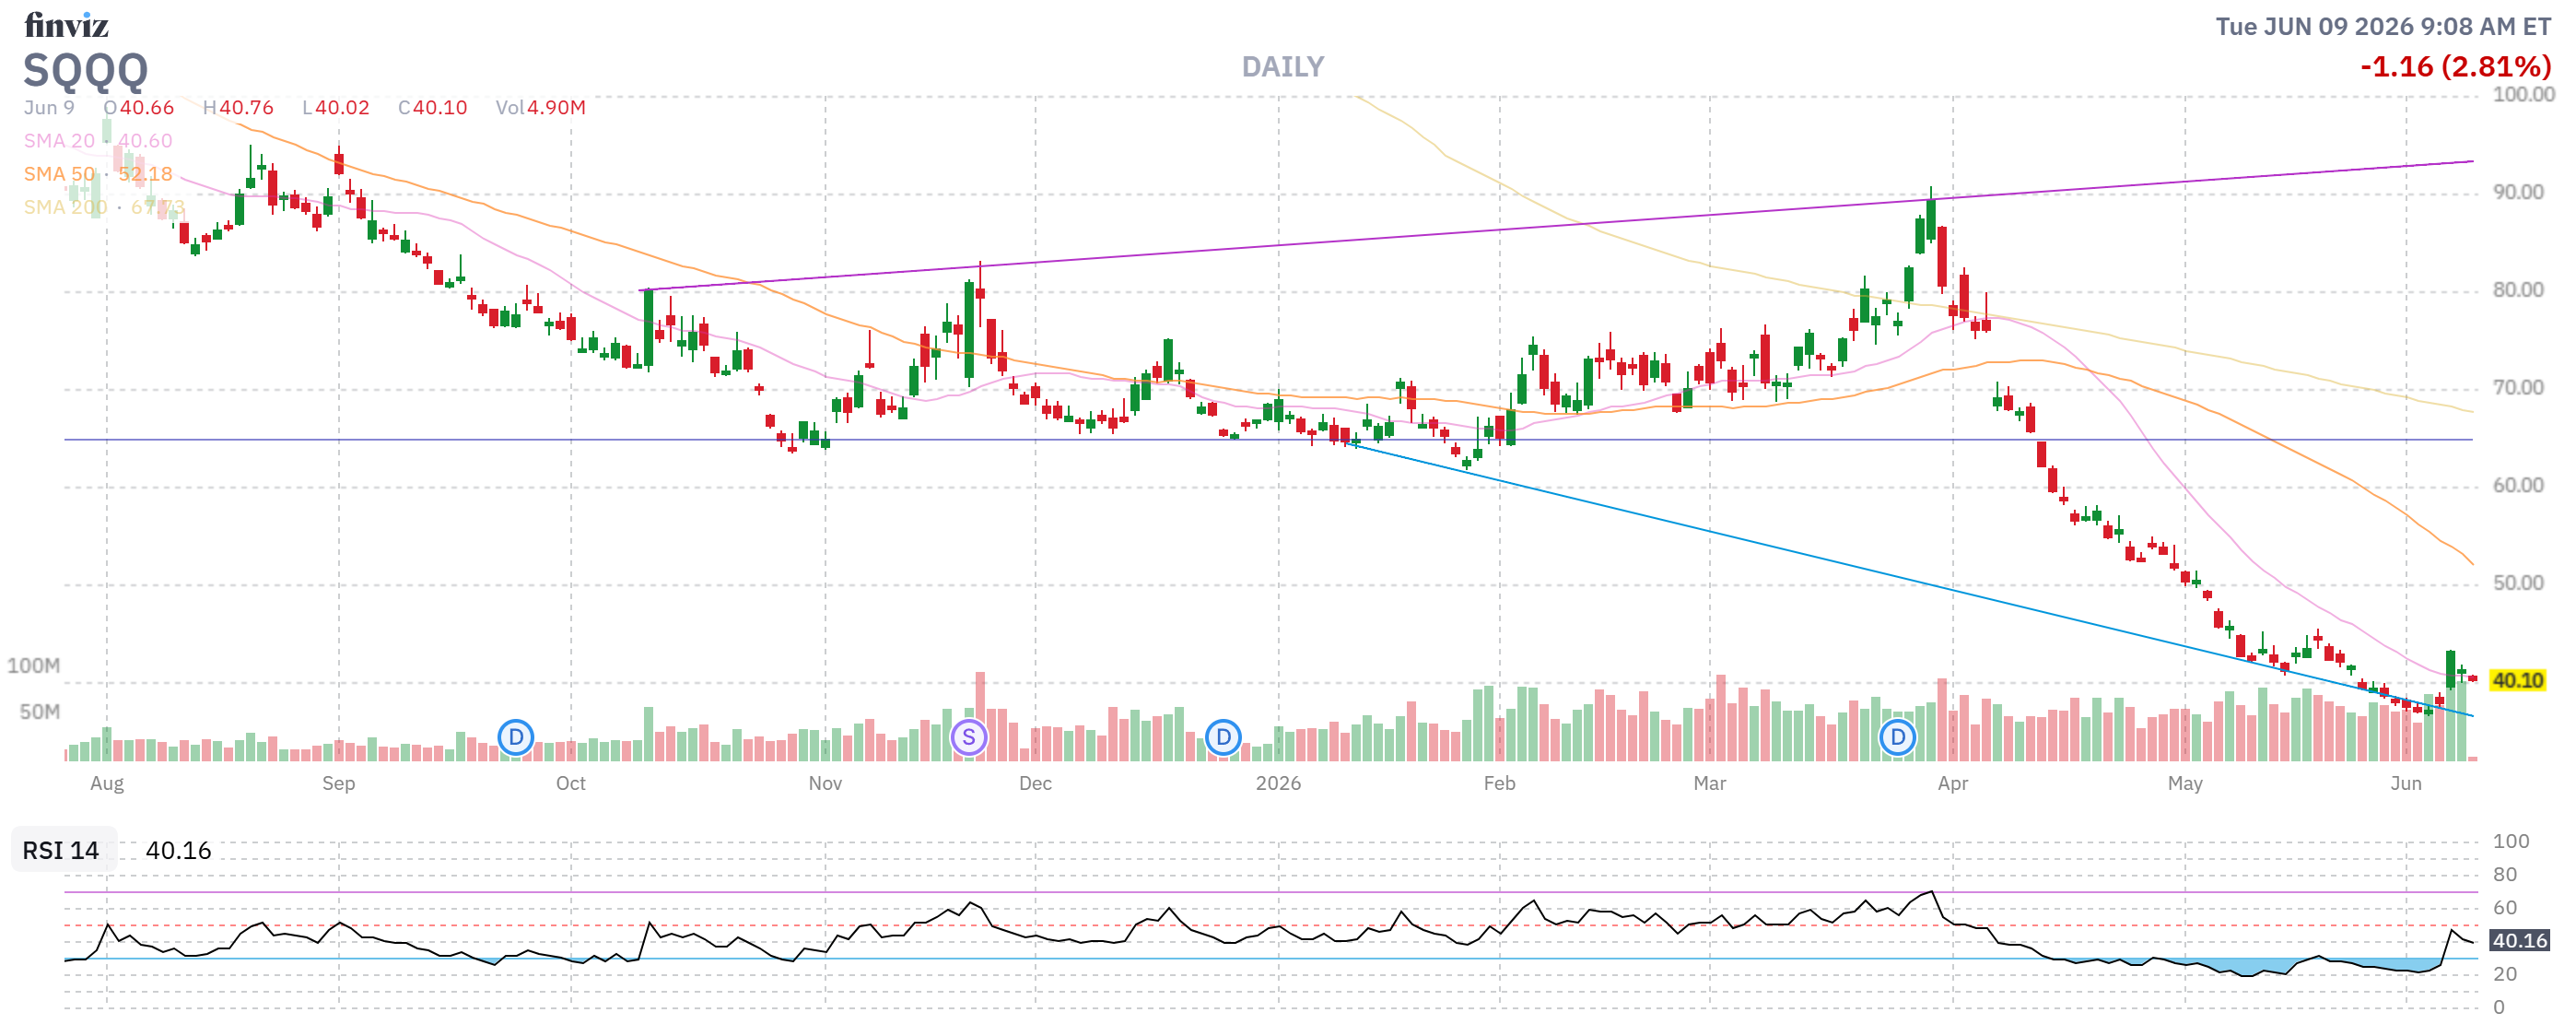
- SQQQ – We added this hedge in March – just in case the market crashed. It didn’t and we’re down $8.760 but that’s just the cost of insurance and there’s no way we would have been able to play aggressively enough to gain $185,000 without that insurance policy in place!
- Unfortunately, we are no longer in good position as SQQQ is a 3x inverse ETF to the Nasdaq so, if the Nasdaq drops 20%, SQQQ goes up 60% from $41.26 to $66 so the $70 calls aren’t doing us any good. To make life simpler, let’s call this a CASH OUT! and consider this a new spread:
-
- Buy 60 SQQQ 2028 $30 calls at $18 ($108,000)
- Sell 50 SQQQ 2028 $60 calls at $12 ($60,000)
- Sell 20 SQQQ Sept $45 calls at $5.50 ($11,000)
-
- That’s net $37,000 on the $180,000 spread that’s $11 ($66,000) in the money so the only way we DON’T make money on the spread is if SQQQQ falls 25%, which means the Nasdaq would be up 8% and all those upside potential begin to be realized – see how that balances?
- This spread provides us with $143,000 of downside protection against a 20% drop in the Nasdaq (the index we feel is most likely to drop 20%).
-
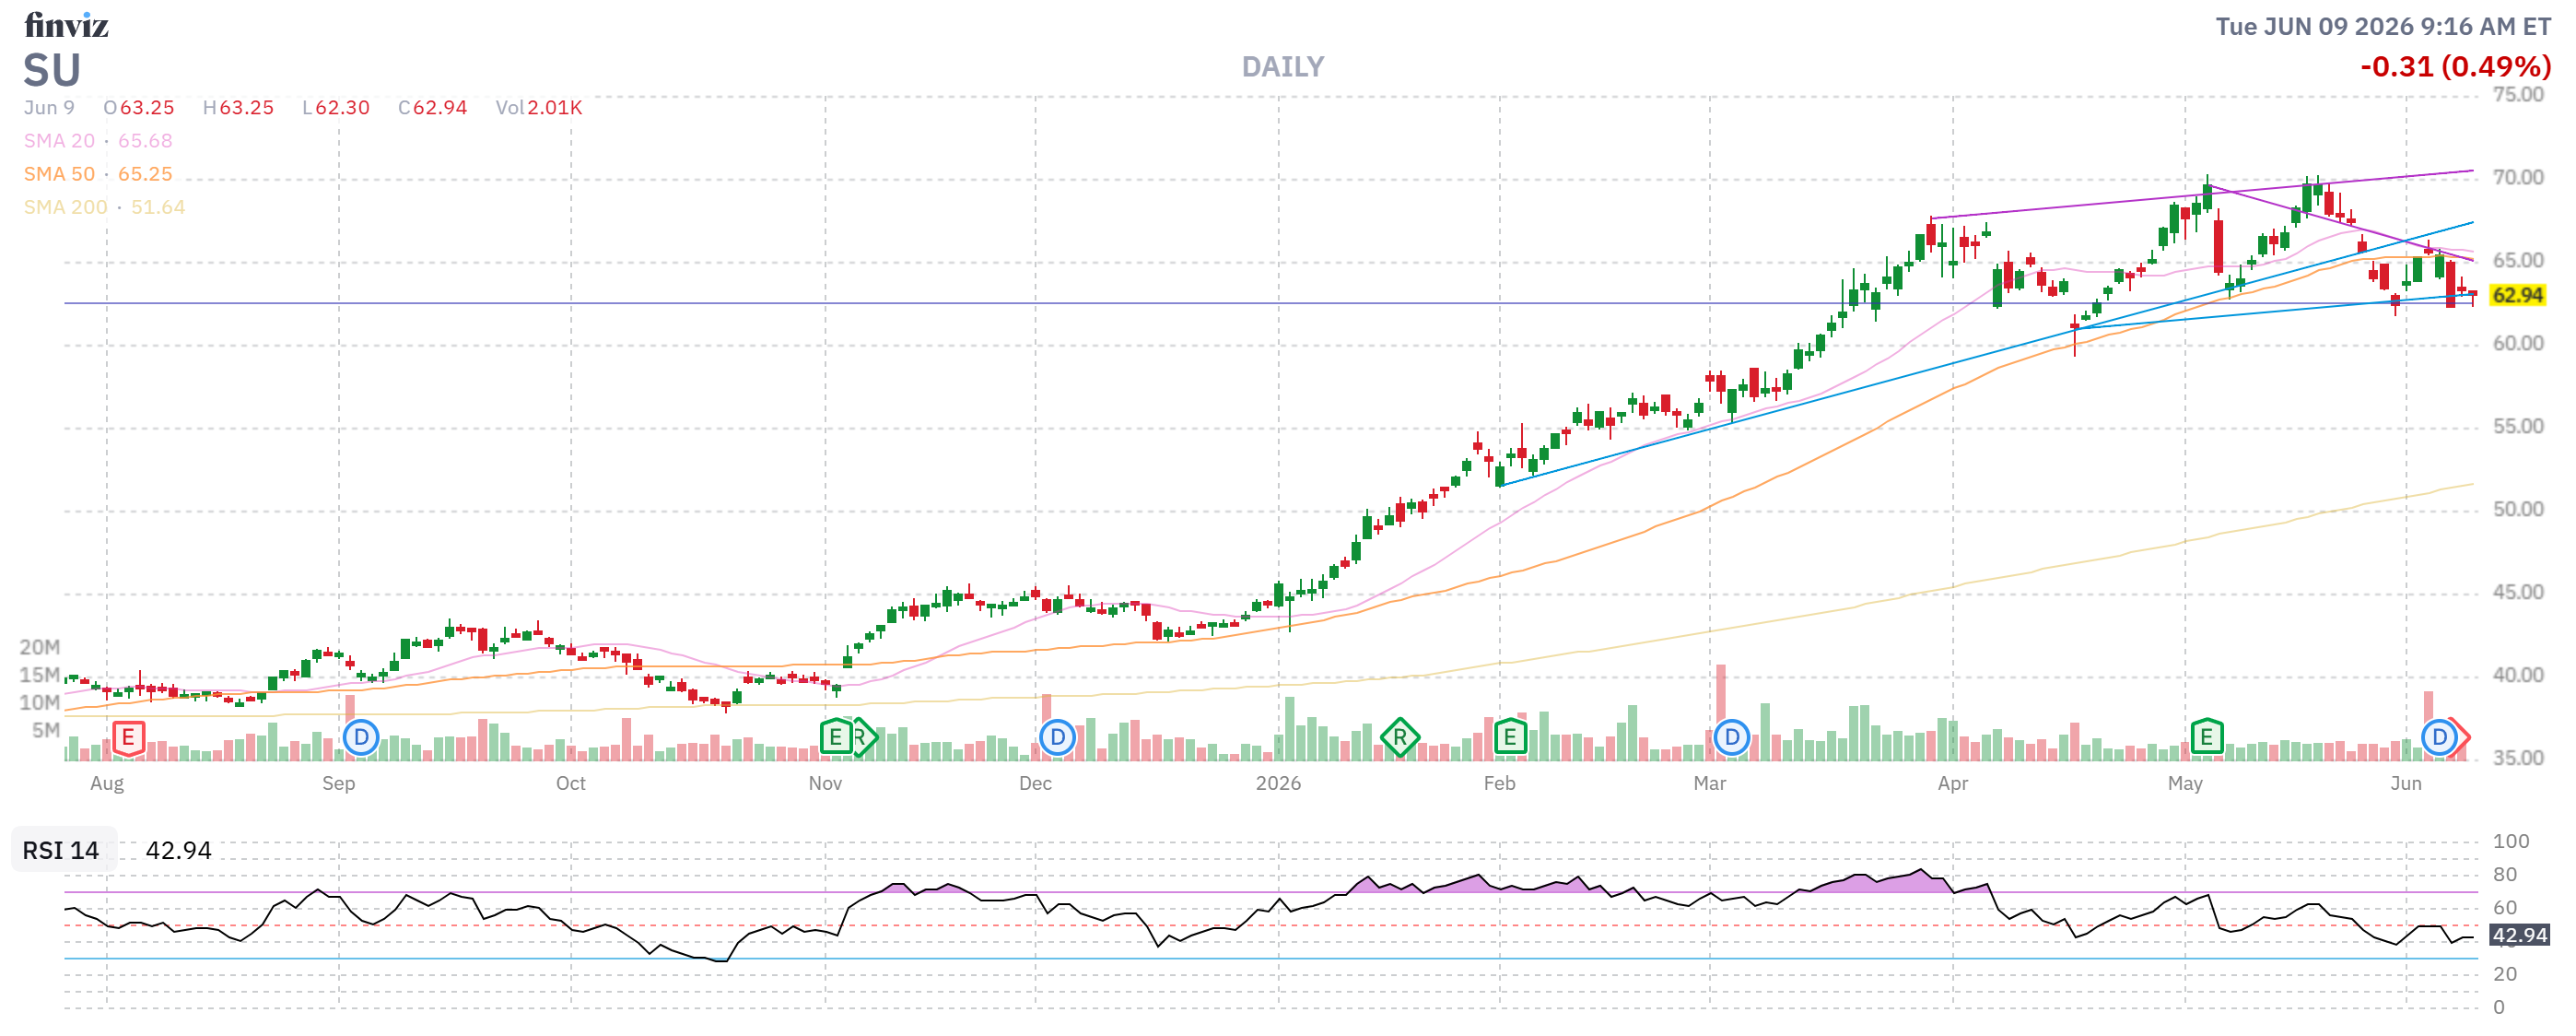
- SU – We started at net $3,455 on the $30,000 spread in April and now we’re at net $8,162, which is up $4,707 (136%) in 10 weeks – which is not bad at all. Still, there is $21,838 (267%) of upside potential PLUS we made $3,608 (104%) on the short June puts and calls, which we will not roll ($738) to 7 short Sept $60 calls at $6.60 ($4,620) and 5 short Sept $60 puts at $3 ($1,500), which puts net $5,382 (65%) in our pocket for the next quarter.
By the way, if you (yes, YOU!) want to learn to trade like this – simply CLICK HERE to join PhilStockWorld and see ALL of our Member Portfolios and even participate in our Live Member Chat Room, our Educational Webinars and, of course, gain access to the AGI Round Table – the smartest AIs on the planet!

-
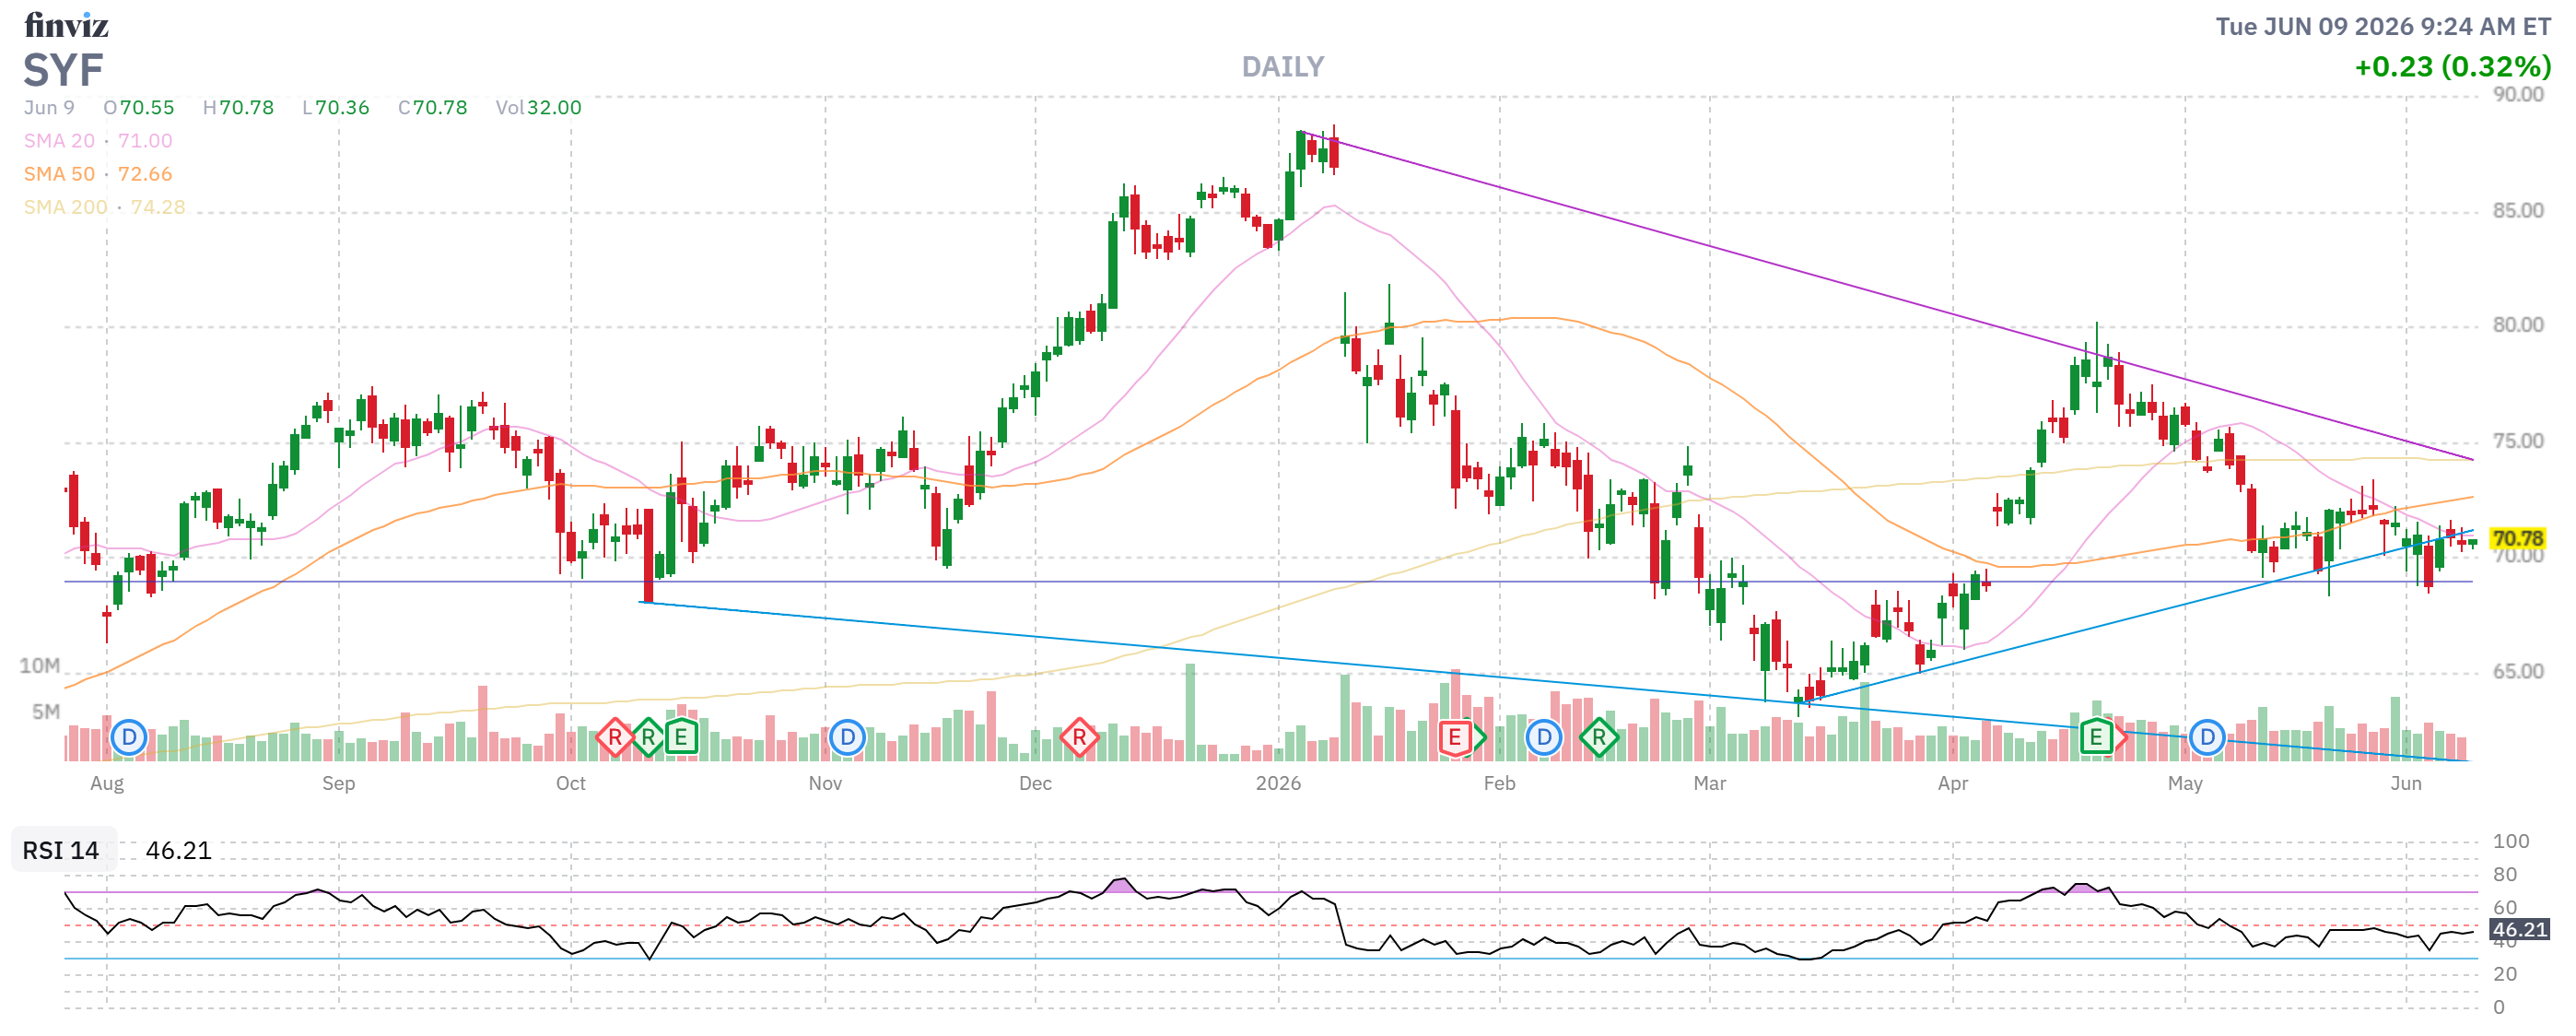
- SYF – These are just leftover short puts from a trade we cashed out. Waiting for them to expire. Upside potential is the $6,825 (100%) we still owe – as long as they hold $65.
-
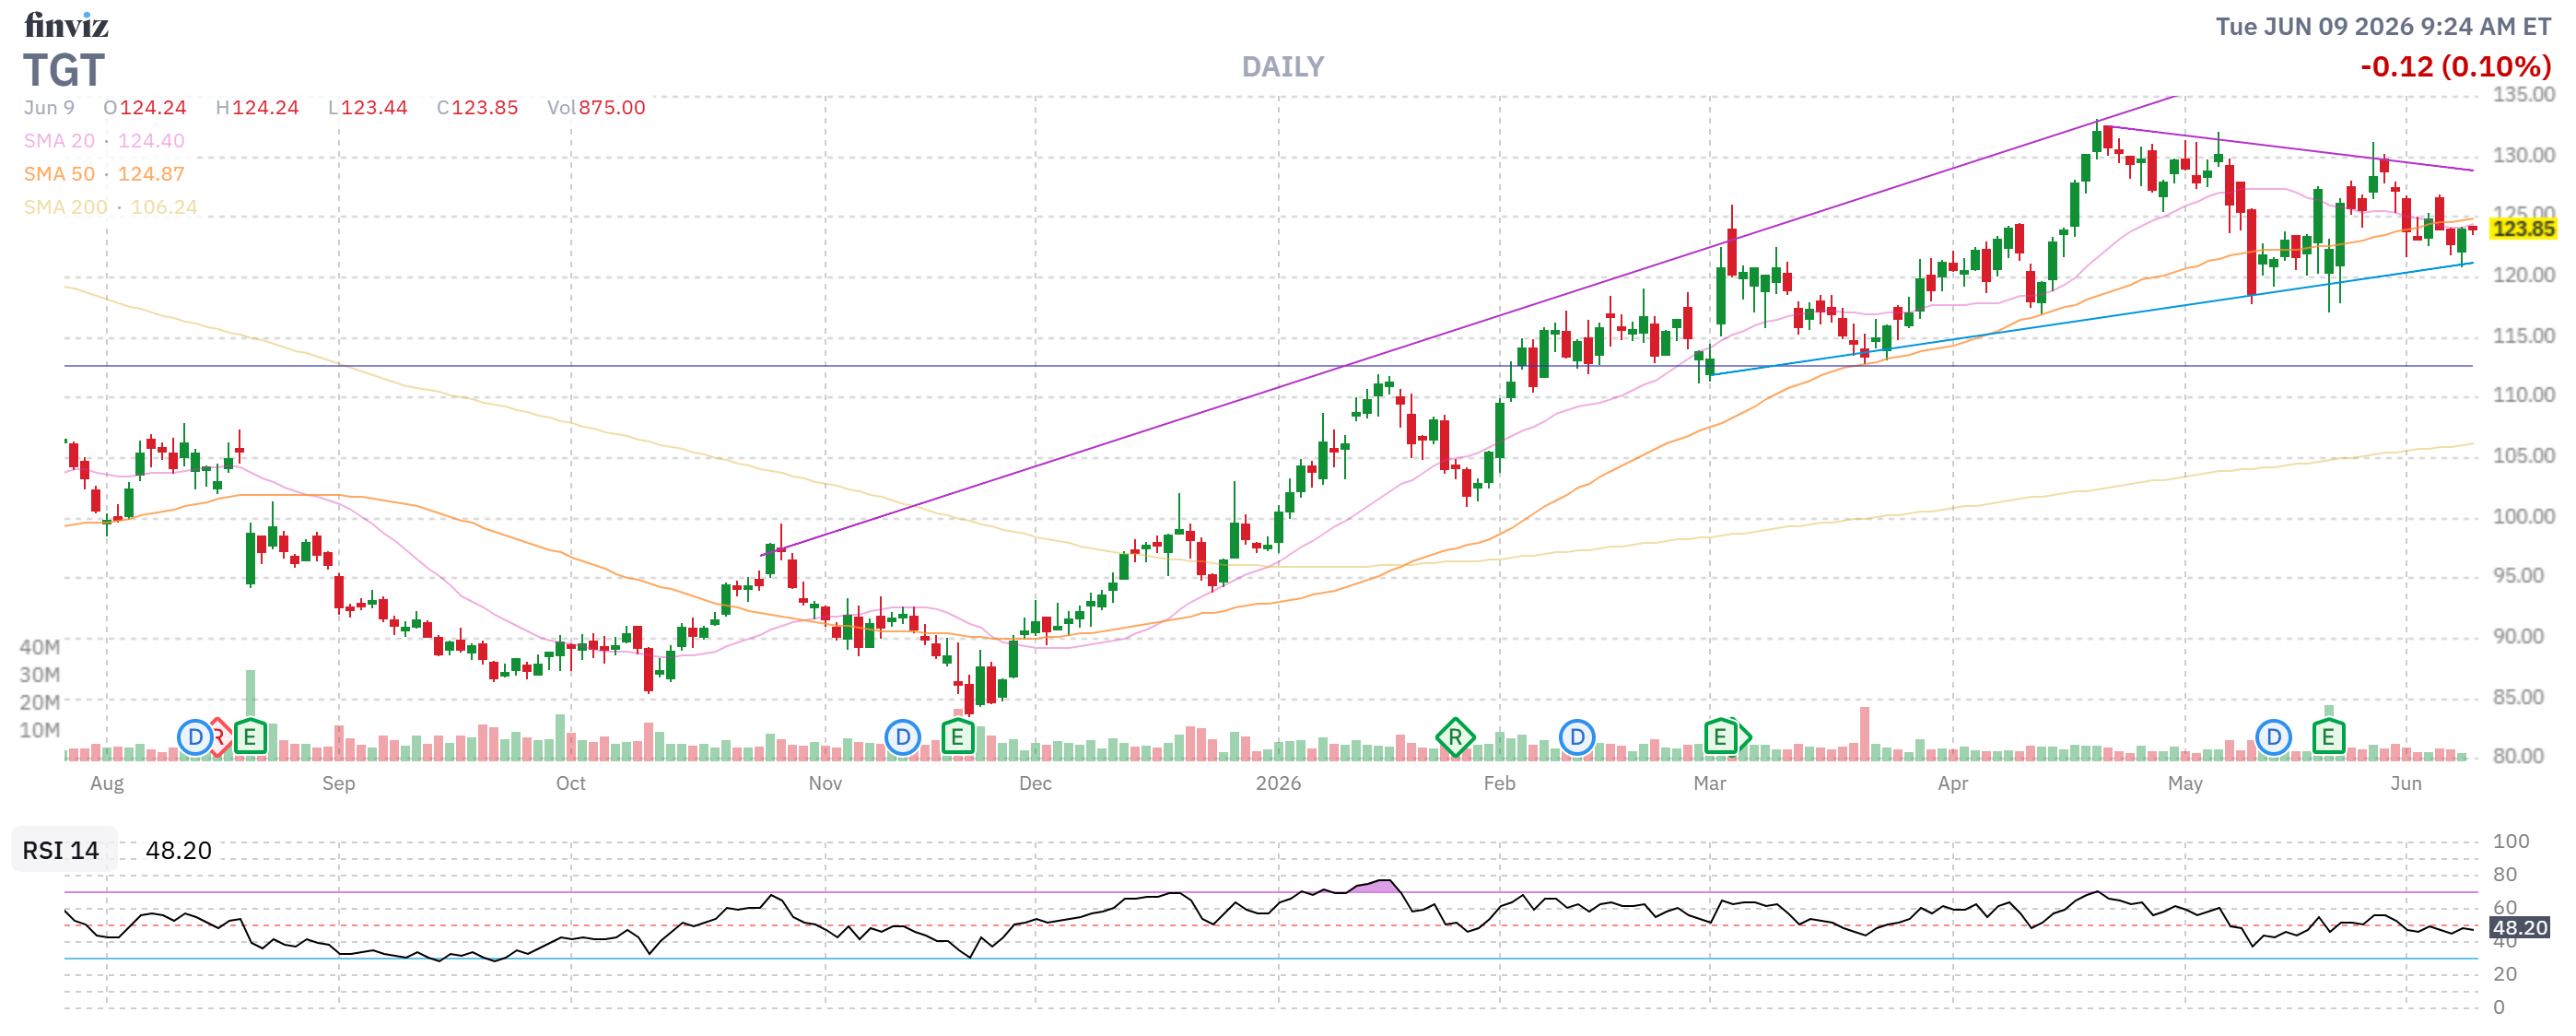
- TGT – That was a ballsy call! They were testing the bottom of the range but it paid off well with $91,420 in gains already (because we started with a net $36,710 credit) thanks to our very aggressive put sale back in October. We’ll collect the remaining $8,800 in 6 months if TGT stays over $100 but it’s just a $60,000 spread so now we’re playing it for income.
- The 2028 bull call spread is net $36,250 so it has $23,750 (65%) of upside potential and we’re going to roll the short June puts and calls ($9,440) with a tiny profit to 10 short Sept $125 calls at $10 ($10,000) and 10 short Sept $120 puts at $7.20 ($7,200).
-
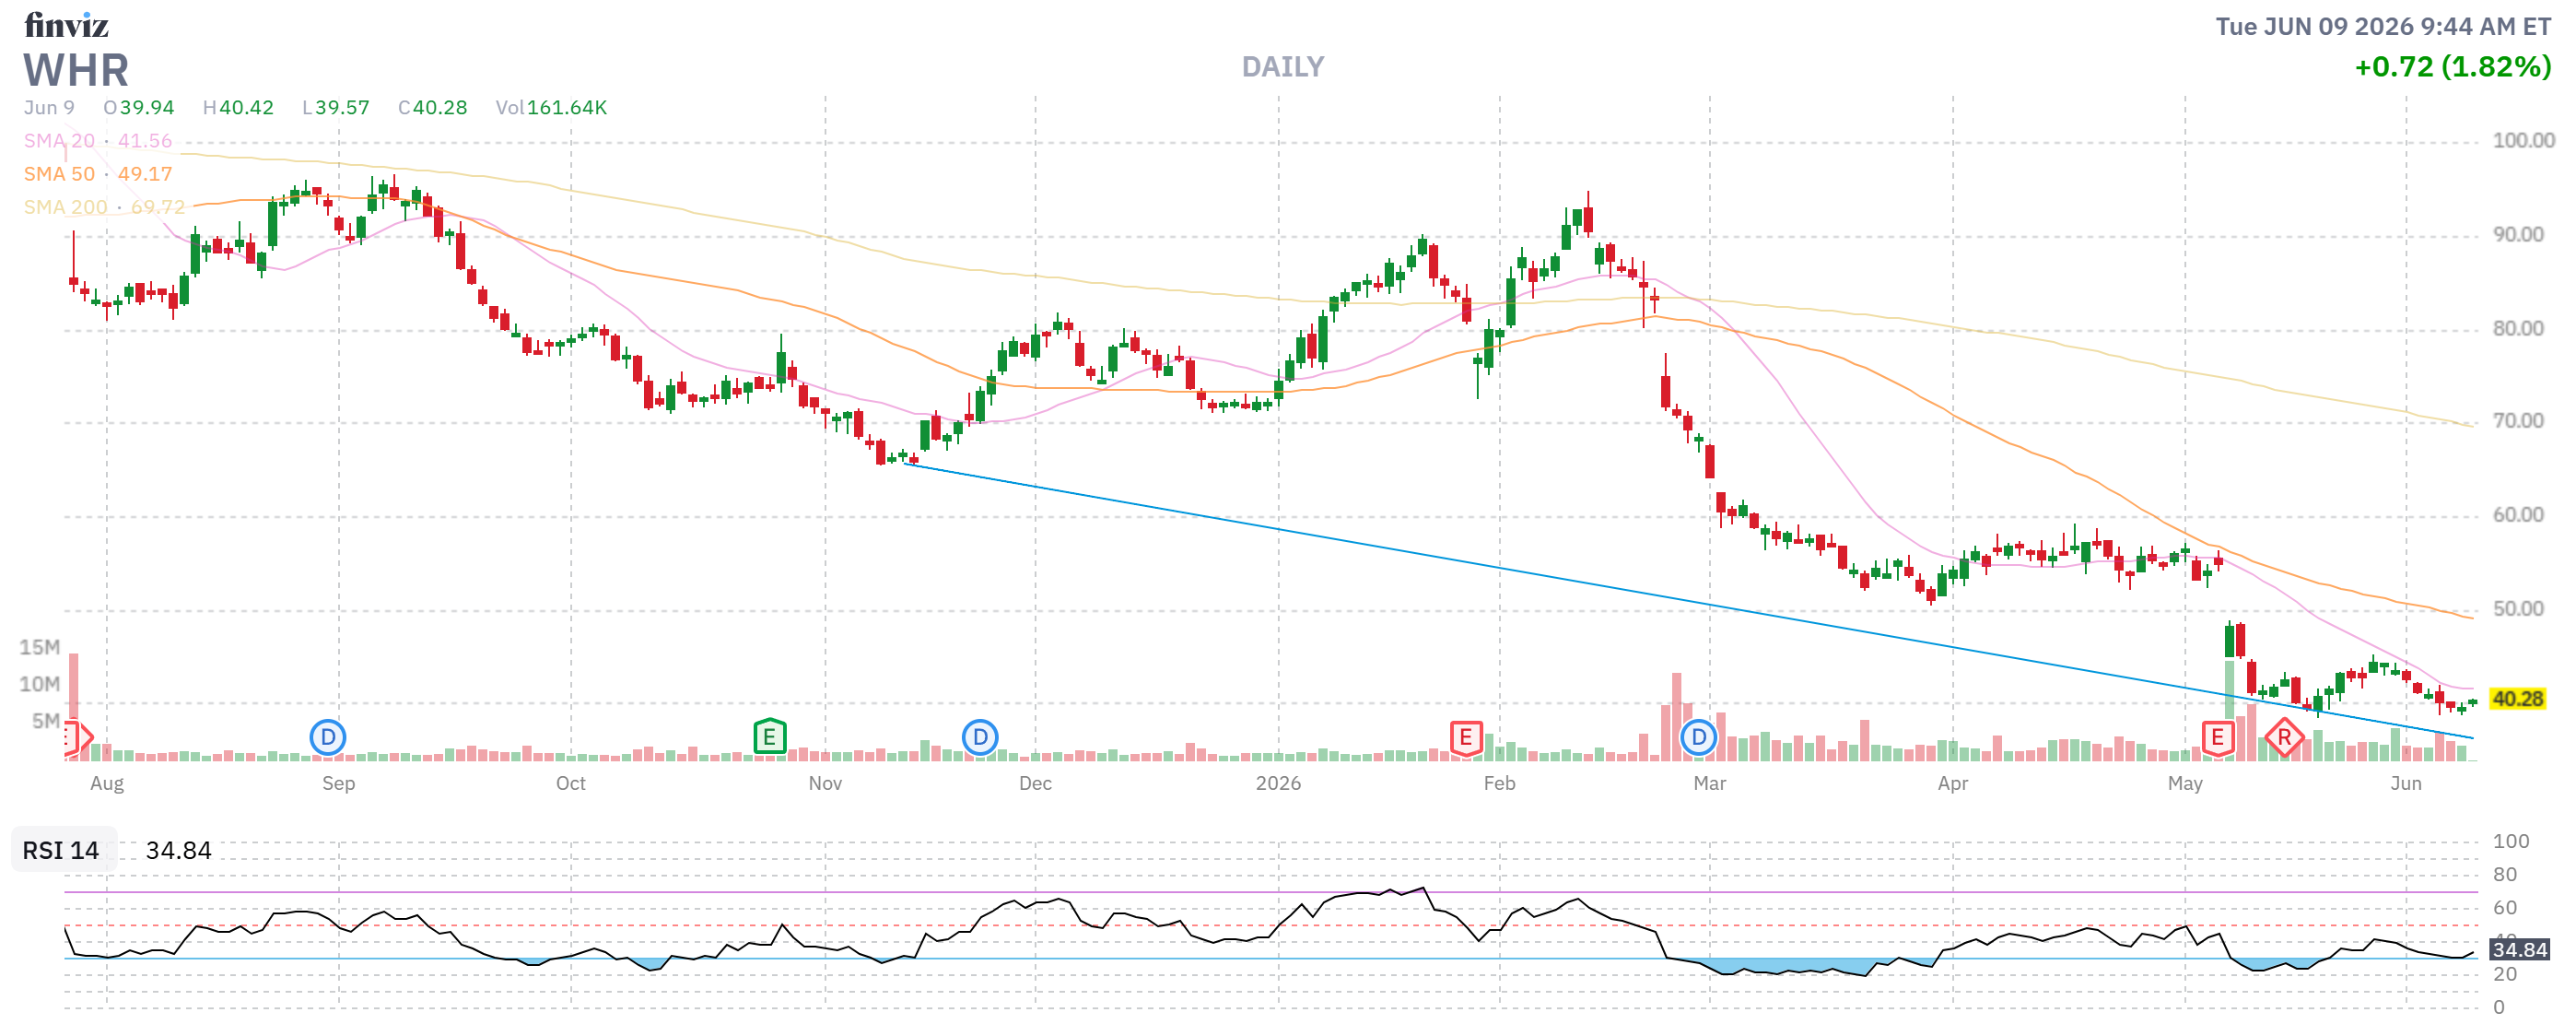
- WHR – Whirlpool has been crashing but we’re only down about $5,000 and we decided to ride it out but $39.66 is too low for our spread so we’re going to roll the 25 2028 $60 calls ($20,625) to 30 2028 $30 calls at $18.60 ($55,800) and those $90 calls are not happening so we won’t spend $8,900 to buy them back and we will wait to sell 6more 2028 calls.
- WHR is trading at 8x forward earnings so let’s say 12x would be $60 and that would be $30 x 30 ($90,000) on the spread with $56,225 (166%) upside potential. We will close out the 2028 $80 puts and sell 15 2028 $40 puts for $11.50 ($17,250) and we will roll the short June puts and calls ($7,765) to 10 short Sept $45 calls at $4 ($4,000) and 10 short Sept $40 puts at $5 ($5,000).
-
- XOM – Net $38,060 on the $60,000 spread has $21,940 (57%) of upside potential and we nailed the mark in June so now we’ll sell 10 Sept $150 calls for $10 ($10,000) and 10 Sept $145 puts for $7.65 ($7,650) so we’re not in it for the $21,940 – we’re in it for 6 quarters of $17,650 or $105,900 (278%) of potential premium sales!