

 What a month we've had!
We're still only about halfway back to where we were in the summer but, WOW!, quite the effort has gone into rescuing this market from certain DOOM!!! at our 1,850 predicted floor. I would have been a lot happier seeing some healthy consolidation down there before we raced back to check out the 22-week moving average, which just so happens to be sitting right on that 2,000 mark but the 200-day moving average is at 2,023 – so no excuse for getting rejected here, other than psychological.
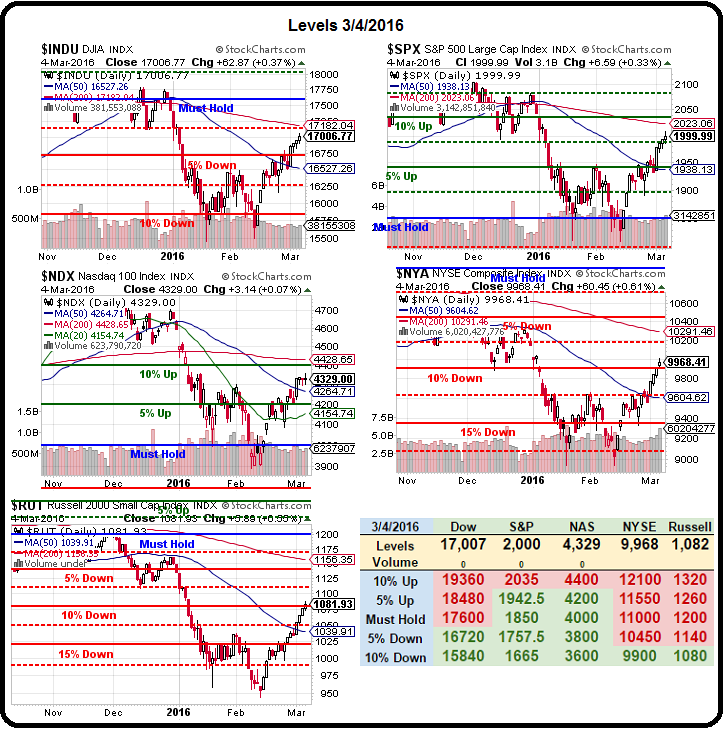
If you expect your technicals to work (the 200 dma), then you don't want to see psychologicals having a great effect or it means your technicals are BS (they all are) and you have no idea what the market is going to do. As you can see from our Big Chart, all of our indexes are well above their 50 dmas and looking to challenge their 200 dmas, let by the Dow and S&P, who only need to cover 1% to hit their goals.
We're waiting on the ECB to announce a new stimulus package and this isn't one of those times where Draghi is likely to get away with his usual "all talk, no action" statements as, just this morning, German Factory Orders slipped another 0.1% (was -0.2% last month) and that's not going to get us back to the critical 10,000 line on the DAX (now 9,727) which is still 10% below the critical 11,000 line (Must Hold) which is still miles below the 12,500 high they hit just 12 months ago.
So, to recap, the German Stock Exchange is still down 22% from it's highs last year and the Nikkei is still down 20% but the S&P is down 5% and we're expecting a rally if the rest of the World is still technically bearish? Come on people – get realistic! If you want to be an effective short-term trader, you have to learn to have realistic expectations of how much an index, and the stocks within the index, should move given different data inputs.
Speaking of data, if you want to see something scary, check out Deutsche Banks Liquidity Metrics Dashboard:

It's a great study and way too scary to talk about on a Monday morning, when there might be children reading. Let's just say it would be prudent to be a bit cautious here, using the same shorting lines we used on Friday morning, when I said to our Members (and you, in the morning post):
Labor Force Participation down yet again so maybe the gains are BS but, on the whole – I don't see this as being enough to pop 2,000 so I like /ES short at the lone watching 17,000 on /YM, 4,350 on /NQ and 1,080 on /TF and 17,200 on /NKD. If ANY of them are over their lines – I wouldn't short but I would short /ES for sure below 2,000 with tight stops.
Don't forget Kaplan gets to spin this back at 10:45 so don't get too attached to these short plays – it's just nice to lock in some quick profits (about $500 per contract at the moment) to pay for some weekend fun and trust in the TZA and SDS hedges to be our main protection. This might even help bring back our natural gas contracts (/NG), which are trading at $1.62 this morning.
That all worked out just as expected and Kaplan gave us the expected rally and /NG blasted back to $1.67 for a $500 per contract gain as well (and is back to $1.62 this morning for another round of bullish bets). Interest in Natural Gas is picking up and I'm being interviewed on the subject this afternoon – I'll post a link tomorrow but it's nothing I haven't told you before and I just did a PowerPoint on the subject at the NY Trader's Expo two weeks ago.
Keep in mind the Natural Gas ETF (UNG) is our Trade of the Year and it's very rare that you are still able to play our trades of the year this deep into the first quarter but you can still make the following trade:
- Sell 10 UNG 2018 $5 puts for $1 ($1,000)
- Buy 20 UNG 2018 $5 calls for $2.10 ($4,200)
- Sell 20 UNG 2018 $9 calls for $0.95 ($1,900)
That puts you into the $8,000 spread for a net of $1,300 in cash, so the potential upside is $8,700. Your obligation, should UNG be below $5 (now $5.90 with Nat gas at $1.62) would be to own 1,000 shares of the ETF for $5,000 PLUS the $1,300 you put in (presumably lost if you don't pull the plug early) so net $6.30 is more than the current price, so this is a very aggressive trade. The margin on 10 shorts is net $517.49 of ordinary margin so it's a very efficient trade to have in your portfolio with a potential for a better than 4x return on cash+margin.
I know UNG isn't as sexy as our usual trade of the year picks but there's nothing unsexy about 200% annualized returns, is there? That's why I've been banging the table on this one. Once people catch on to the fact that US exports of natural gas have nowhere to go but up – it's not likely we'll see these prices again.
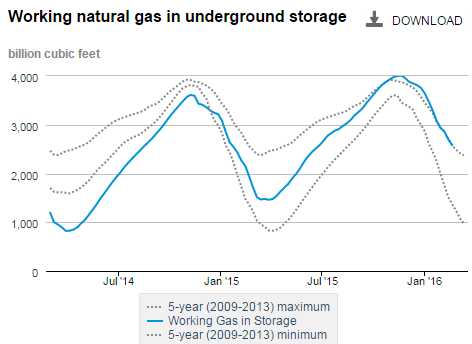 The negative spin on natural gas is that we have record high storage (we do) but that's because production has ramped up in anticipation of exports, which will drain off that excess within 18 months, putting us back into the low end of the range. This is a chart that reflects 0Bcf of exports and, over the course of the year, 9Bcf/day will come on-line for export. Figure a slow start and we average just 3Bcf/day in 2016 – that's still 1,095Bcf taken out of storage over the course of 2016 and suddenly we're in the low end of the range.
Then, since the exports ramp UP over time, the pace for 2017 at 9Bcf/day would be 3.3Tn cubic feet of natural gas being exported or ALL of our storage so we'd BETTER be oversupplied now or the price of nat gas will go through the roof!
 But are we, then, oversupplied? Actually, we have a huge problem because, as you probably know, the "rig count" has fallen off drastically in the past year, from 400 active drilling rigs to 97 as of Friday's report. This has little impact on current production as the rigs are used to drill new wells but the average lifespan of a well is 3 years an production tends to drop about 50% after 18 months so what will happen to us 6 months from now, as the production of our current wells begins to drop off and there are no new wells to replace them?
We have a huge supply of natural gas and our current output is sustainable – but not at these prices. Just as oil below $30 begins to break the backs of the producers, forcing production off-line and creating a floor, sub-$2 natural gas prices have a similar effect, which is why we can make money for you over and over again with out bottom calls – it's just math!
In Europe, natural gas is trading for $4.90 vs $1.62 here. In Asia, natural gas is at $8.25 per Bcf. The cost of exporting Liquefied Natural Gas is about $2 per Bcf (Billion Cubic Feet) so net $3.62 is still quite a bit cheaper than even Europe is paying and that's why, if you click the link, you'll see that Europe and Asia's prices have dropped drastically in anticipation of US supply coming on the market.
So our prices should go up a bit and theirs should come down a bit and that's our premise for being long on /NG Futures at $1.62 (again) and you can also see suppliers like Cheniere (LNG), Encana (ECA) and Chesapeake (CHK) running up – even though the price of natural gas hasn't moved yet.
We're just trying to stay ahead of the curve!