

 Let's talk about the 5% Rule™.
For details, you can read this post, but today we're going to focus on the very simple concept of bounce lines. Under our 5% Rule™, we expect moves of 1.25%, 2.5% or 5% on major indexes to have 20% (of the move) corrections along the way, with a greater chance of a correction more likely as we cross each line of resistance.
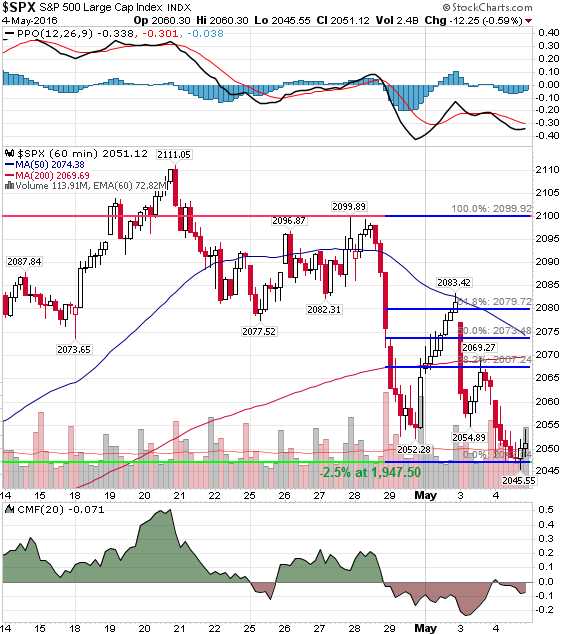
It's the 5% Rule™ that led us to make a long call in yesterday's Live Trading Webinar, as we tested the -2.5% lines on our indexes EXACTLY WHERE WE PREDICTED THEY WOULD BE IN OUR MORNING POST (should be 2,047.50, not 1,947.50).
That's right, using our 5% Rule in the morning, I was able to say in our morning post at 8:33 am:
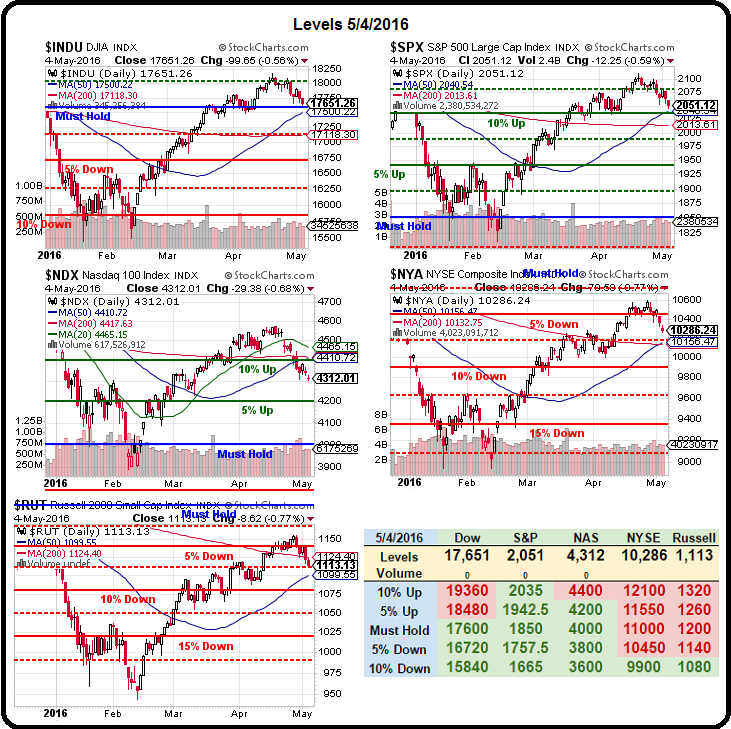
We have a PMI report at 9:45 and ISM Services at 10 along with Factory Orders and, at this point, expectations are low all around so we'll be looking for a bounce at Dow (/YM) 17,550, S&P (/ES) 2,040, Nasdaq 4,300 (/NQ) and Russell (/TF) 1,110 along with /NKD 15,900 but if any 2 are below (including whatever you are playing) – GET OUT!
 The S&P bottomed for the day at 2,039 at 2:05 pm and is already back to 2,055 for a $750 per contract gain in the /ES Futures. In our Live Trading Webinar, we played the Nasdaq Futures (/NQ) over the 4,300 line and made a very quick $168.50 in 5 minutes and then we chose to play Gasoline Futures (/RB) and made a just as quick $580 after another 5 minutes of hard labor at our keyboards. Making $748.50 in 10 minutes is good money so we took it and ran and went on with our Webinar at that point but the lines, like the song, remains the same – ready to be played any time we get a good test.
This post isn't about showing you how to make money trading the Futures – we do that all the time in our Member Webinars (replays available here) and, of course, every day in our Live Member Chat Room. This post is about WARNING YOU not to get sucked in by same action we make money on – the weak bounces off resistance that may or may not lead to recoveries.
The reason we like to take futures longs on bounces is because that way we don't miss anything if it is the start of a recovery but we're also not getting tied up in new trades in an attempt to bottom-fish off a false signal. To be clear – the bounce is reliable – whether or not it leads to an actual rally is impossible to guess – so we just make our money on the bounces and let the rest sort itself out BEFORE we commit our capital to longer-term positions. It's a ridiculously simple and effective system which keeps us from making mistakes in our portfolios.
 When a stock, commodity or index, especially a highly liquid one, makes a 1.25%, 2.5% or 5% move, we expect to see retraces, like the ones noted above, of 20% (weak), 40% (strong) or even 60% of the move. With the S&P, we have a drop from 2,100 (we ignore spikes) to 2,040 (we prefer to use psychological supports if they are close) so we expect to see bounces to 2,050 (weak) and 2,060 (strong) and unless we see those strong bounces taken out across the board – we continue to remain skeptical of the "rally".
Of course we also take into account the volume of the move and the timing of the move (pre and post-market carry little weight) and then we use those bounce lines (/ES now at 2,050) to determine whether or not to maintain a bearish tilt to our portfolios as well as our intra-day bets.
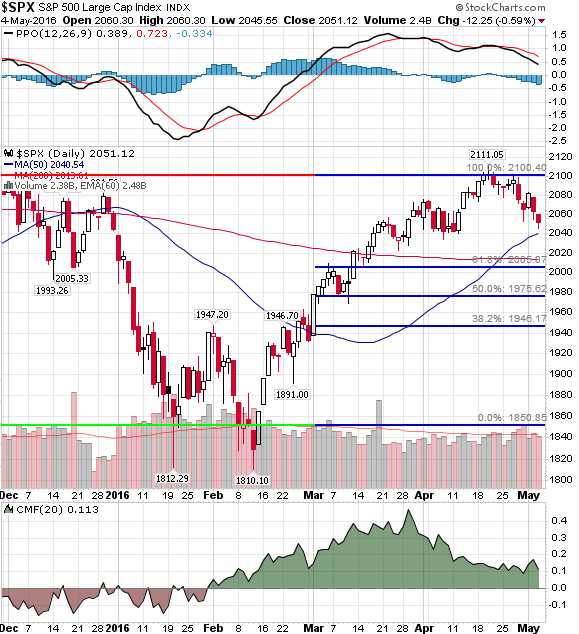
As you can see from the daily S&P chart, we had a run from 1,850 to 2,100, which is 250 points so a 20% (weak) retrace is 50 points, back to 2,050 and holding that line is BULLISH for the broader rally but it also makes 2,050 a significant inflection point for our intra-day trading and failing it is BAD – as it indicates we are likely on the way back to test a strong retrace at 2,000 but that's just normal market action and consolidation at 2,000 is fairly bullish if that holds but, below 2,000 – you have to question the validity of the whole run in the bigger picture.
 As you can see on Dave Fry's weekly S&P chart, we have multiple confirmations that 2,050 is a huge make or break line for the rally and there's no real support at all back to 2,000 but that should hopefully hold up in a non-panic pullback.
Once we establish what CAN happen, we then look ahead to events like the G8 meeting in June, the Brexit vote (also June) the next Fed meeting (also June), the end of earnings season (2 weeks), etc. and we look for the reactions to various inflection points in the news cycle to see if we're shaping a bullish or bearish pattern.
As Fundamentalists, we start with the news and end with the chart while TA people generally begin and end with the chart. We think that gives us a bit of an advantage but there's still a fortune teller in my town reading palms for $20 who has enough business to have her own building – so we have no illusions that TA-based trading will be going away any time soon.
Our 5% Rule™ is not TA – it's just math. We illustrate it with charts but, unlike TA, our charts go forward and, also unlike TA – our charts tend to make accurate predictions! This week we think failing 2,050 on /ES makes for a good bet to 2,040 and, unless we're back to 2,060 by Friday – we'll be staying fairly bearish into the weekend. 17,600 on the Dow continues to be critical and the next big line is the 2,035 line on the S&P (+10%) which, if it fails, will indicate we're not bearish enough with our hedges but we're not likely to see that until next week – if at all.


