

 Four years!
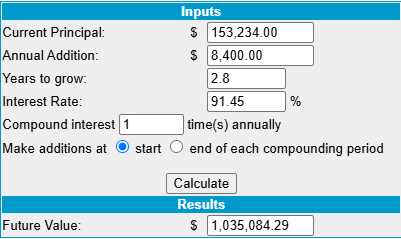
And what a first 48 months it has been. The VIX dropping to 15.68 this morning gave us a huge boost (because we sell a lot of premium) and this morning we’re at $153,234 (365%) and that averages 91.45% PER YEAR, which I keep saying is crazy and unsustainable but IT KEEPS GOING UP ANYWAY – who’d have thought?
We’re up $16,773 since our July 7th Review, when we were “only” pacing at 80.37%. Obviously, if we keep adding 10% per month – we’ll continue to pick up the pacing and I will once again caution not to expect that – because of math we will do later. We are SUPPOSED to make $2,326/week so $16,773 in a month is an outlier – but this is two outliers in a row and we fear a correction and need to plan for it!
Still, as I said last month:
“Everything is proceeding as I have foreseen… muhahahaha!!!“
I also said: “See, you don’t have to be the Dark Lord of the Sith to do this – it’s just math…” and it still is! If you CONTROL your portfolio and analyze each position and you KNOW how they should perform in a flat market or an up 20% or down 20% market – then you are not very likely to be surprised by the results, right?”
As noted in the title, our original plan, on August 25th of 2022, was to invest $700/Month in a no-margin portfolio and try to make at least 10% per year so that, in 30 years, we would have $1M. And yes, I was conservative and I expected we could do 20%, maybe 30% but 90% – no – this is silly!
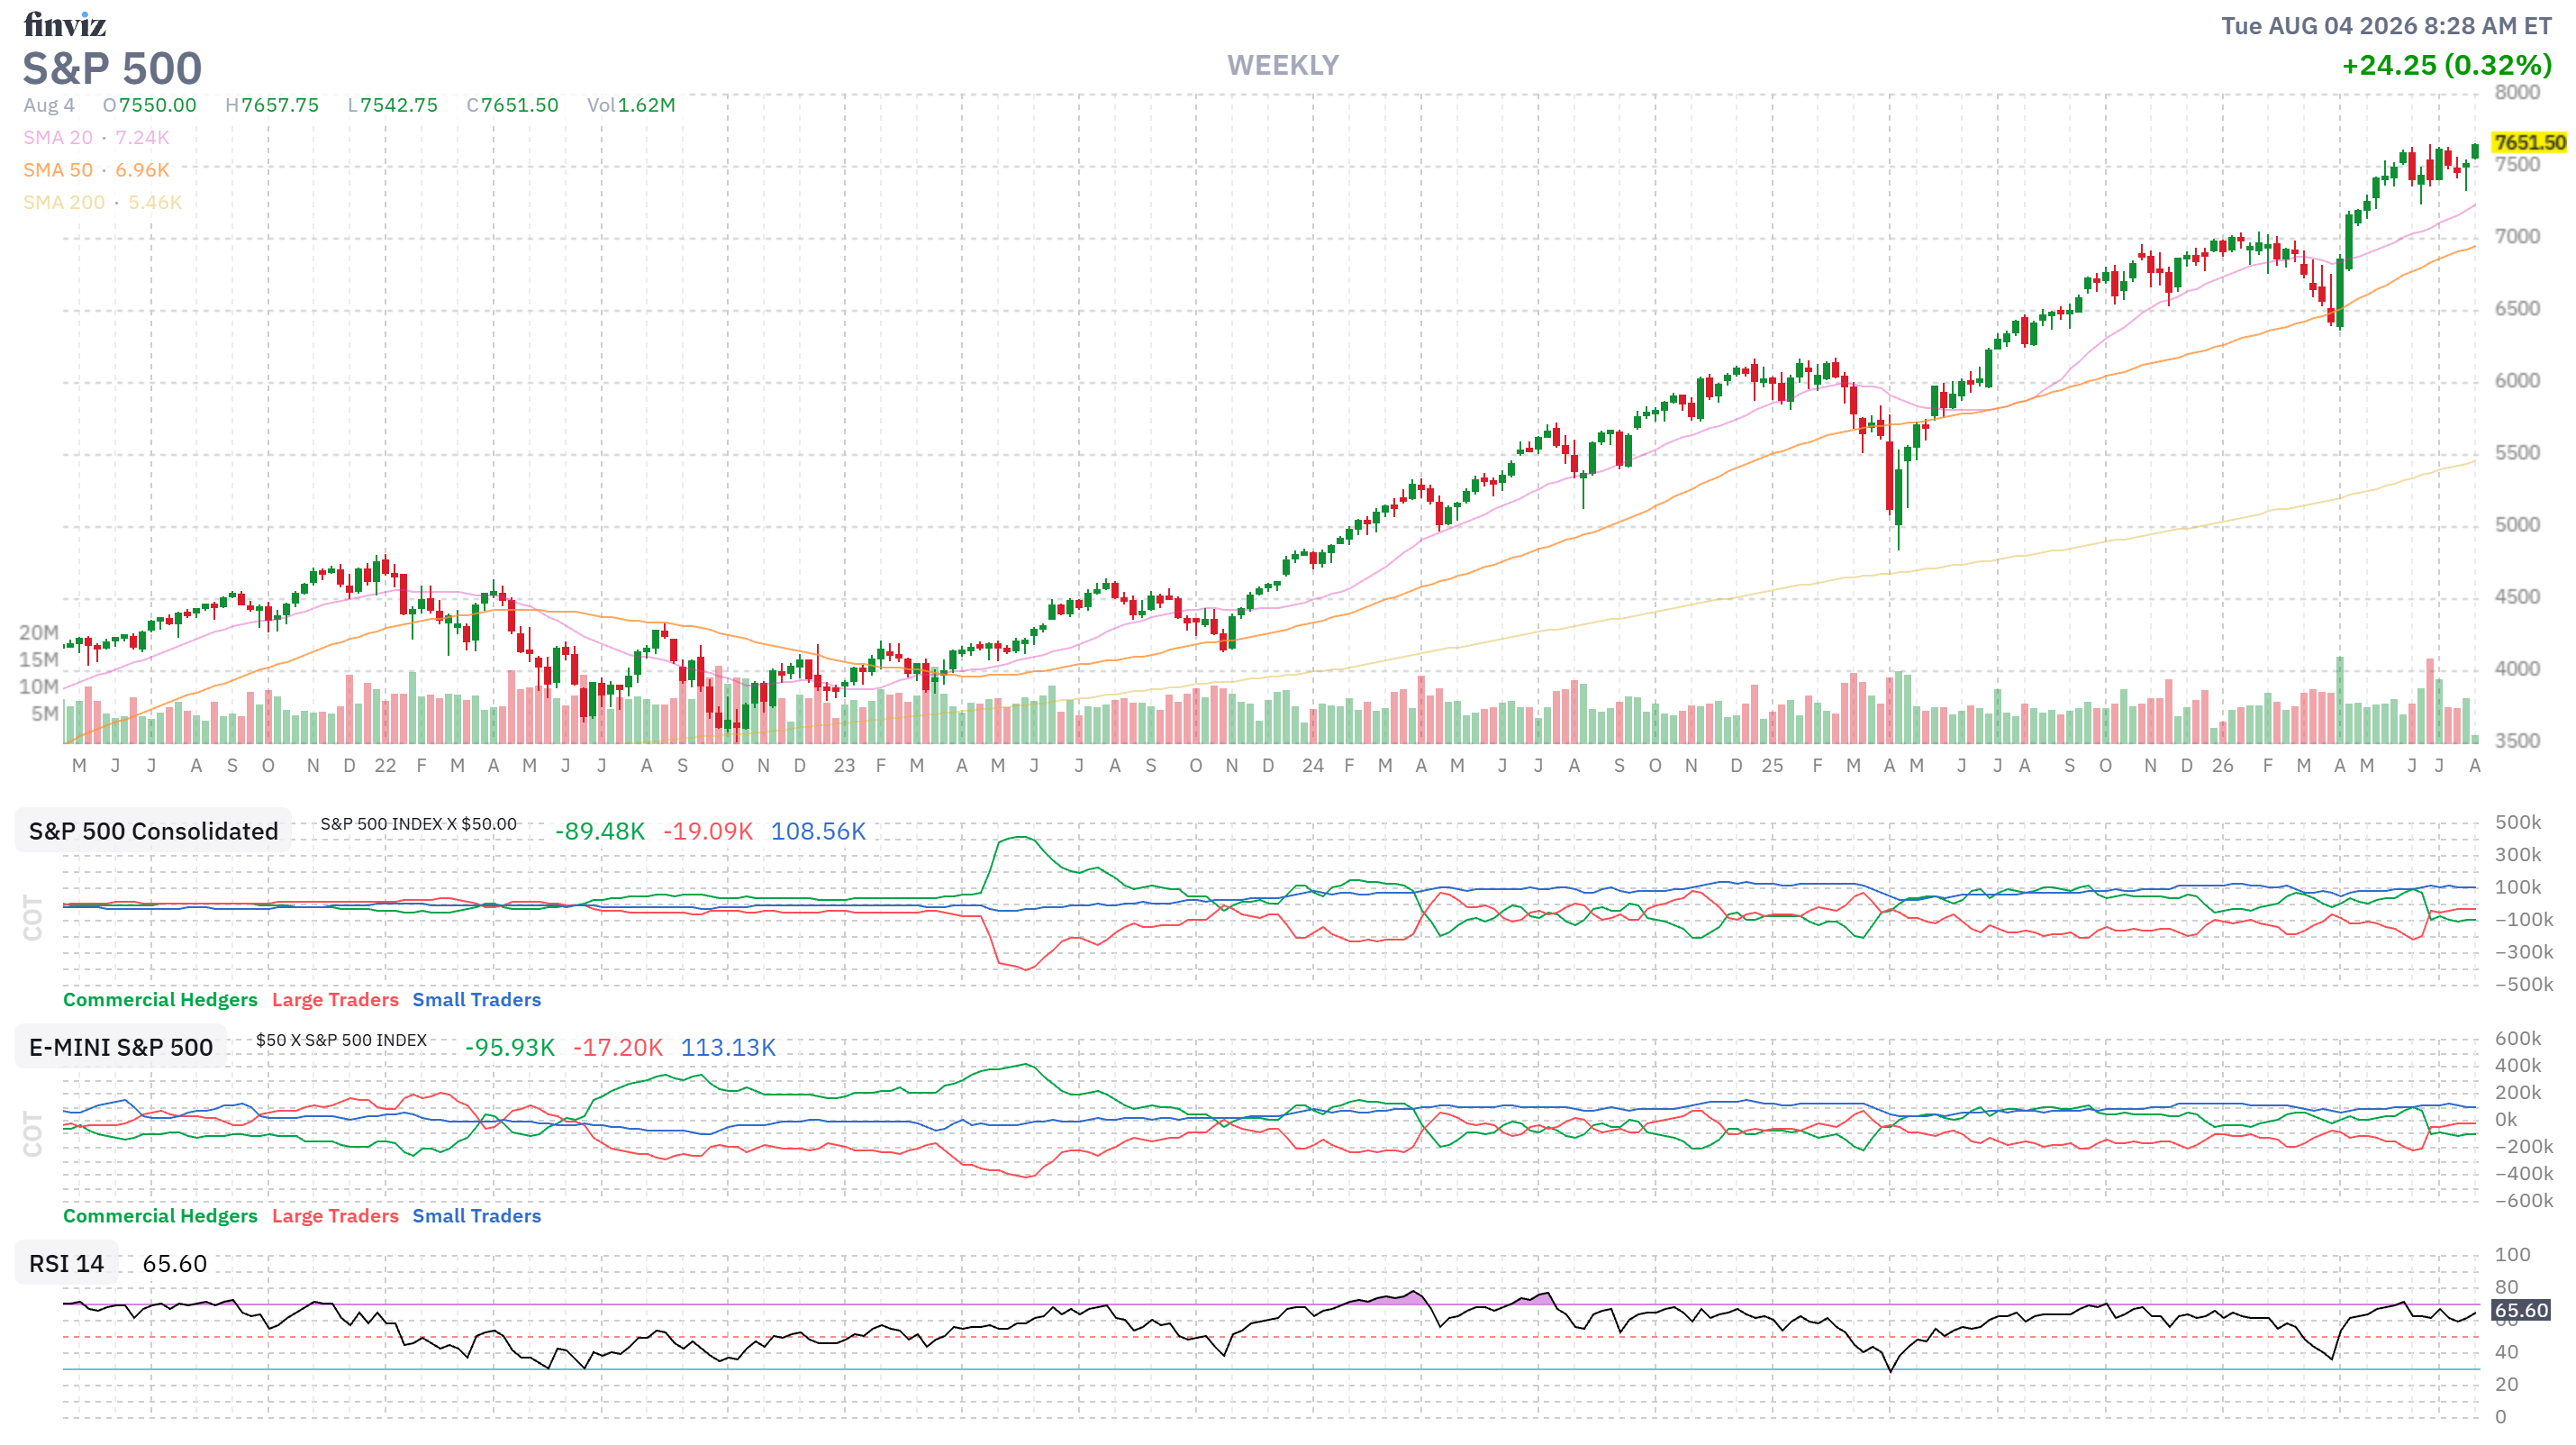
Of course the markets have been a bit silly for the last 4 years with the S&P 500 almost doubling and, more importantly, we skipped all 3 dips by predicting them in advance – being prepared for them ahead of time AND taking advantage of them when they happened – THAT was a big reason we outperformed – that and our “Be the House – NOT the Gambler” system.
Thanks to ONE great month, we’re now just 34 months from $1M – which is kind of strange as we only have $153,234 and that’s BECAUSE we can’t count on this continuing but I do keep saying that, over and over again:
-
- How to Become a Millionaire by Investing $700 per Month – Part 47/360
- How to Become a Millionaire by Investing $700 per Month – Part 46/360
- How to Become a Millionaire by Investing $700 per Month – Part 45/360
-
How to Become a Millionaire by Investing $700 per Month – Part 44/360
-
How to Become a Millionaire by Investing $700 per Month – Part 43/360
-
How to Become a Millionaire by Investing $700 per Month – Part 42/360
- How to Become a Millionaire by Investing $700 per Month – Part 41/360
- How to Become a Millionaire by Investing $700 per Month – Part 40/360
- How to Become a Millionaire by Investing $700 per Month – Part 39/360
- How to Become a Millionaire by Investing $700 per Month – Part 38/360
-
How to Become a Millionaire by Investing $700 per Month – Part 37/360 – Year 4 Begins!
-
How to Become a Millionaire by Investing $700 per Month – Part 36/360 – 3 Years In!
So I’m not going to say we can’t do it – as we’re doing it but I would caution new followers NOT to count on it – as we’re running a supernatural pace at the moment and we’re more invested (15% cash) than I like but up and up and up, Up, UP the market goes – where it stops, nobody knows….
As I said last month:
“We spent A LOT of money in the past month and we’re down to just $18,583 (13.6%) in CASH!!! and I’m not happy about that AT ALL – so I’m going into this review LOOKING to cash out anything that I don’t ABSOLUTELY want to own for the next 30 days:”
That hasn’t changed but in the last review, I couldn’t find much I didn’t like and it turns out I was right but I have the same attitude going into today’s review – I am VERY skeptical about being back at the market highs – again:
-
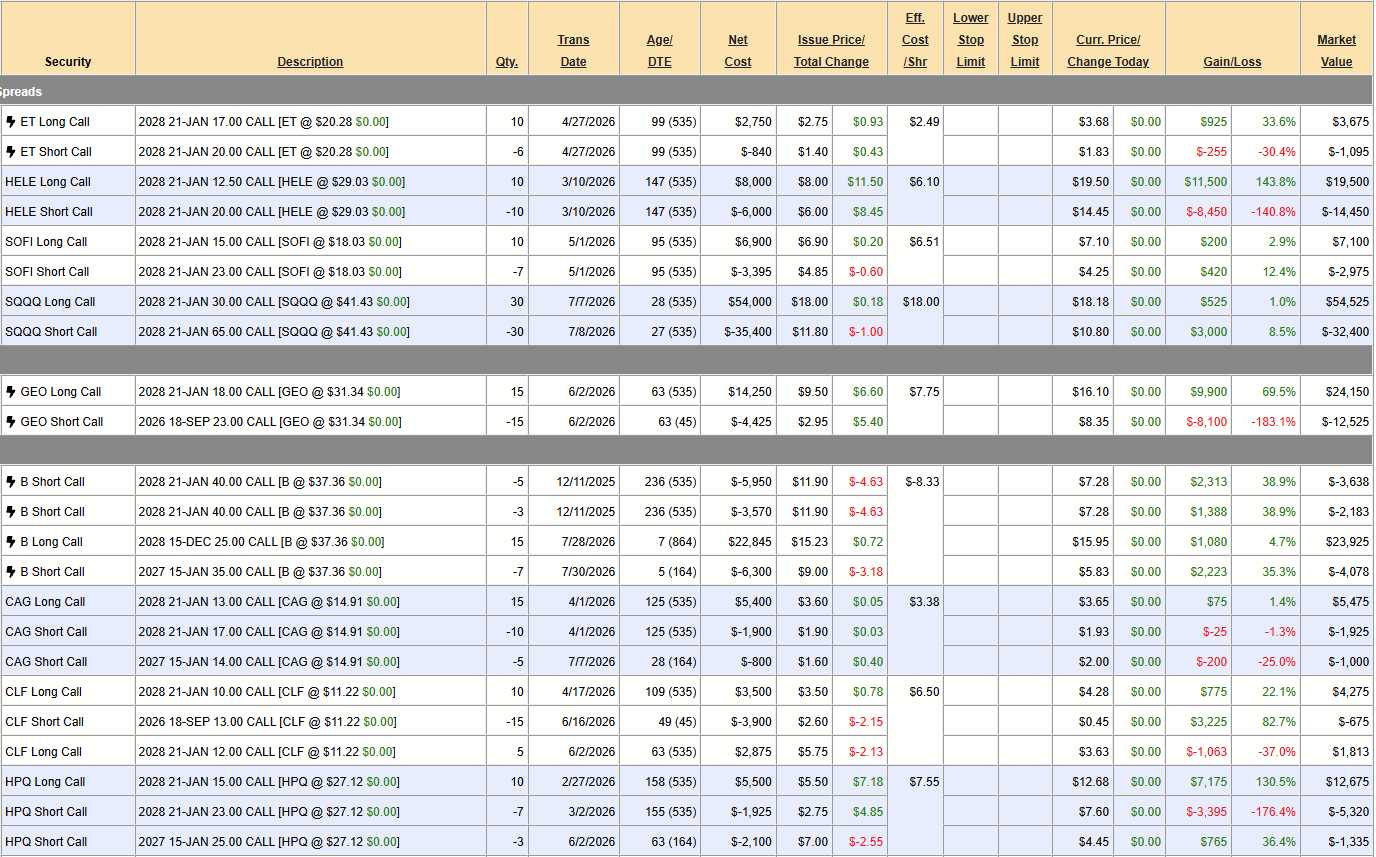
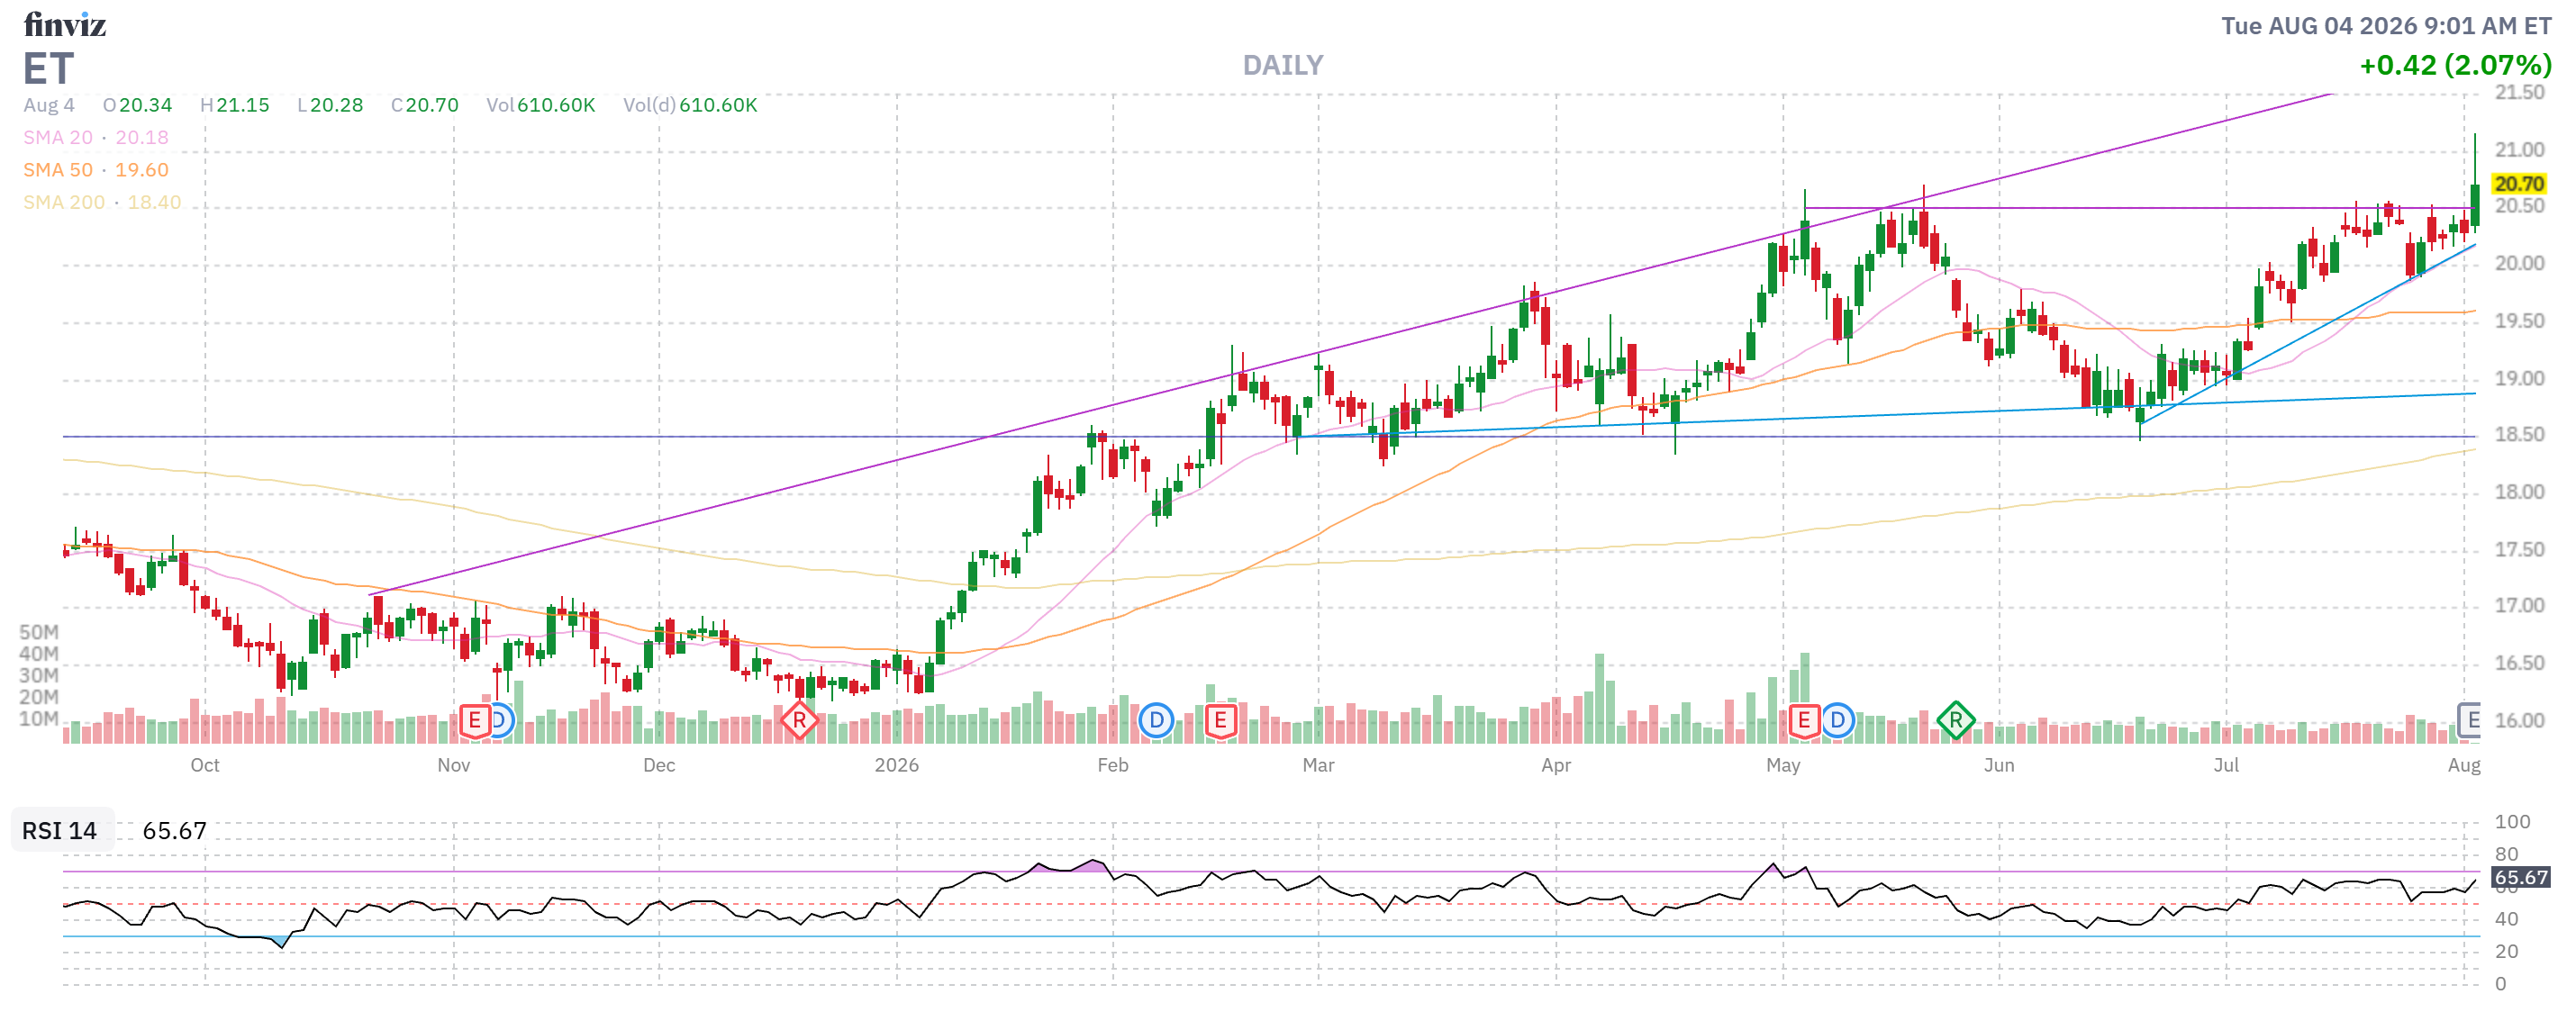
- ET – At our goal and we have no reason to think earnings (today) won’t be good and the Jan $20s are only $1.10 so we COULD collect $400 and cap our gains or we could gamble and we can afford to gamble (something we rarely do in this portfolio). We’ll see what happens. Currently we’re at net $2,580 on the $3,000 spread with $420 (16.2%) left to gain.
-
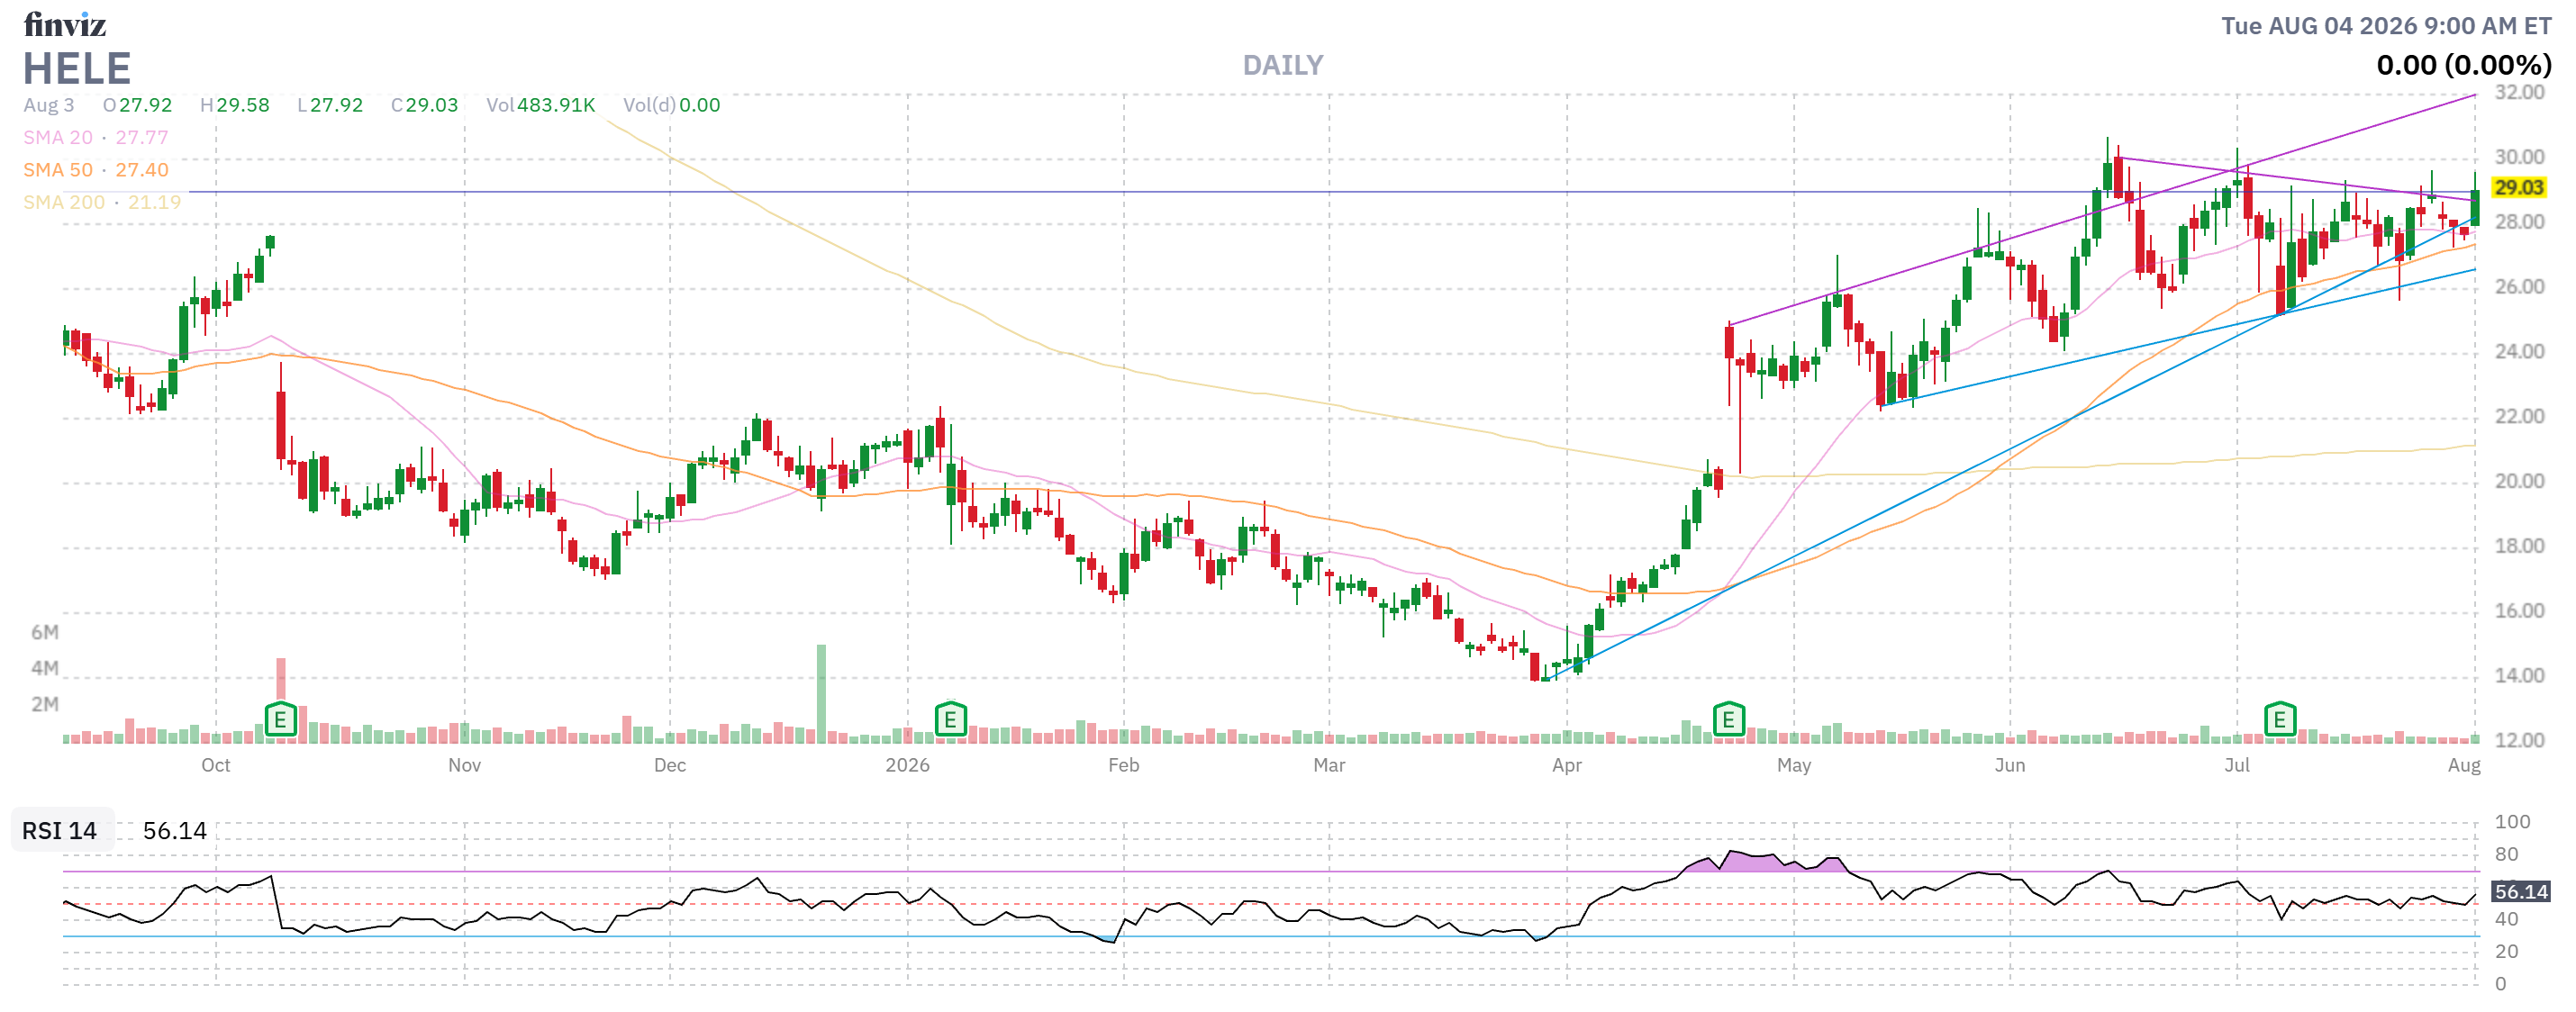
- HELE – Miles over target at net $5,050 in the $7,500 spread so $2,450 (48.5%) left to gain and no reason we don’t expect to be paid in full but keep in mind 48.5% sucks vs our 90% average annual and this is where it gets dangerous as this is a GREAT TRADE yet it’s also an under-perfomer! This is that math problem I was talking about. In order to keep going at this pace – we can force ourselves to take risks we shouldn’t be taking while throwing out perfectly good trades just to hit an unrealistic benchmark. Tricky!
-
- SOFI – Earnings were good, as expected and we’re getting a nice pop and we can do much better – so we’ll let it run for now. Net $4,125 on the $8,000 spread has $3,875 (93.9%) upside potential and that’s more like it!
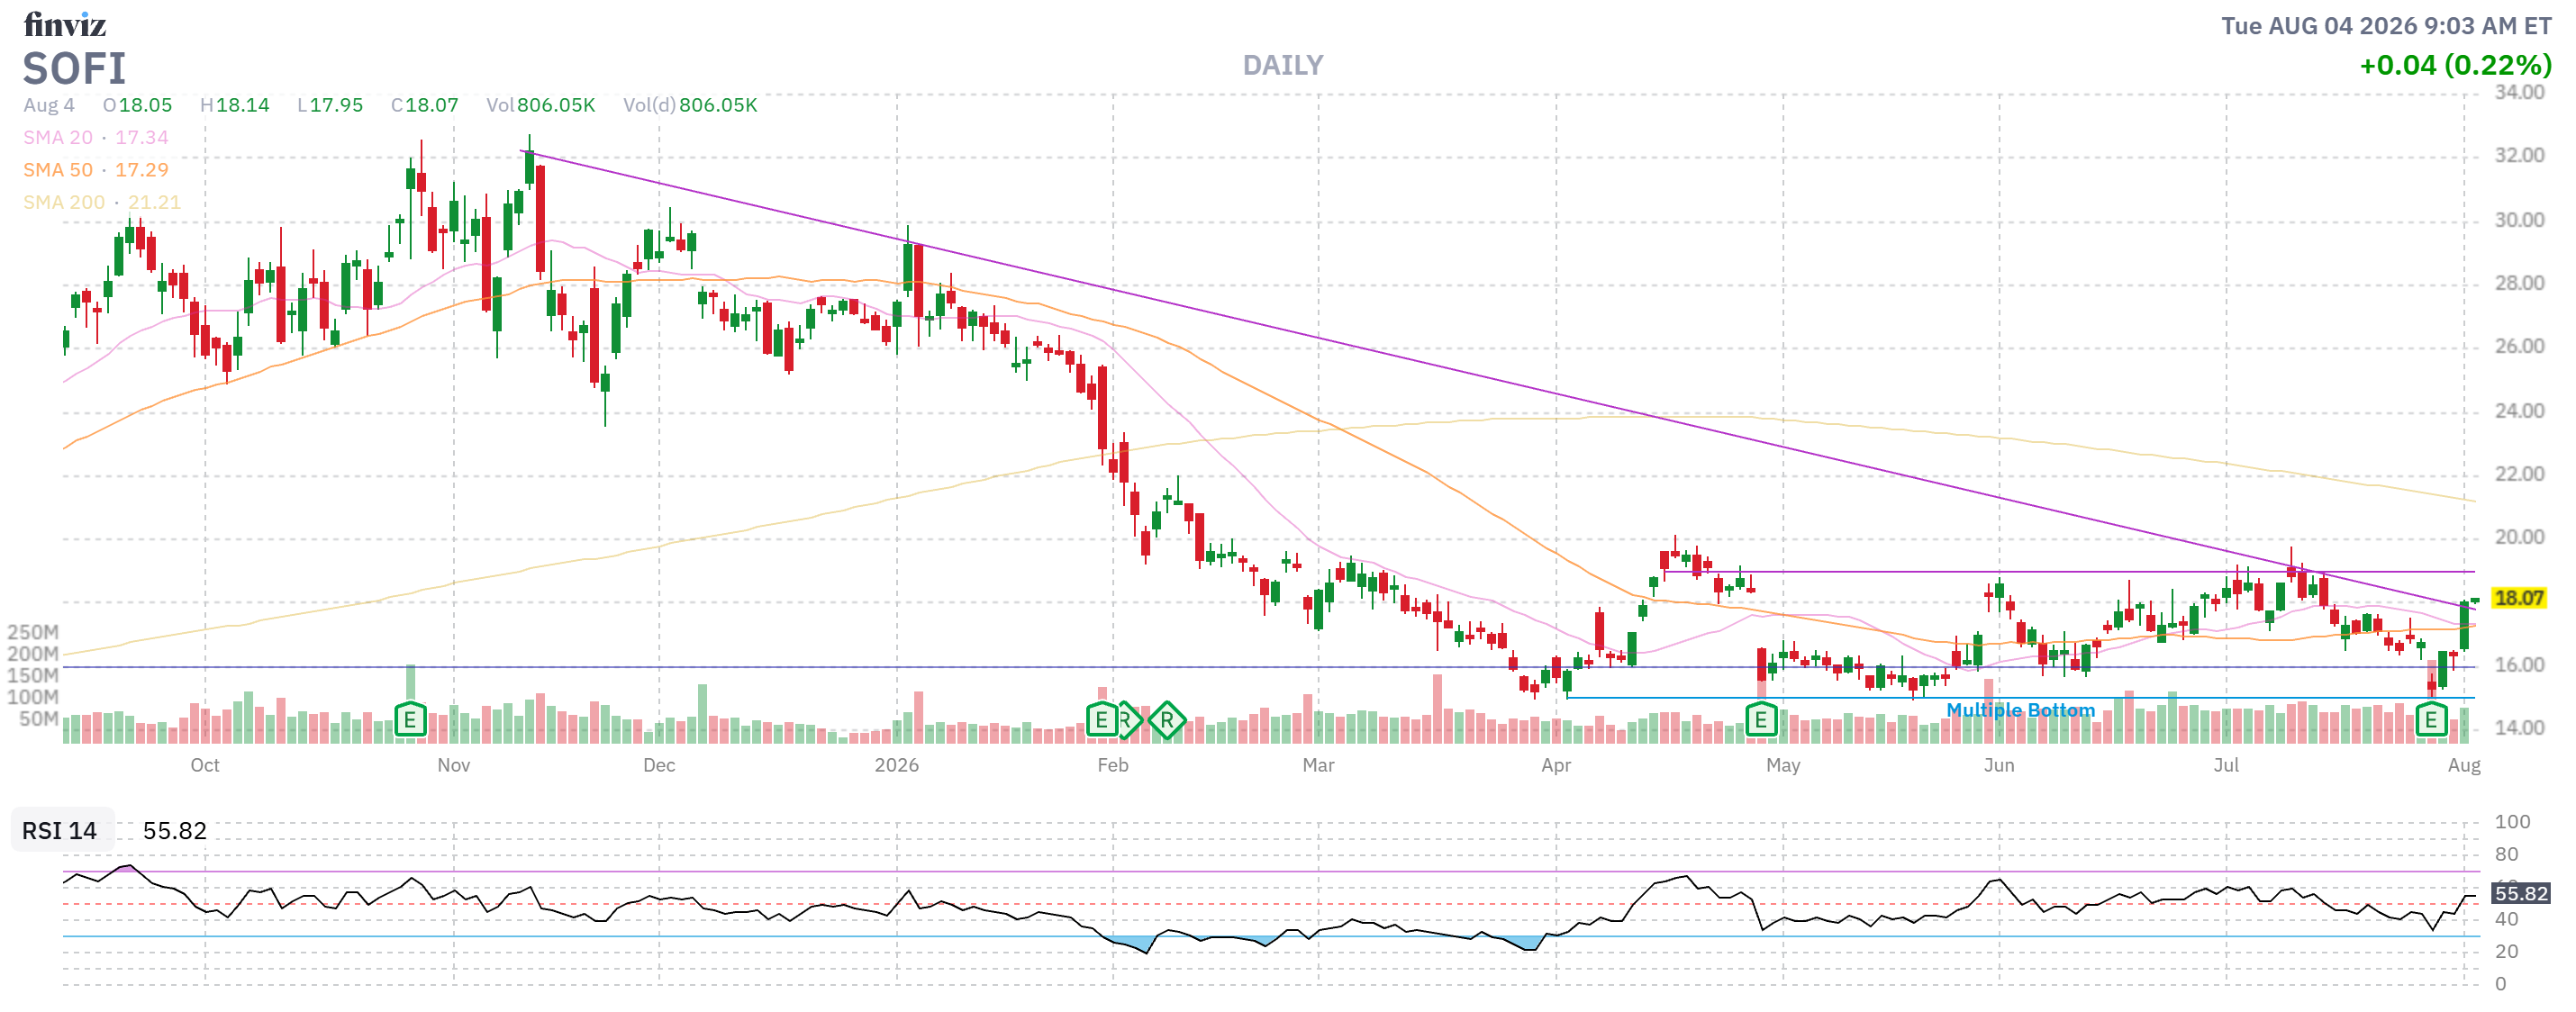
So the question is: Should we take the $5,050 from HELE that is VERY LIKELY to make 48.5% and swap it into HELE, which can make more than 93.9% but certainly with some risk? Oh, sorry, I’m genuinely asking – I have no idea! That’s why we have both – there’s no easy decisions, no “rules” other than, when in doubt – lean towards diversification!
-
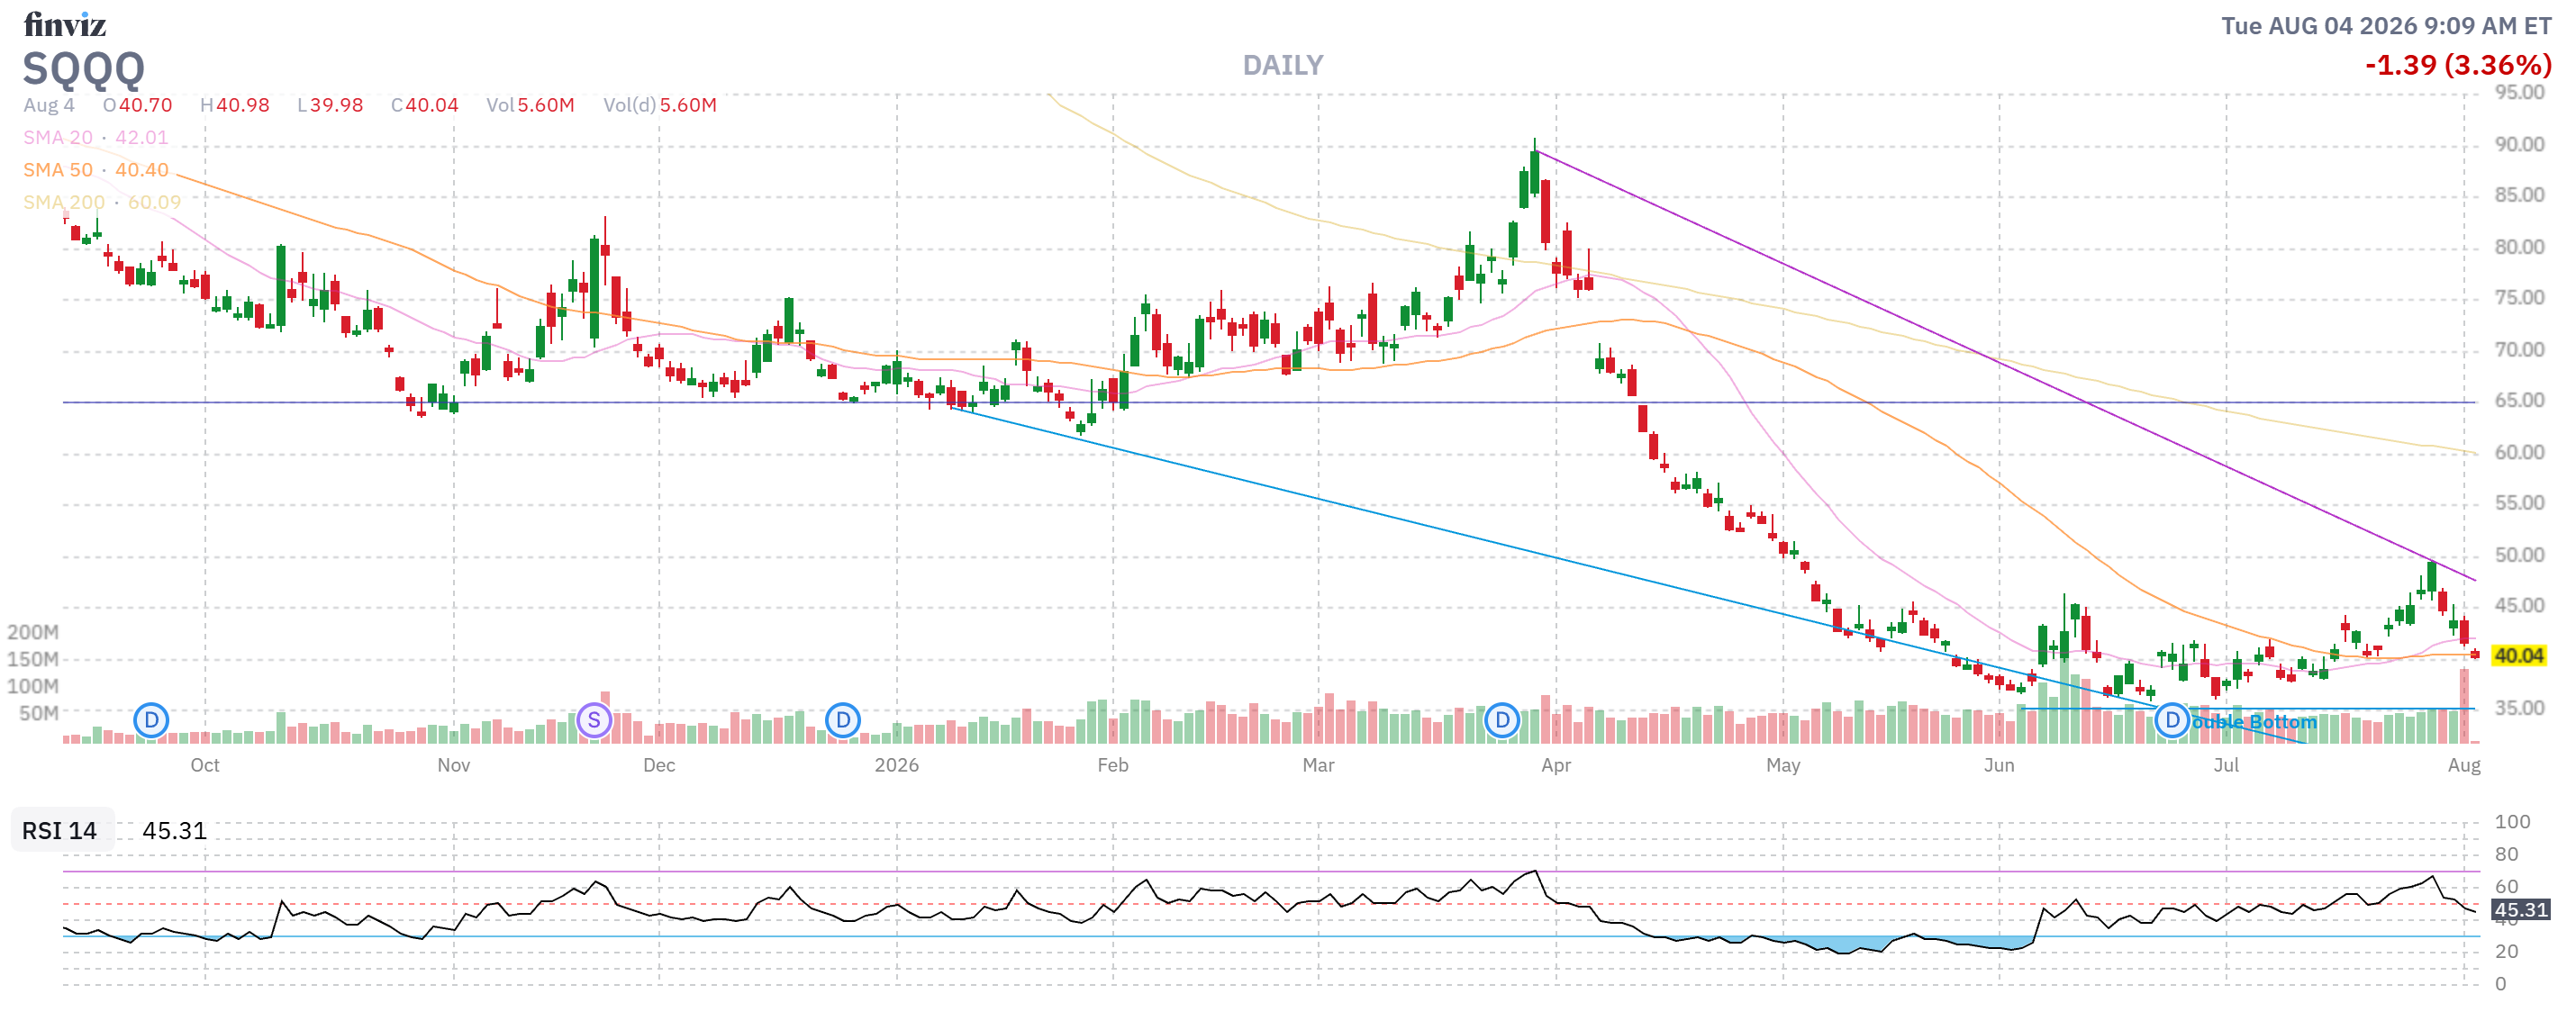
- SQQQ – Looks like we picked the wrong month to add hedges! It’s actually holding up well considering the Nasdaq. The position is net $22,125 on the $90,000 spread so it’s giving us $67,875 of downside protection against a 20% Nasdaq drop but that $22,125 WILL BURN AWAY over the next 18 months – so we’d better outearn it in a good market, right?
-
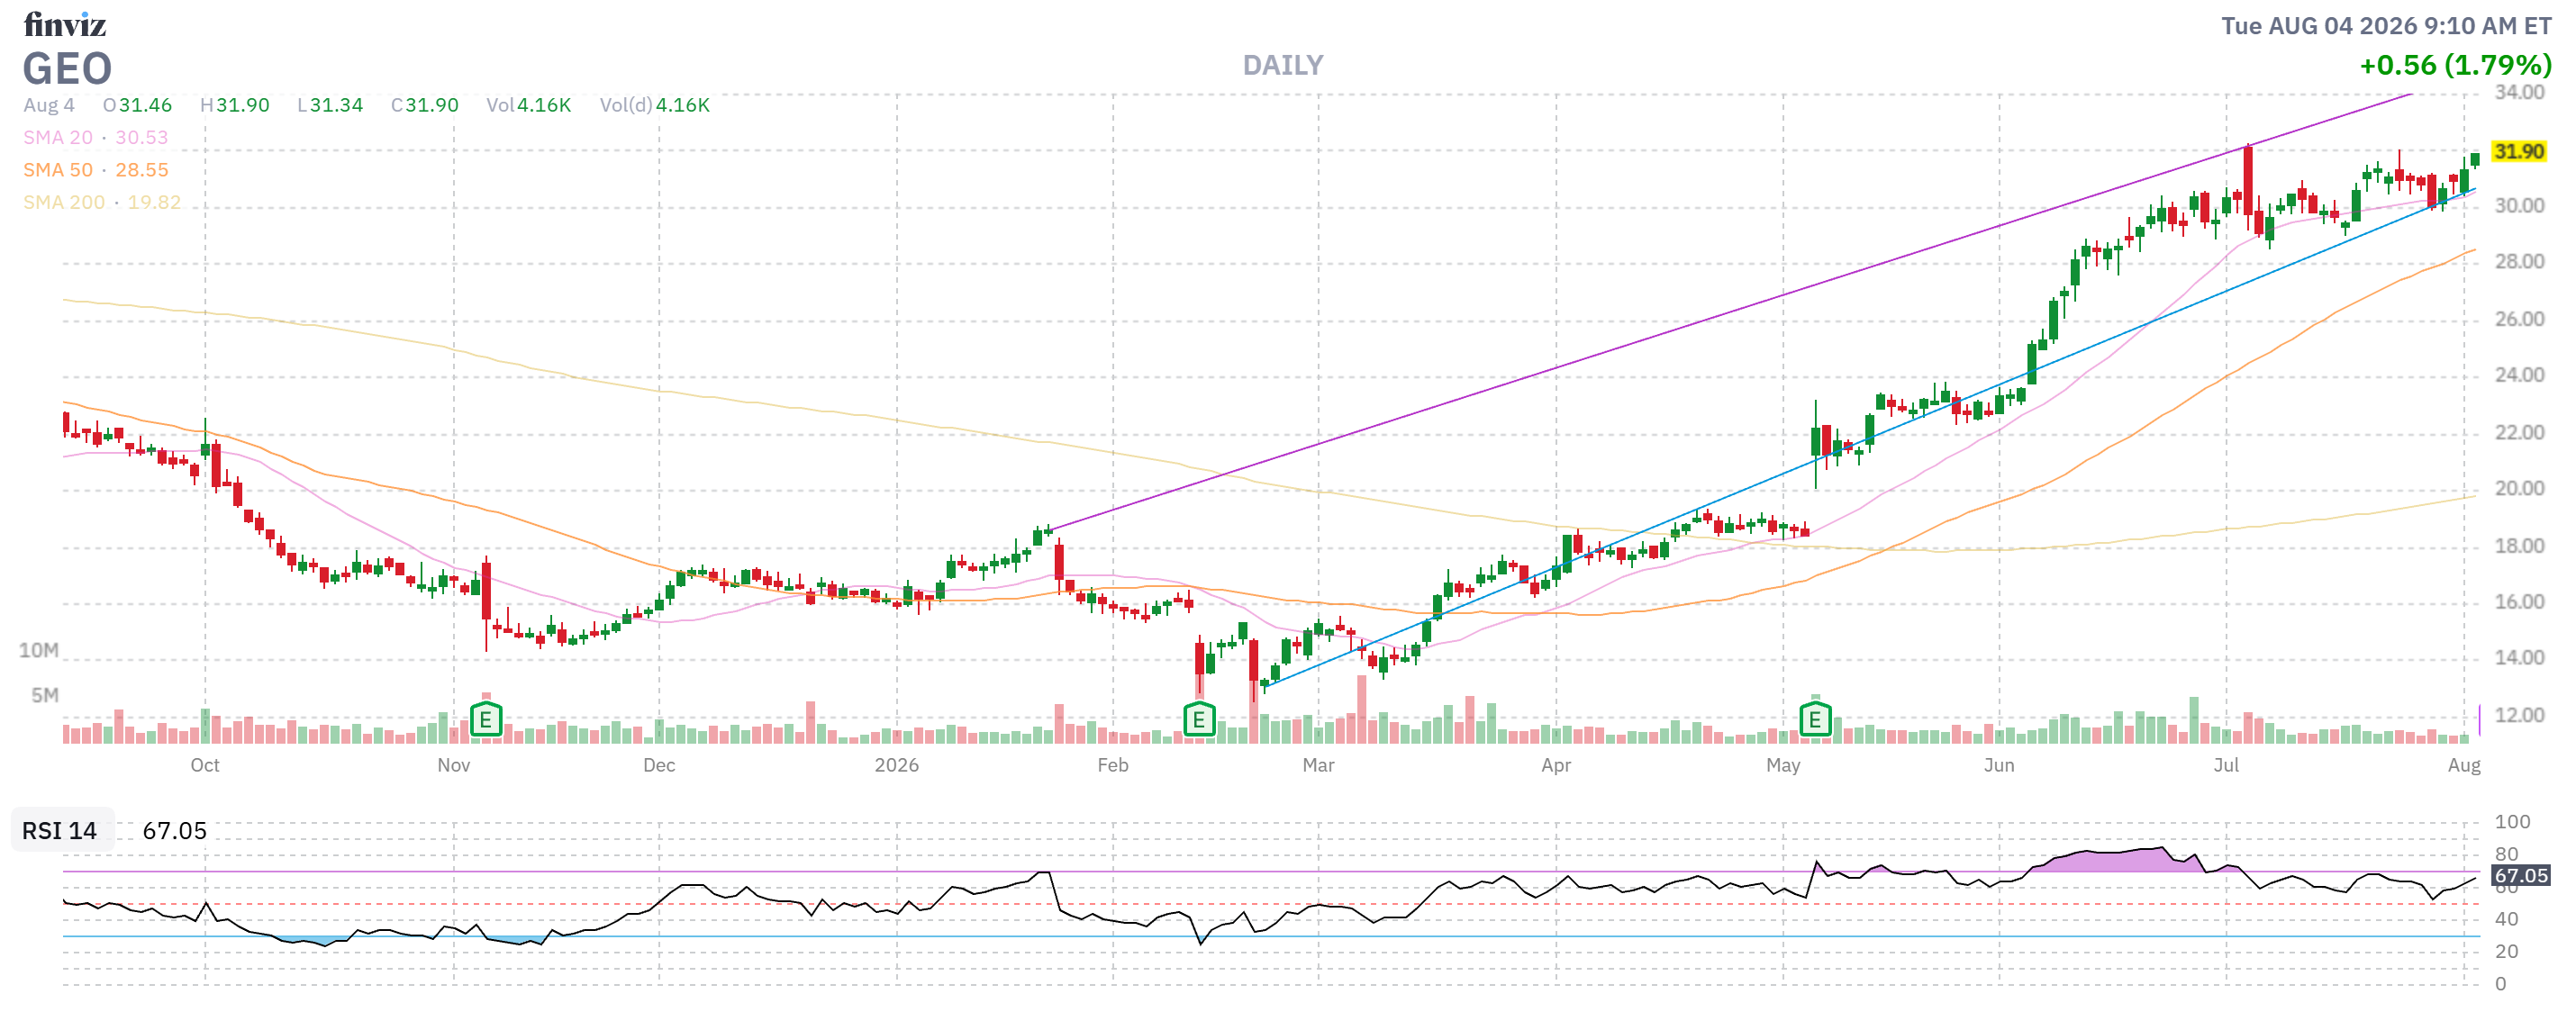
- GEO – Blew past our goal and now net $11,625 on the $12,000 spread but the short calls are Sept and we can roll them ($12,525) to the Jan $26 calls at $7.60 ($11,400), spending $1,125 to buy $4,500 in position. That’s $3,375 (29%) more upside over the next 164 days but there’s some risk – so I think we’re going to take this one off the table.
Remember – we WANT to cash out so anything marginal gets cashed.
-
- B – Net $14,026 on the $15,000+ spread means it’s all about the income and we sold $6,300 of short Jan calls last week – call it 6 months. So 2 more of those is $12,600 and THAT is 89% of $14,026 AND we have more than $1,000 of upside so this trade is going to be good for more than 100% and we love B so – keeper! Call it $14,000 of upside potential here.
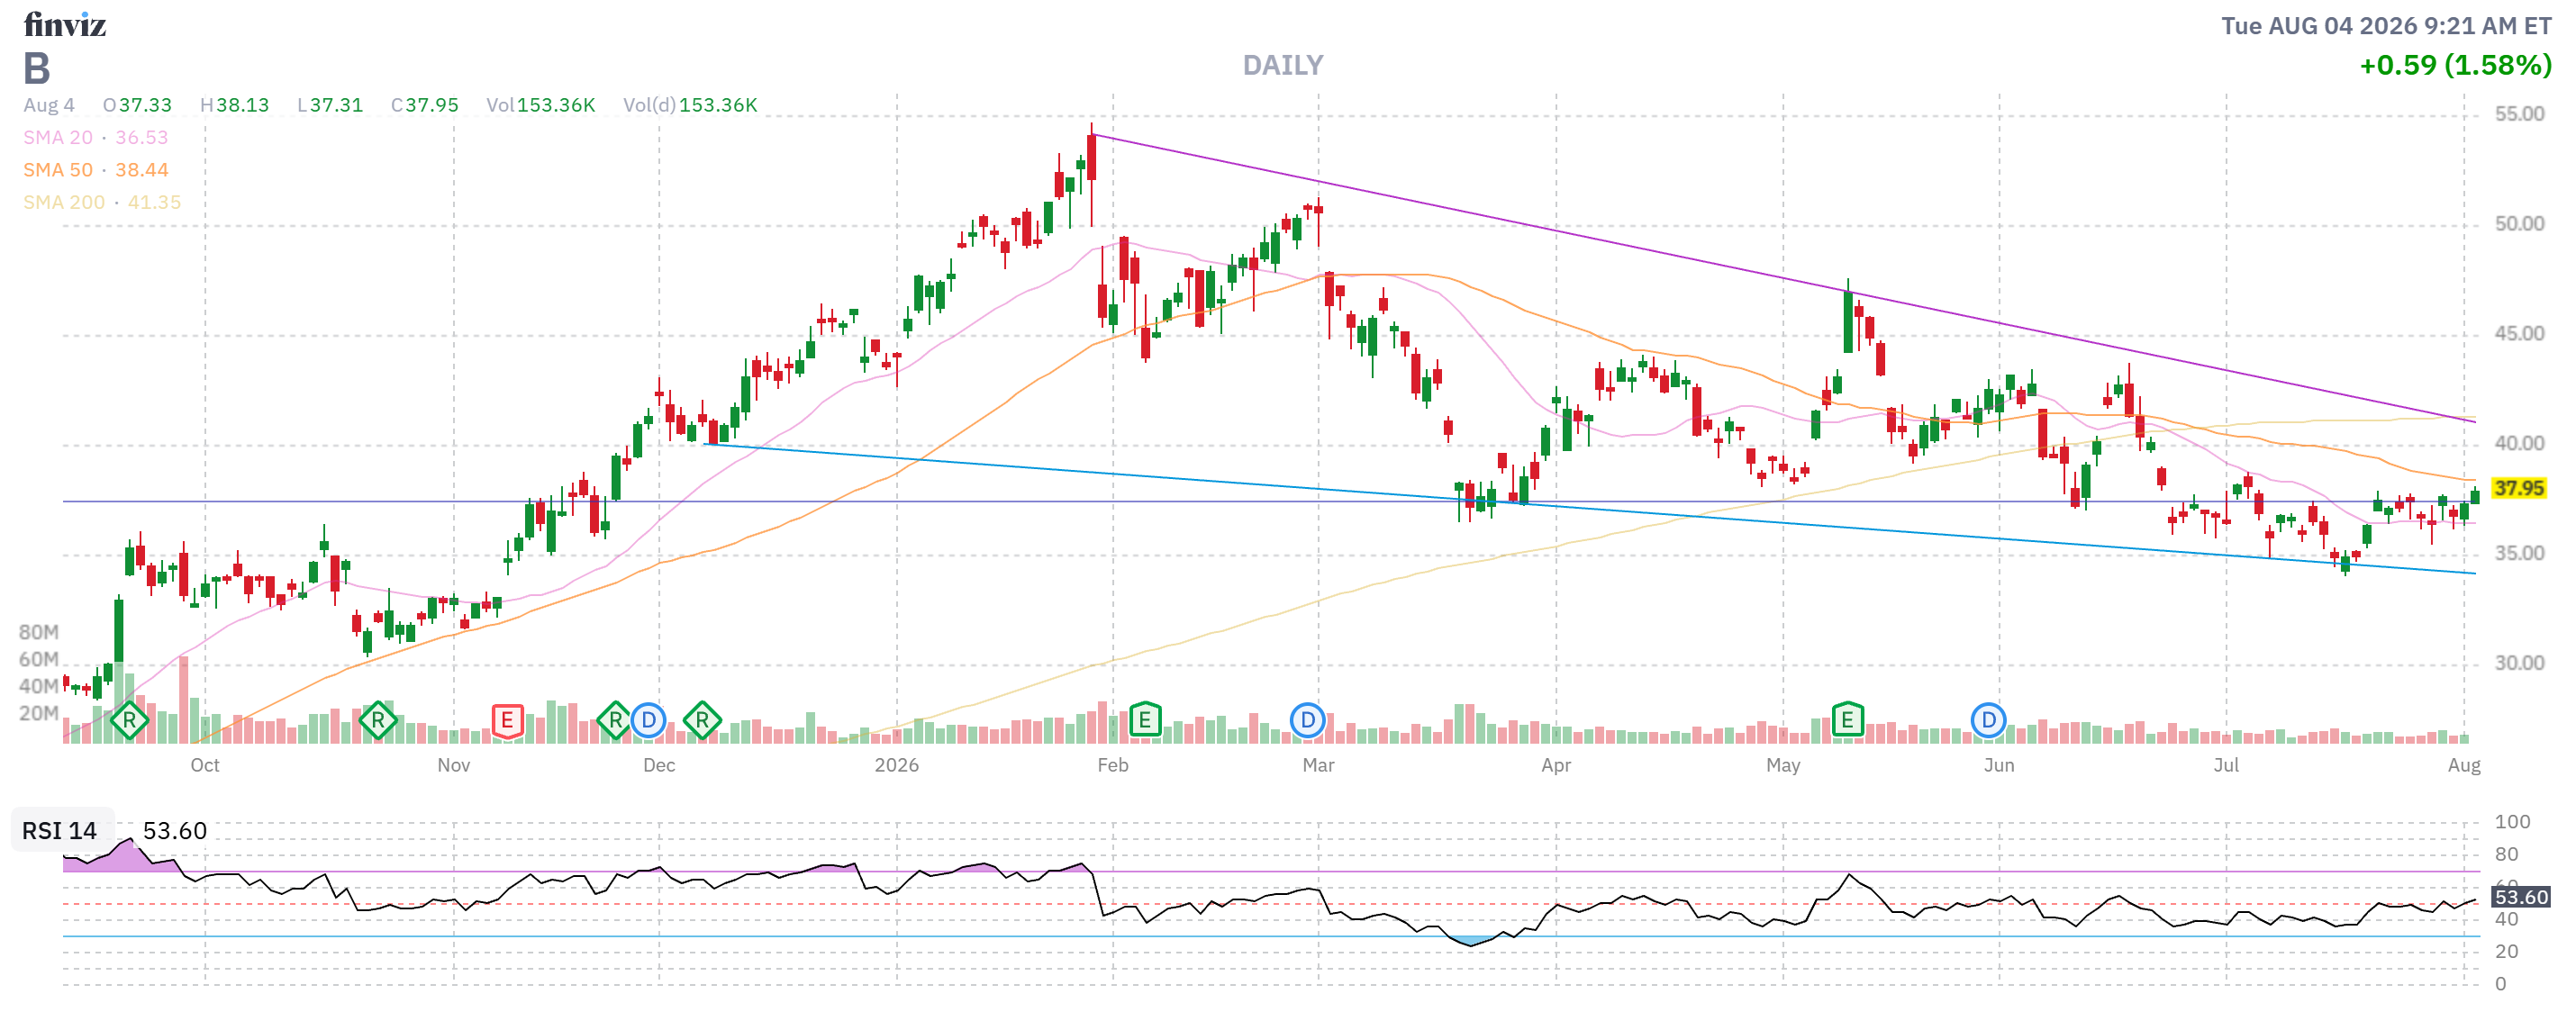
Other factors are B is one of my favorite stocks, still undervalued and I know it like the back of my hand so we may find an opportunity to adjust the trade over time and make it bigger and better – tat factors into my thinking as well whereas GEO – on the other hand – is no longer the bargain we started with so why tie up the money?
-
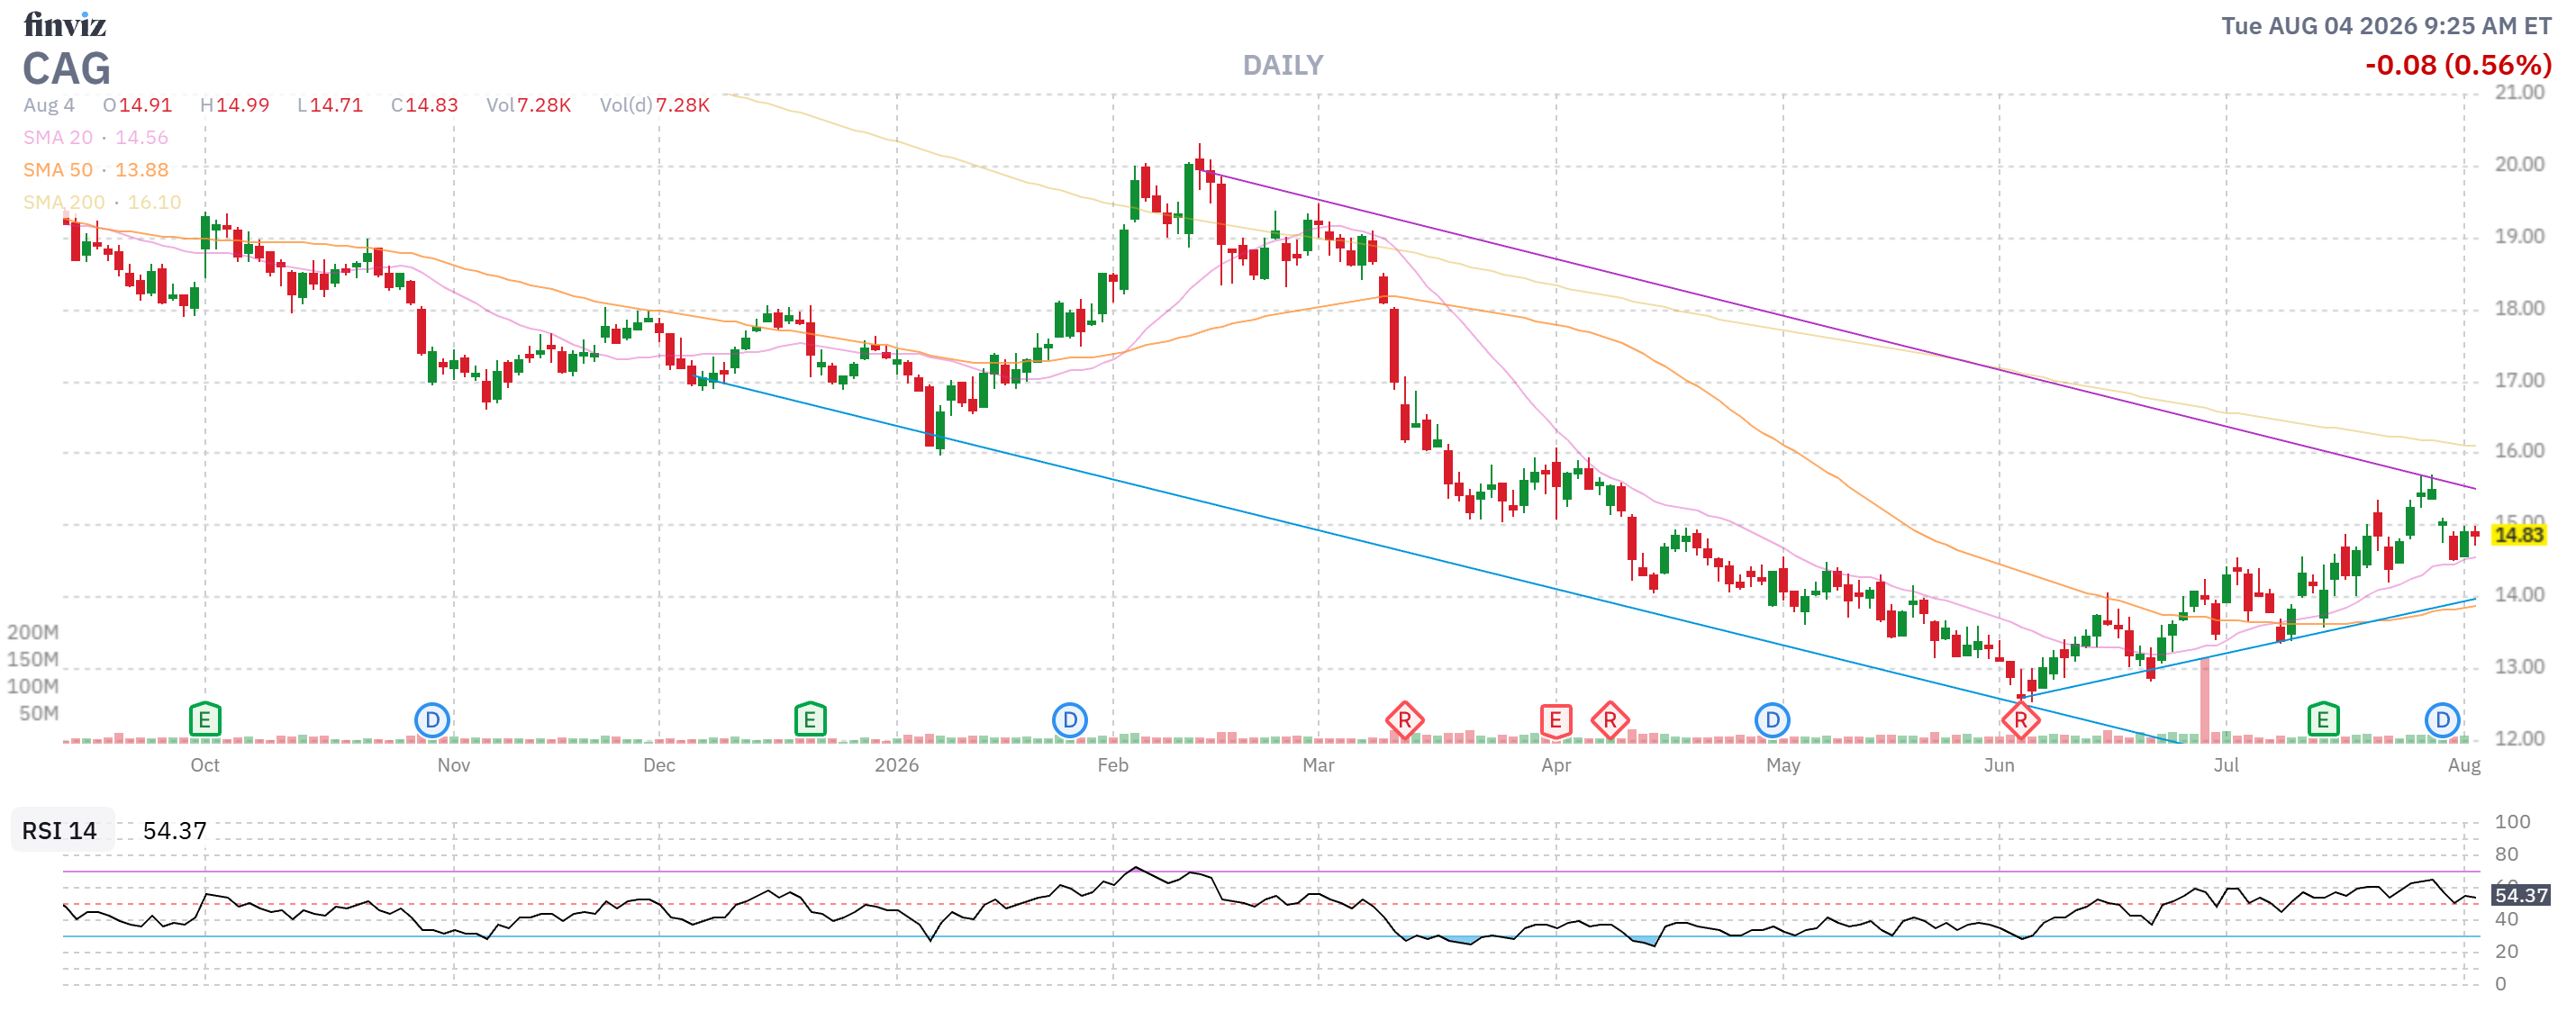
- CAG – Net $2,550 on the $6,000 spread is better than we started with with $3,450 (135%) of upside potential AND we had good earnings (as we expected!) – so the risk is now much lower. Good for a New Trade!
-
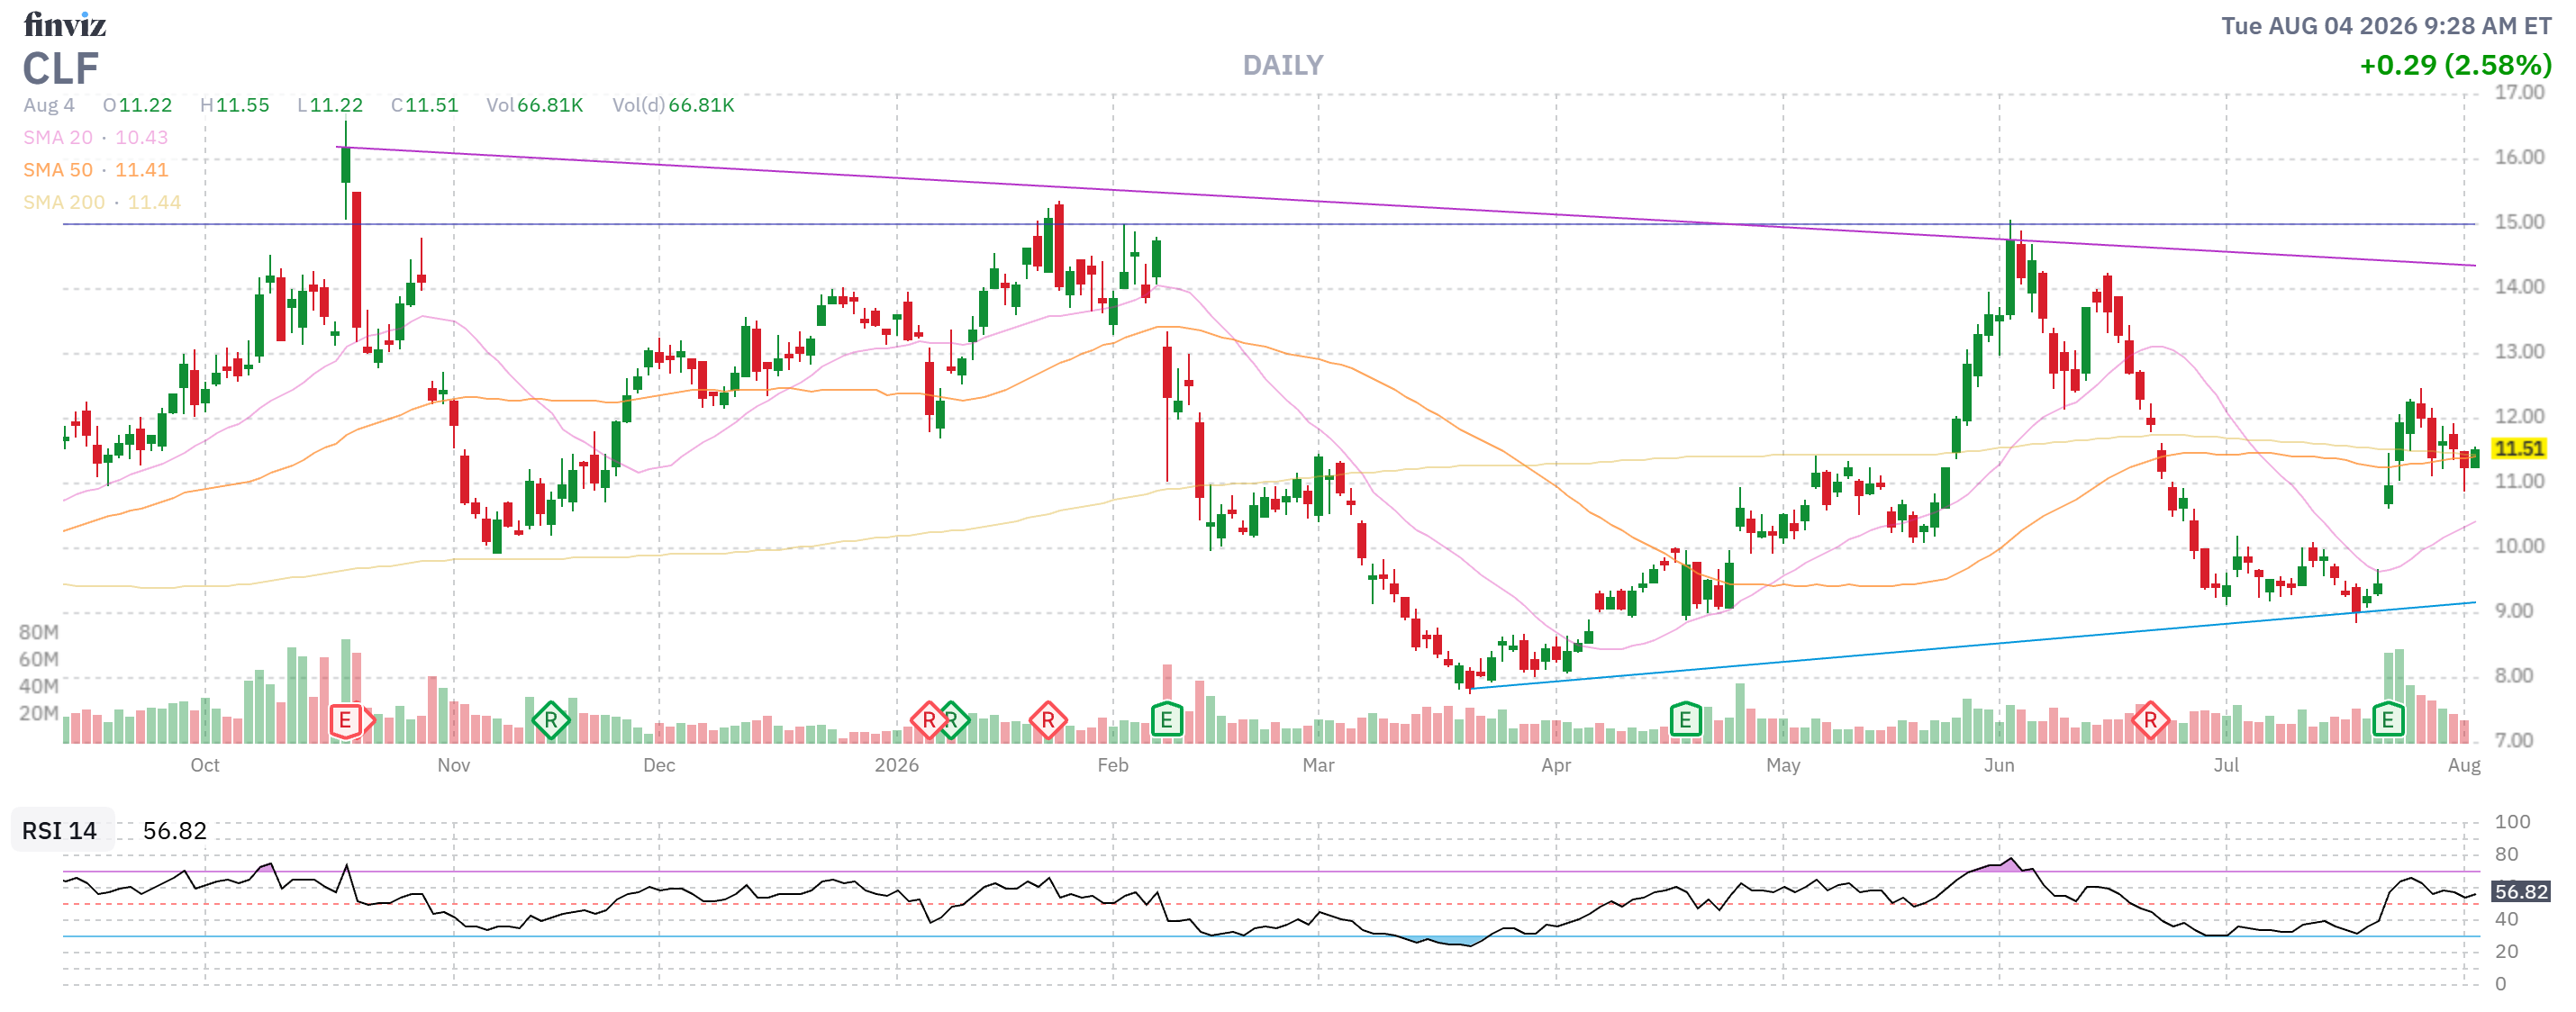
- CLF – No longer underperforming at net $1,787 on the $3,000 spread with $1,213 (67%) upside potential and I’d say another $10,000 in premium sales potential – that’s where the money is! Call it $11,213 in total upside potential.
-
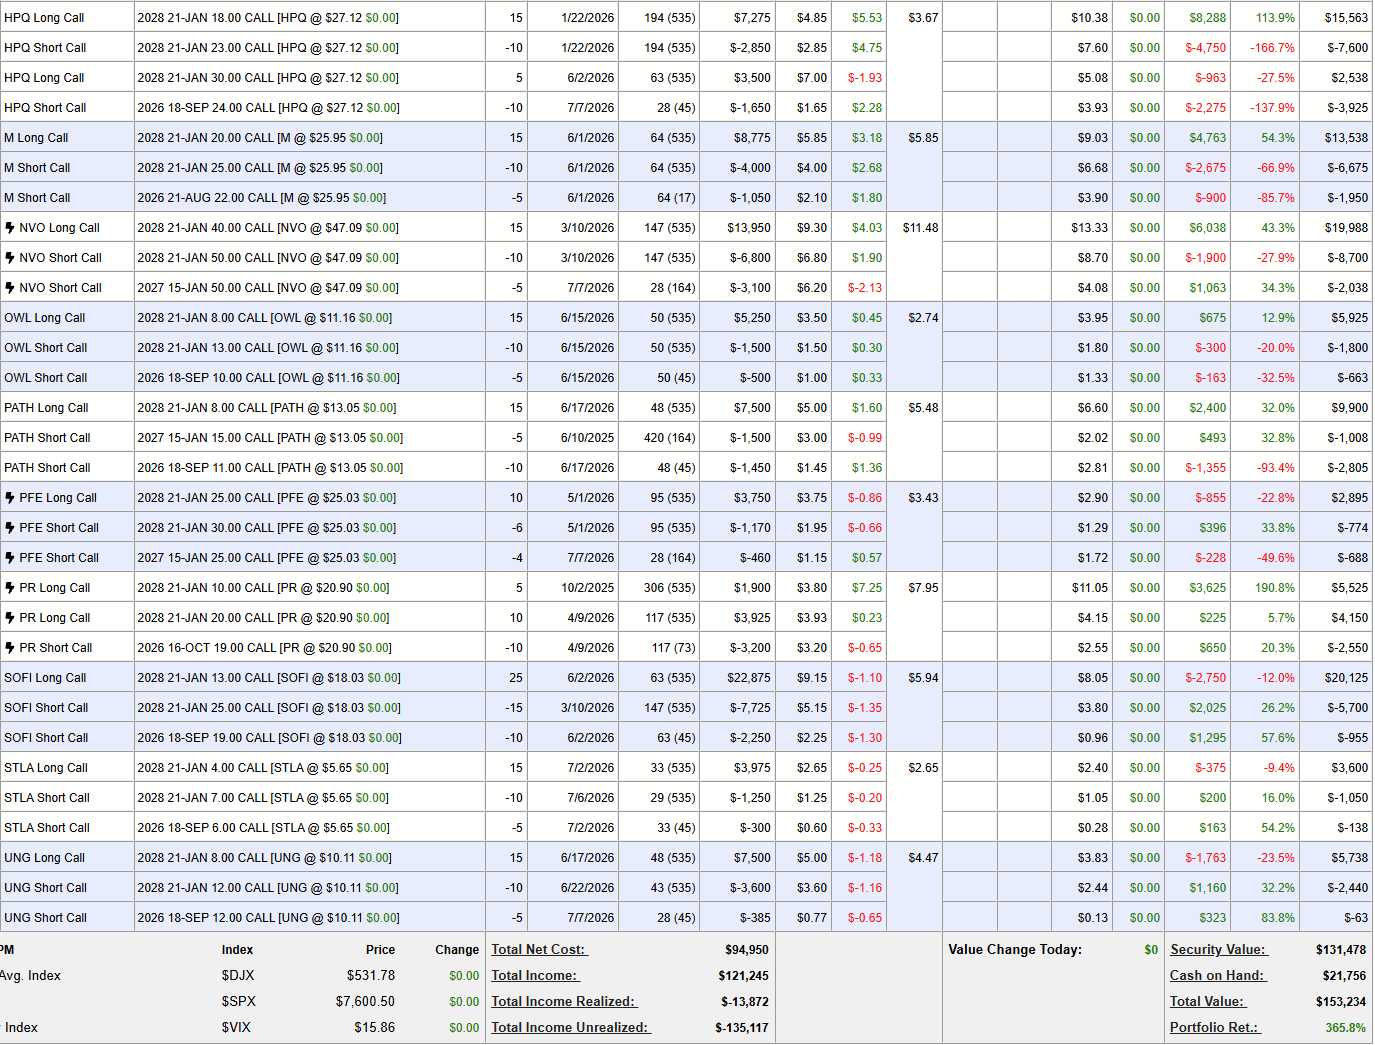
- HPQ I – Net $6,020 on the $8,000 spread but we sold $2,100 for 6 months so let’s call it $6,000 (100%) upside potential on a spread I’m highly confident in (that has already paid us over $4,000!
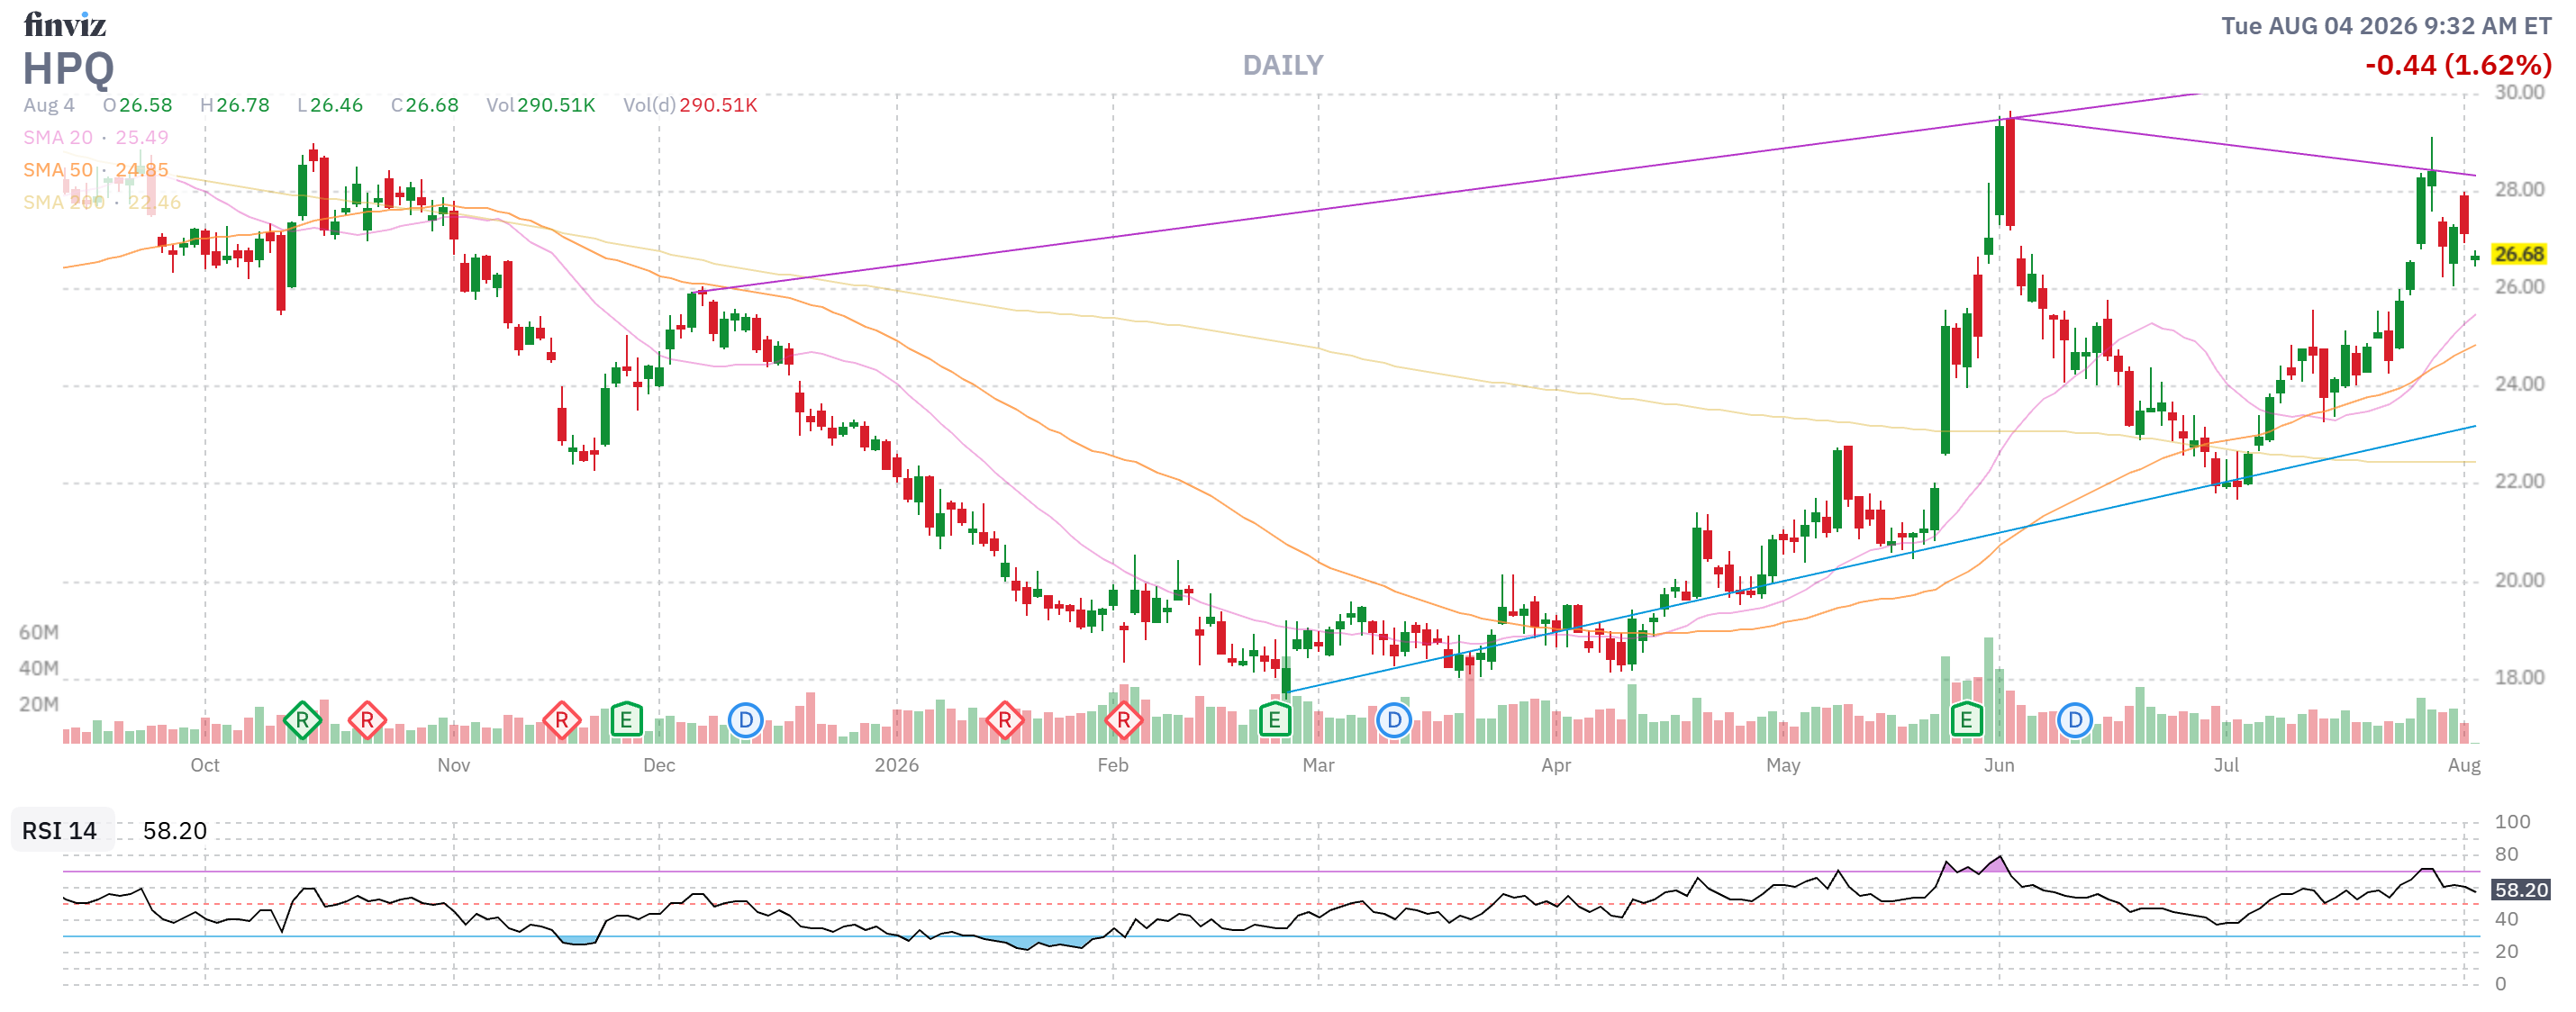
Who says we don’t play tech?!?
-
- HPQ II – See, we liked it so much we played it twice! Here we are at net $1,500 on the $7,500 spread so there’s $6,000 (400%) of upside potential PLUS at least 5 more sales of $1,650 in premium is $8,250 (550%) so let’s call it $14,250 (950%) upside potential and that is certainly Good for a New Trade!
I suppose, logically, we should double up HPQII and cash in HPQI as it’s a more efficient use of capital on the same position (essentially). I will have to think about it…
-
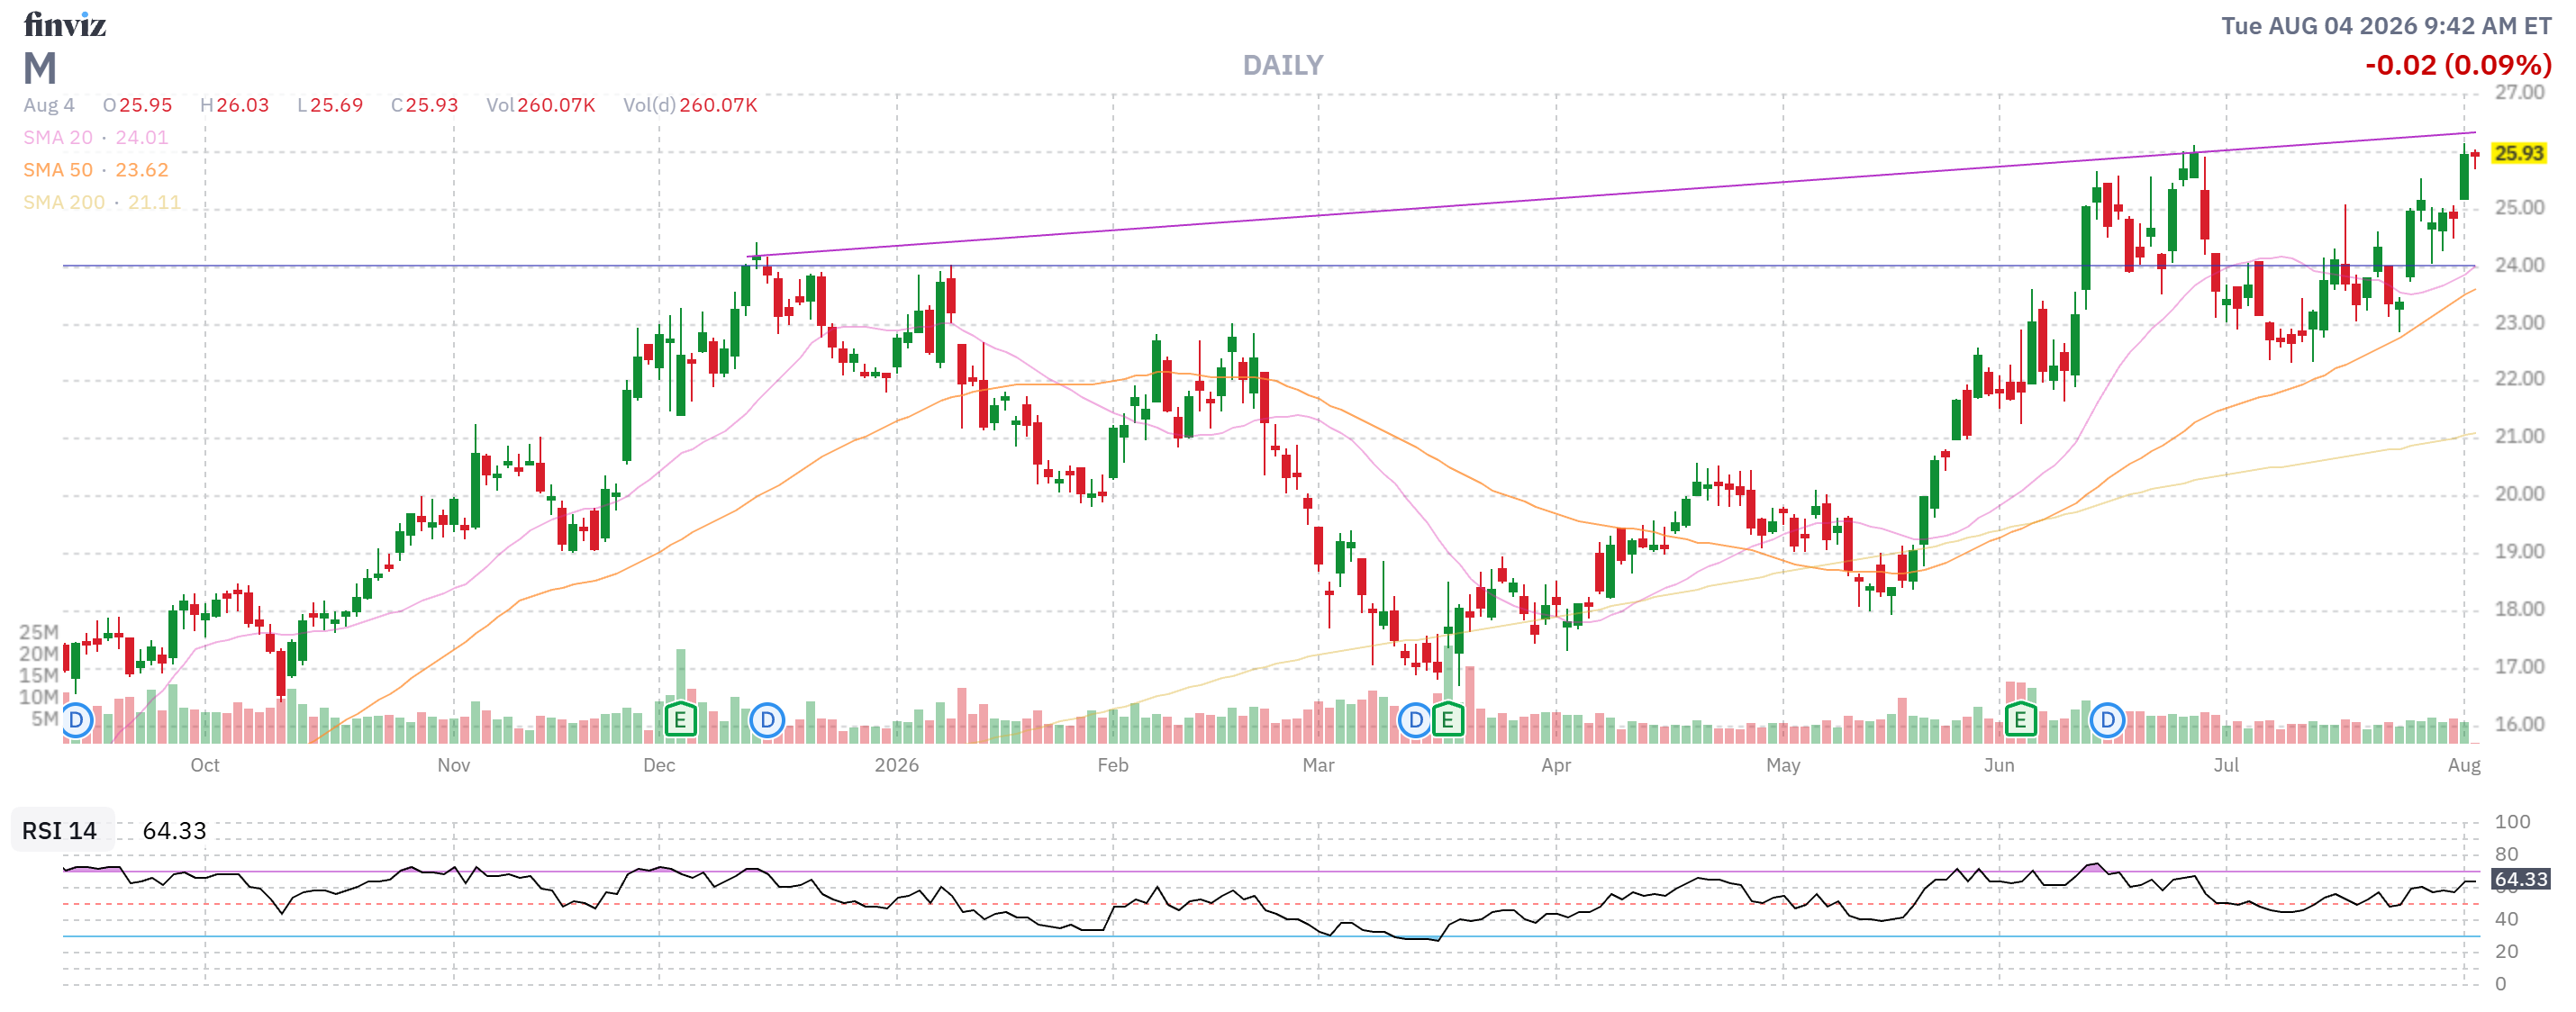
- M – Net $4,913 on the $7,500 spread has $2,587 (52.6%) upside potential PLUS 6 more (at least) chances to sell $1,050 in premium is another $6,300 (128%) so let’s say net net $8,887 (180%) upside potential that I feel VERY confident about so – Good for a New Trade!
-
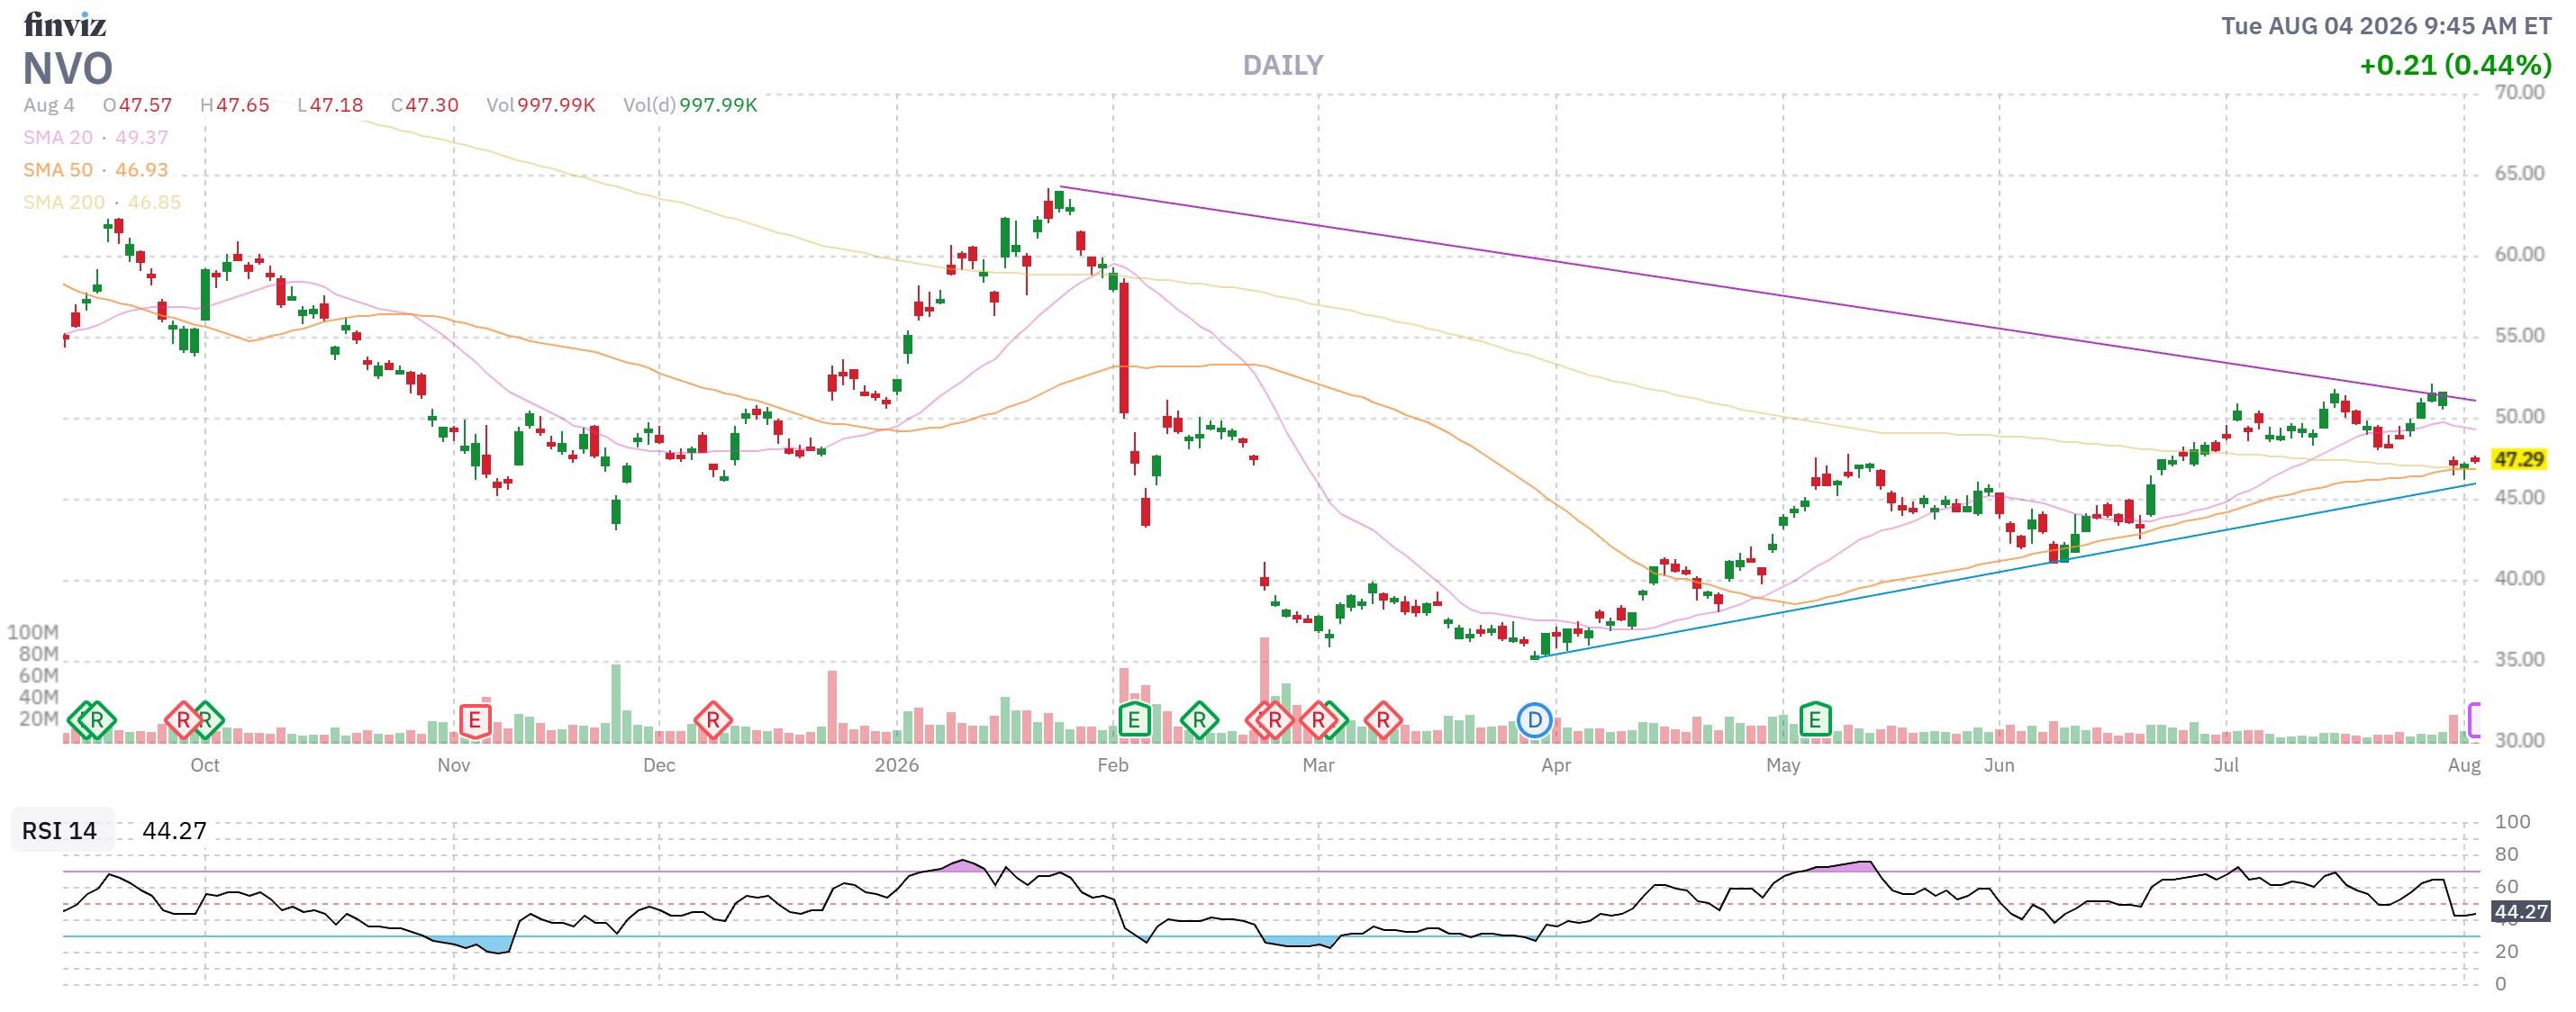
- NVO – Net $9,250 on the $15,000 spread and two more chances to collect $3,000 in premium is $11,750 (127%) in upside potential. Good for a New Trade!
-
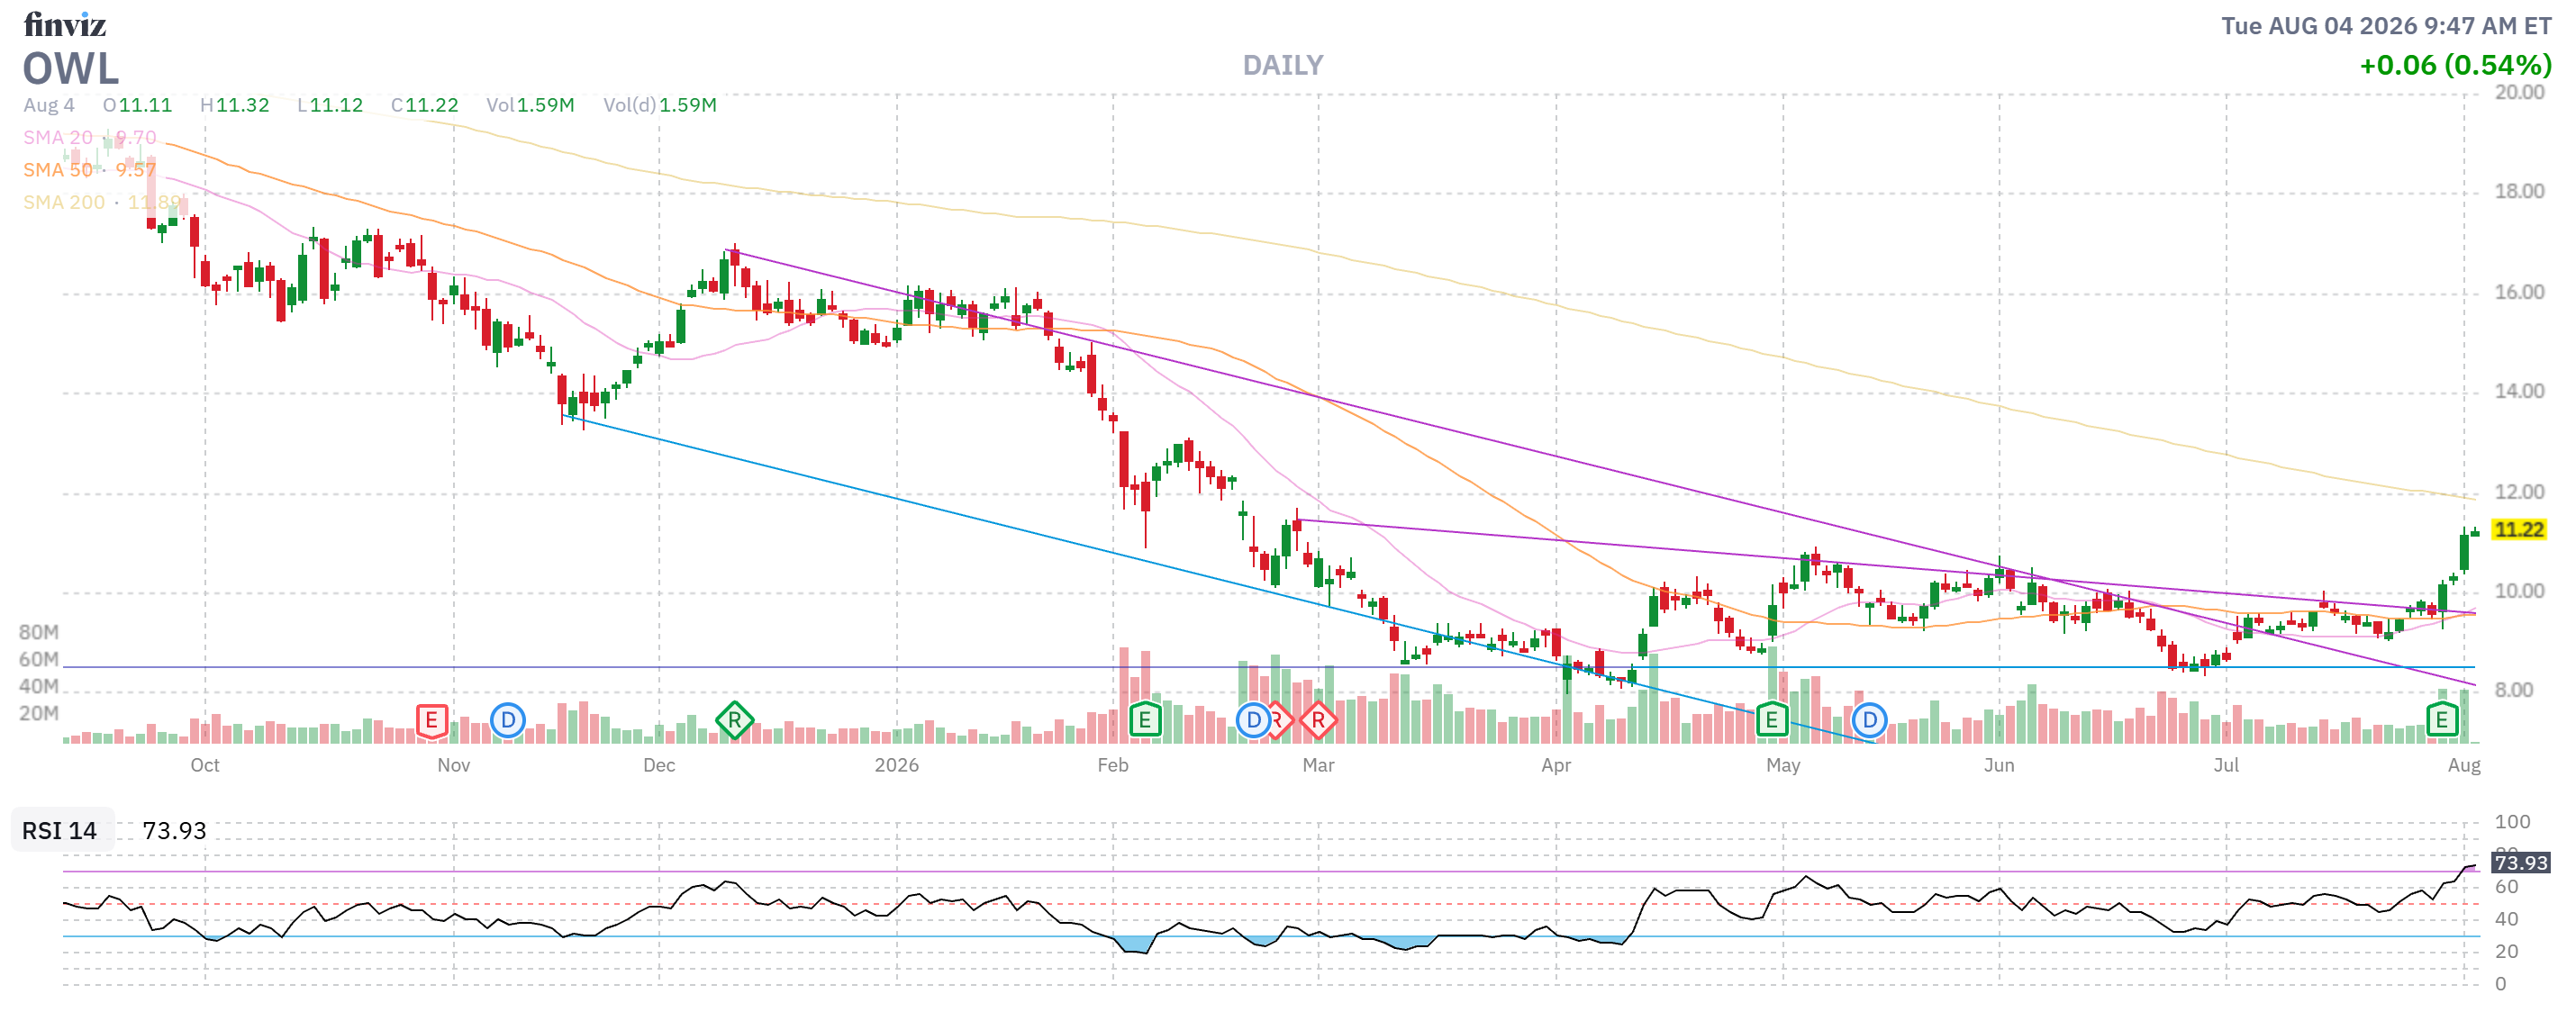
- OWL – A bit of a gamble at net $3,462 on the $7,500 spread but also 5 more chances to sell $500 in premium is $2,500 so $6,538 (188%) upside potential but too risky to say “good for a new trade” on this one. Actually, earnings just crossed and it’s popping – so I feel like a genius!
-
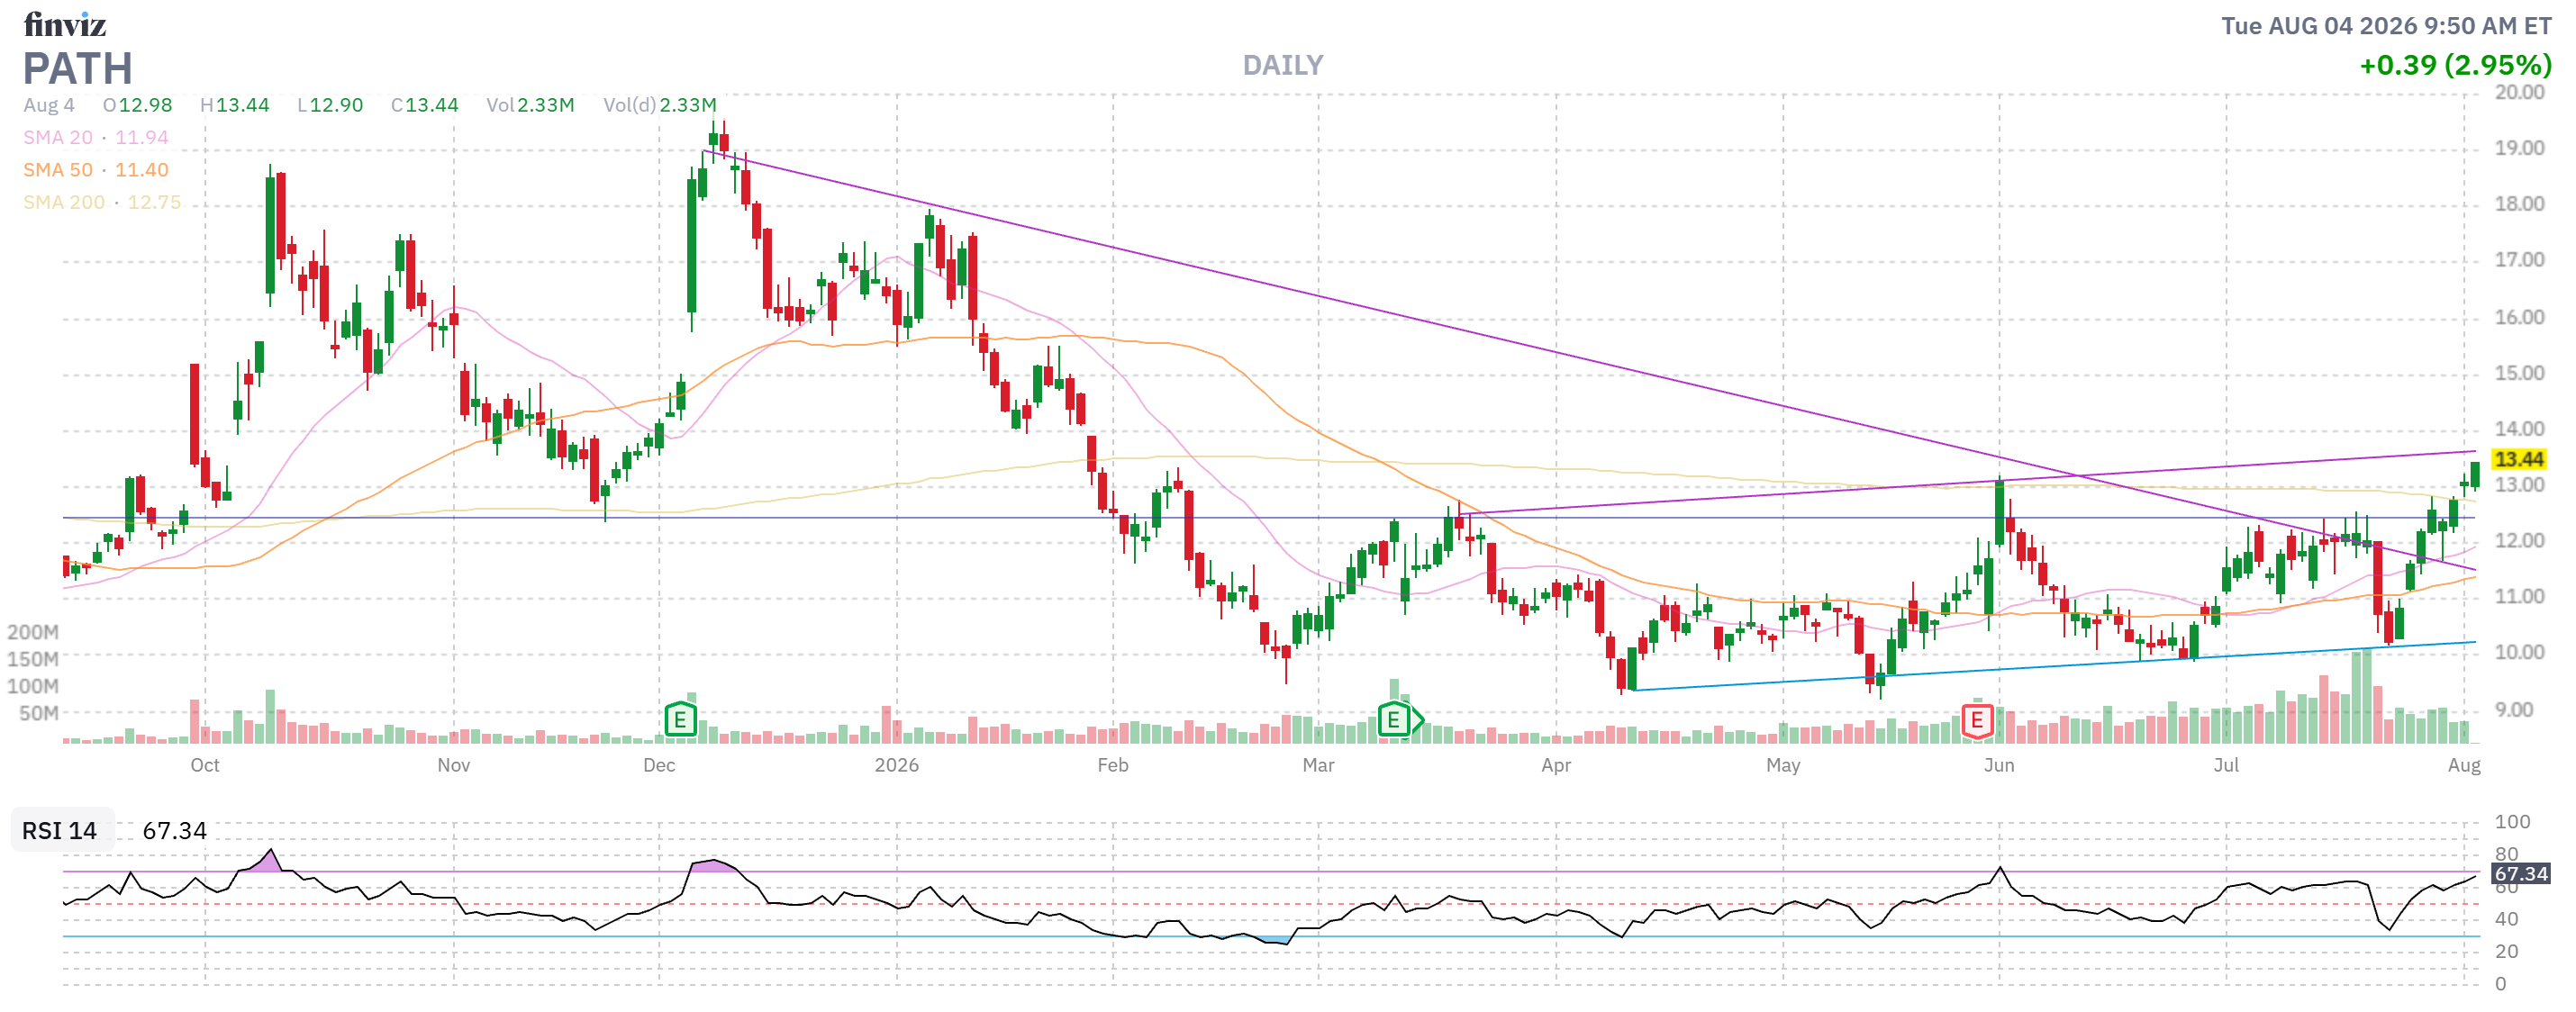
- PATH – Net $6,087 on the $10,500 spread and 5 more chances to sell $1,450 is $11,663 (191%) upside potential but we’re over target this Q so maybe just 4 good rolls. Still a nice trade!
-
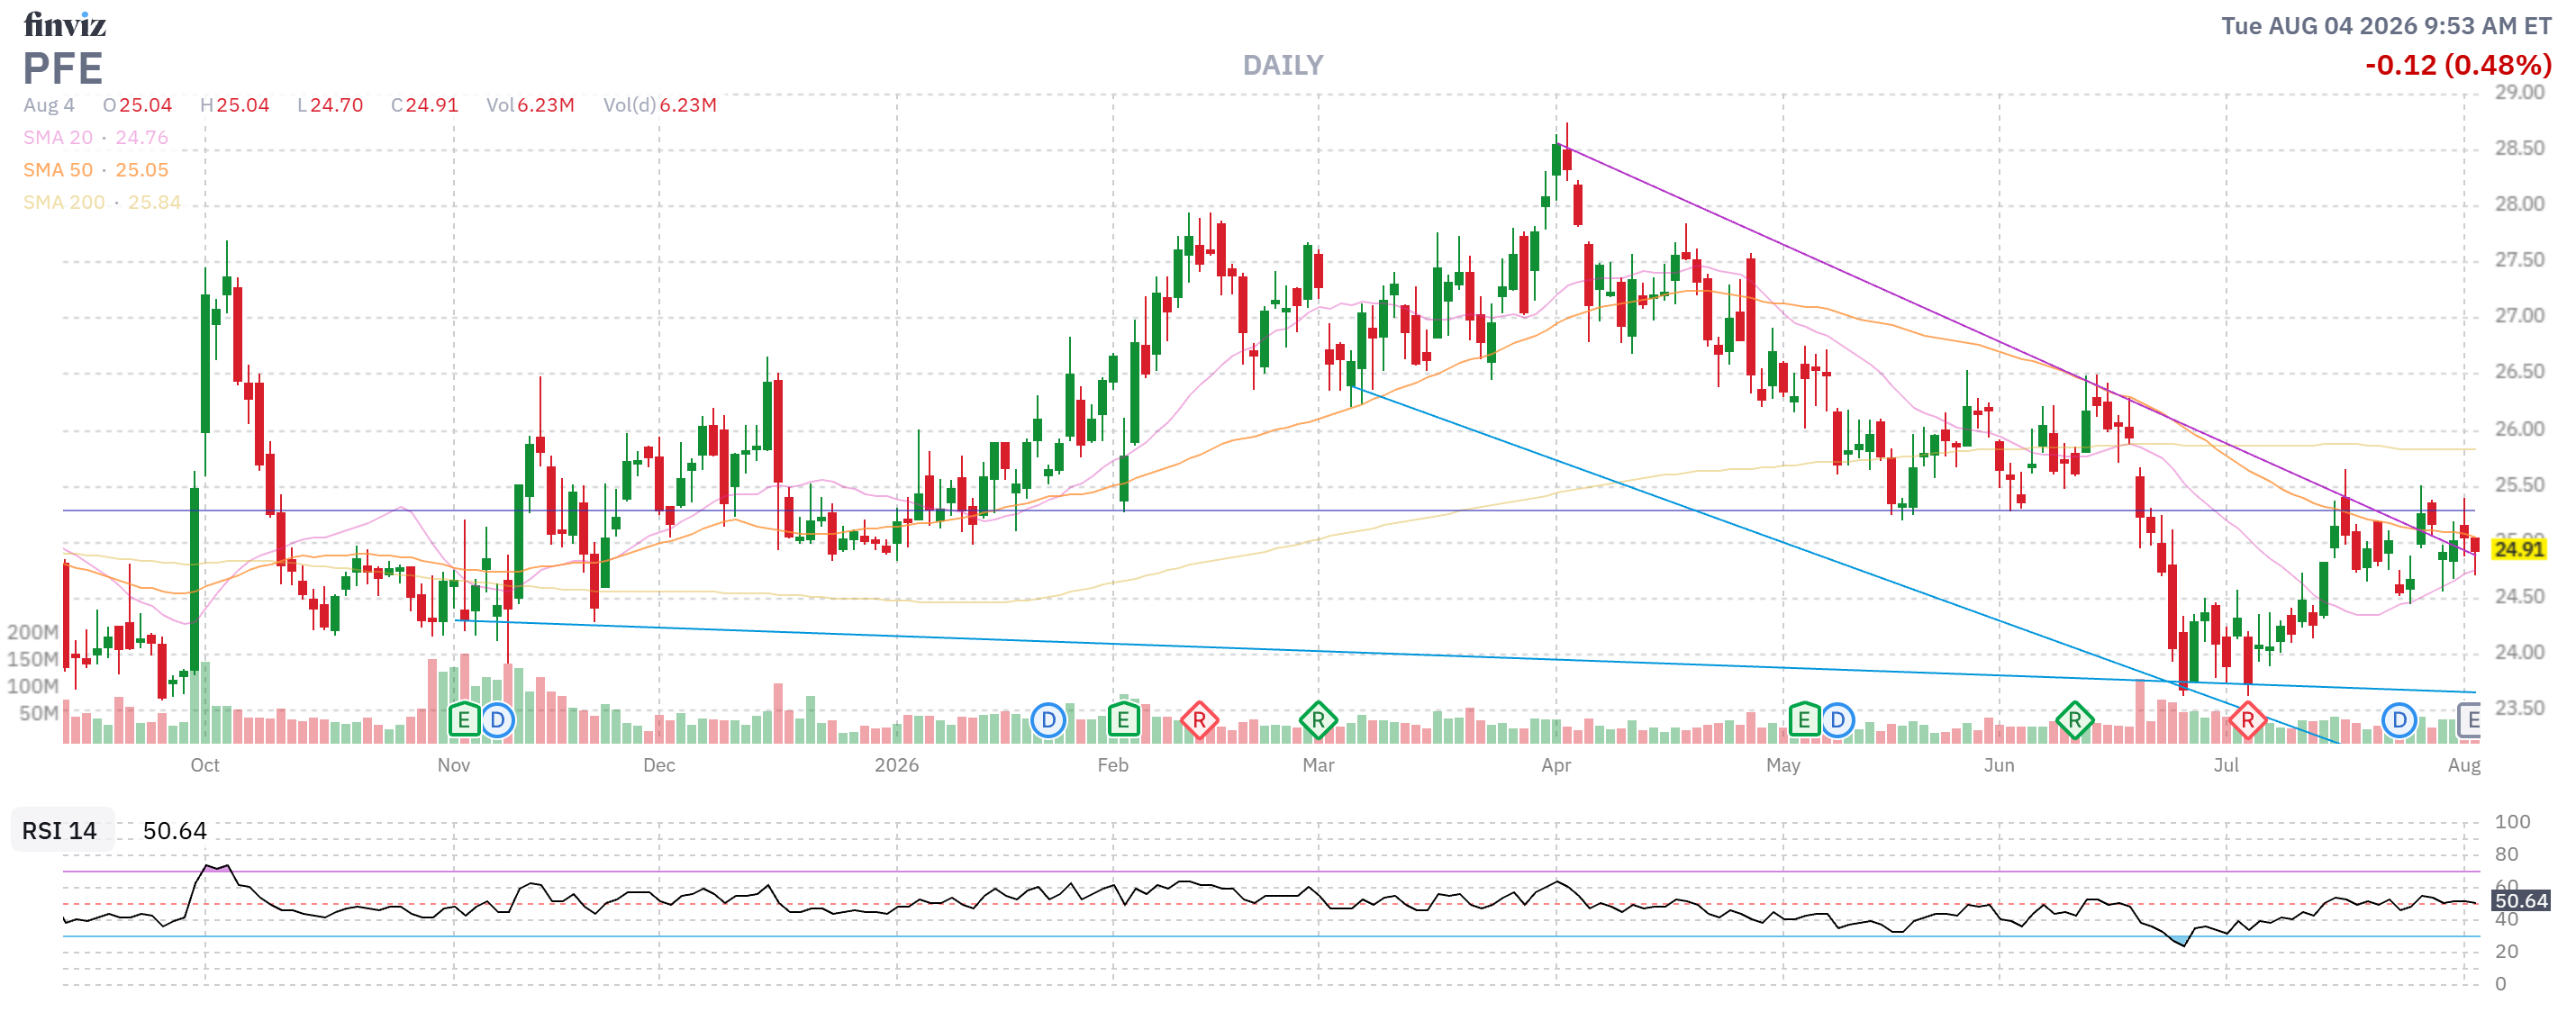
- PFE – It’s right on track so we shouldn’t complain. Net $1,433 on the $5,000 spread PLUS $920 more premium sales is $4,487 (313%) upside potential and THAT is Good for a New Trade!
-
- PR – Let’s cash the 5 long 2028 $10s for $5,525. Now we are net $1,600 on what I’ll call a $5,000 spread (the 2028 $25s are $1.97) and 2 more chances to collect $3,000 in premium sales gives us $9,400 (587%) upside potential so Great for a New Trade!
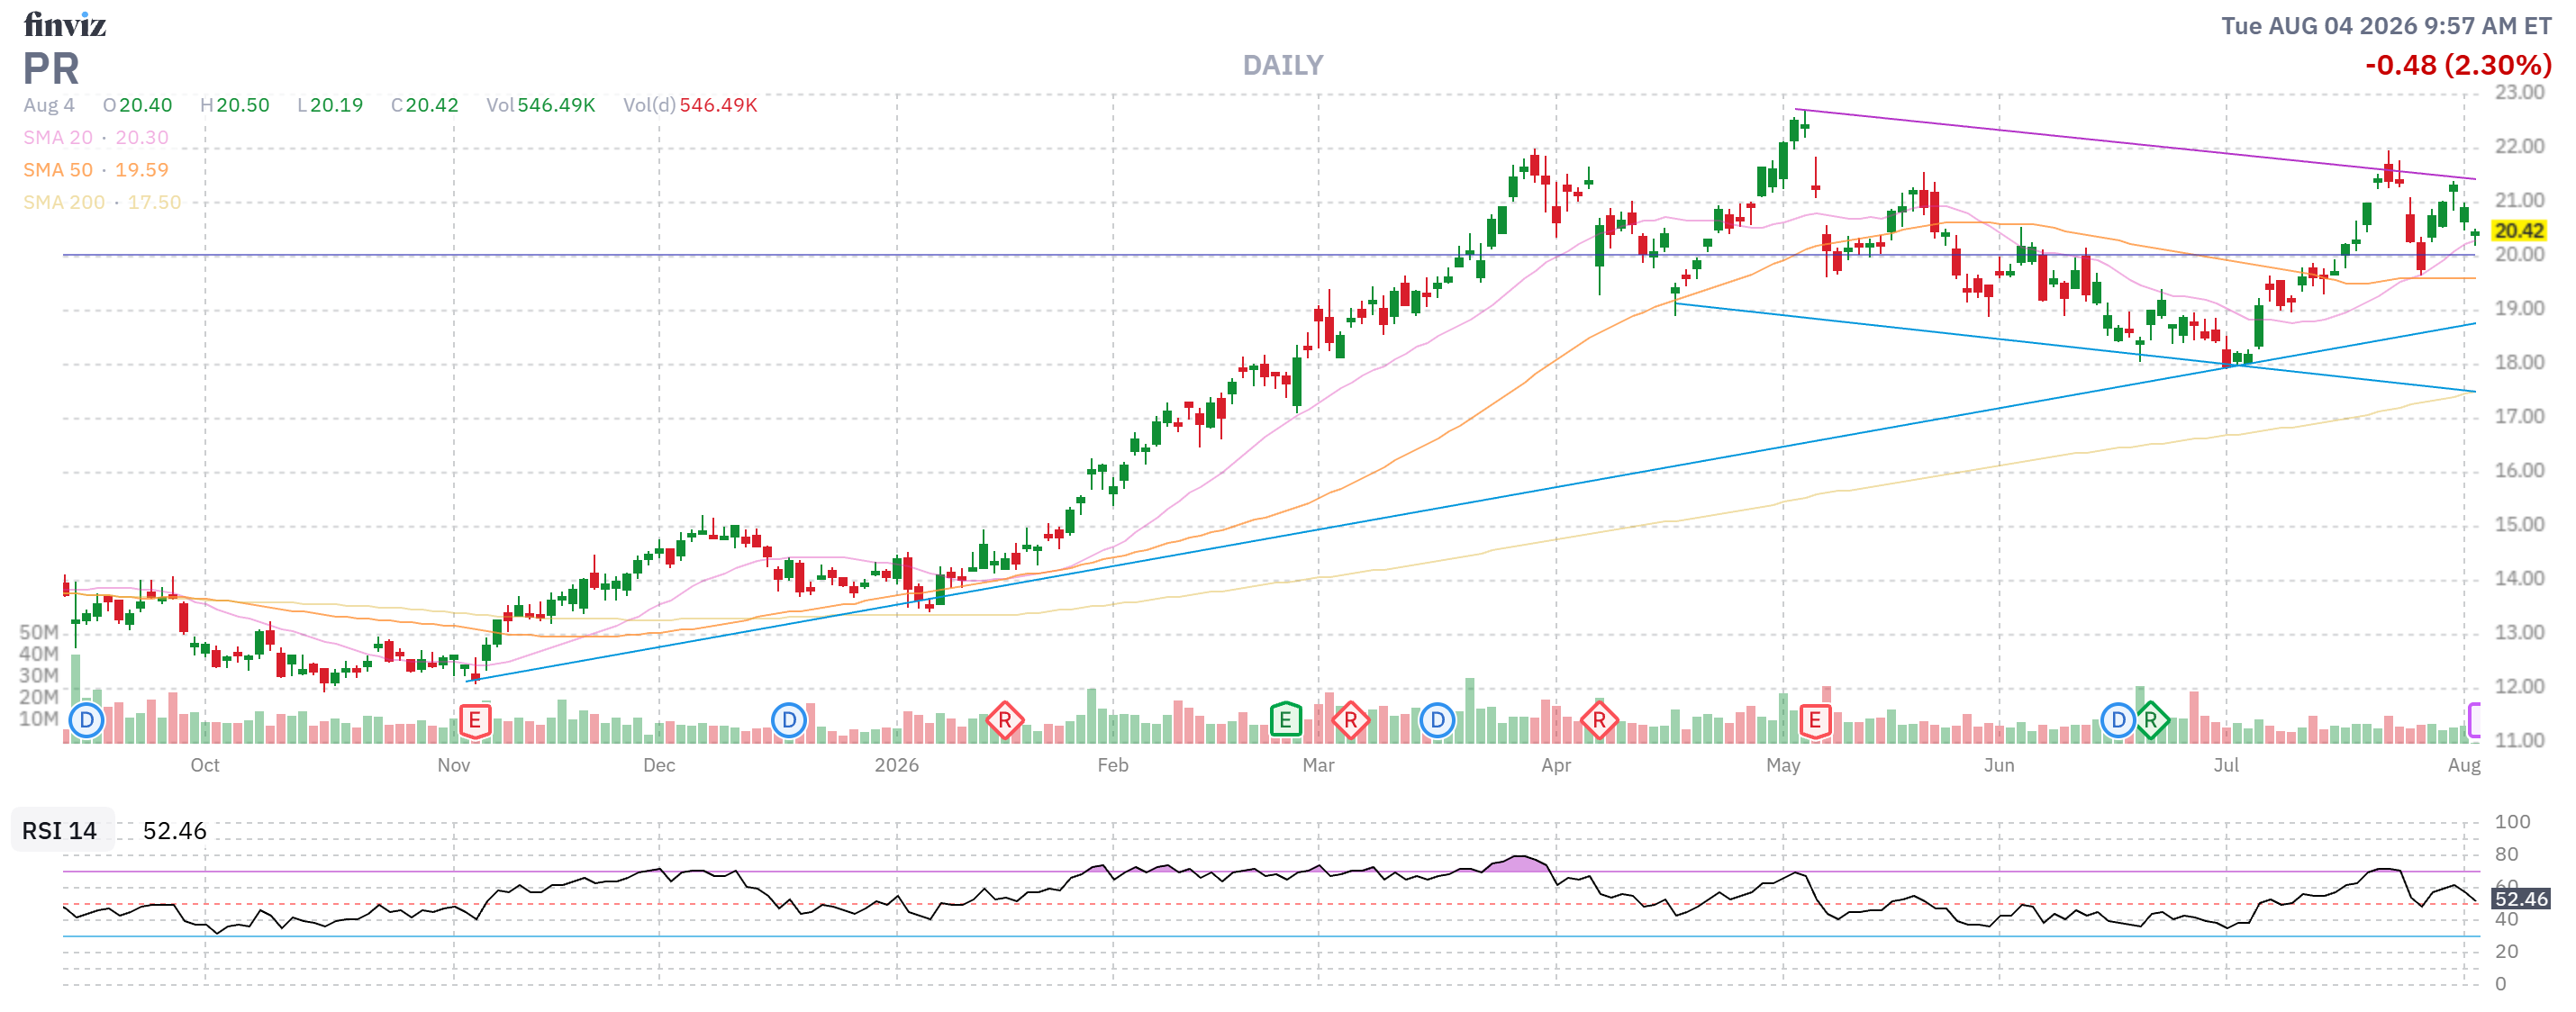
Wow, cashing out $5,525 AND $9,400 on the table from a net $2,625 start – you can see how we make our money! And with NO MARGIN!!! That’s what I love about this portfolio – challenging and rewarding.
-
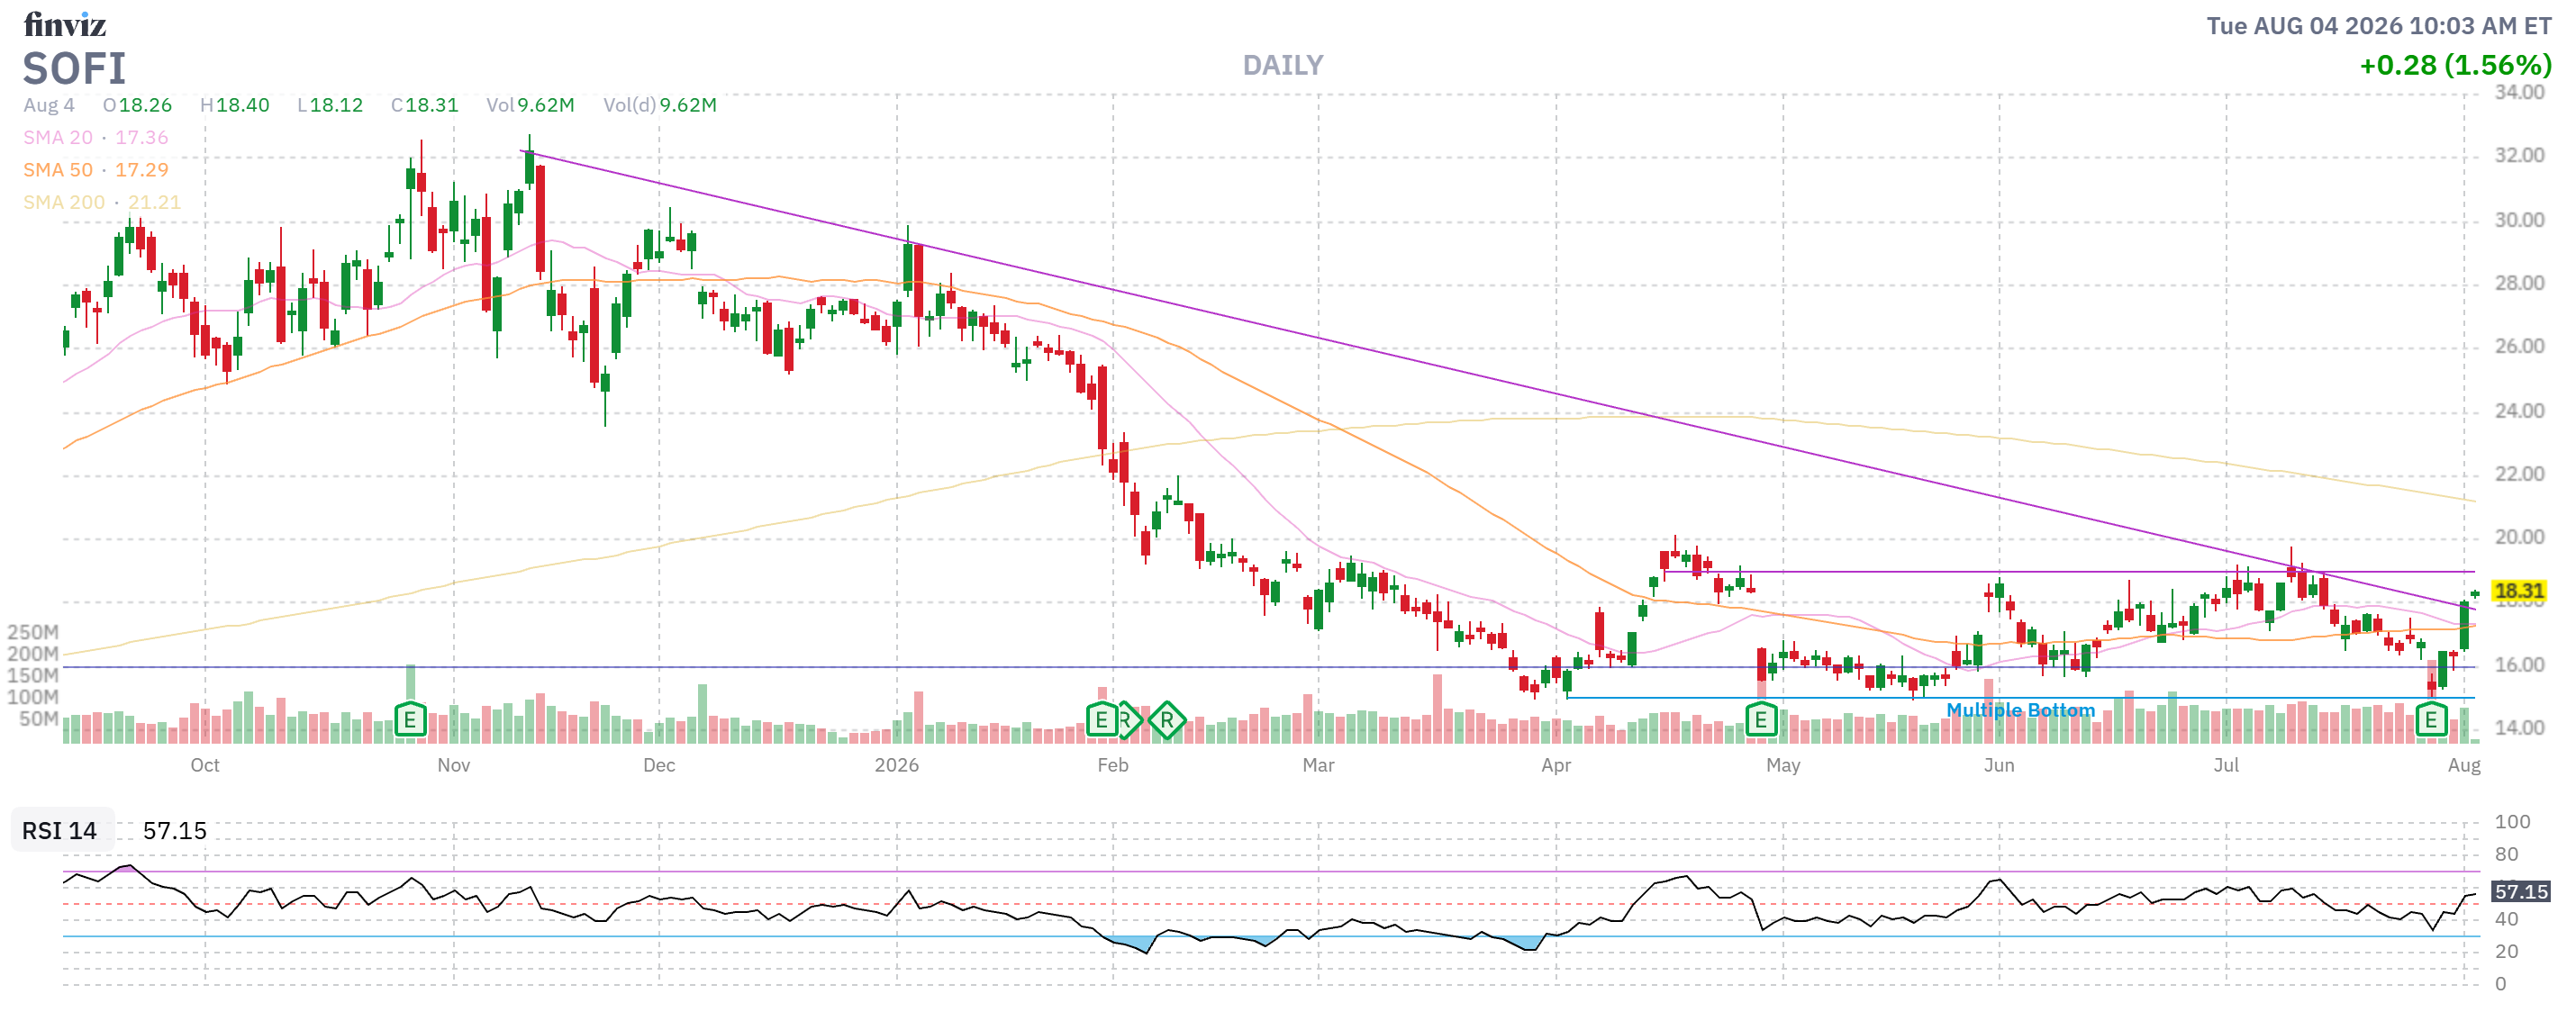
- SOFI – Earnings were good (as expected) and we’re net $13,470 on the $30,000 spread and we sold $2,250 with 5 more chances is $27,780 (206%) of upside potential and I’m feeling good about our target after earnings! Not good for a new trade as it’s concentrated and risky and it would be smaller if we weren’t so far ahead.
-
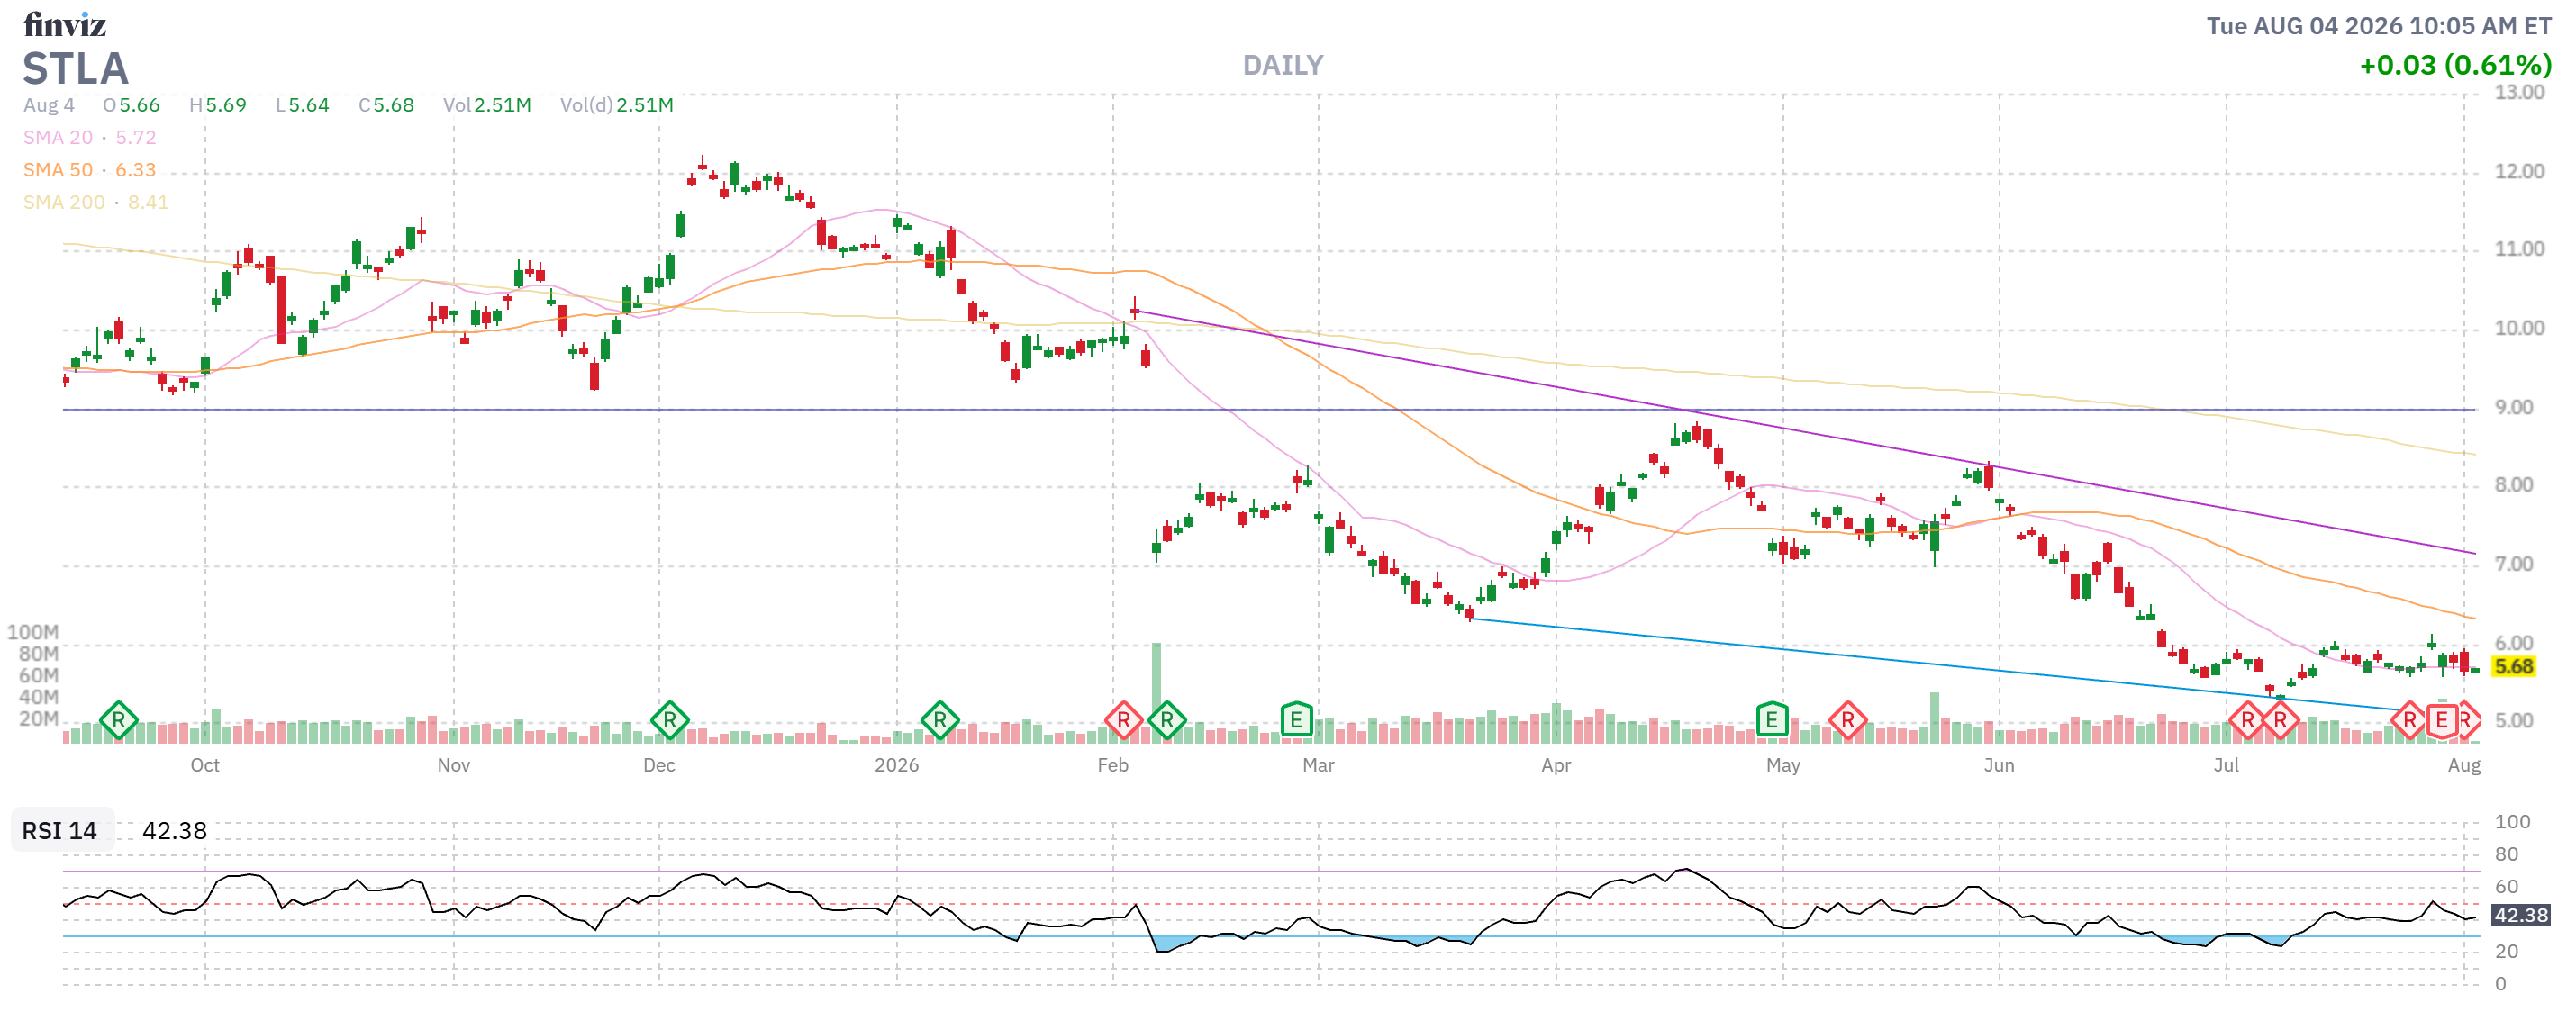
- STLA – Big Miss on earnings but we’re only tying up $2,412 on the $4,500 spread with 6 more chances to sell $300 is $3,888 (161%) upside potential so a keeper, I guess…
-
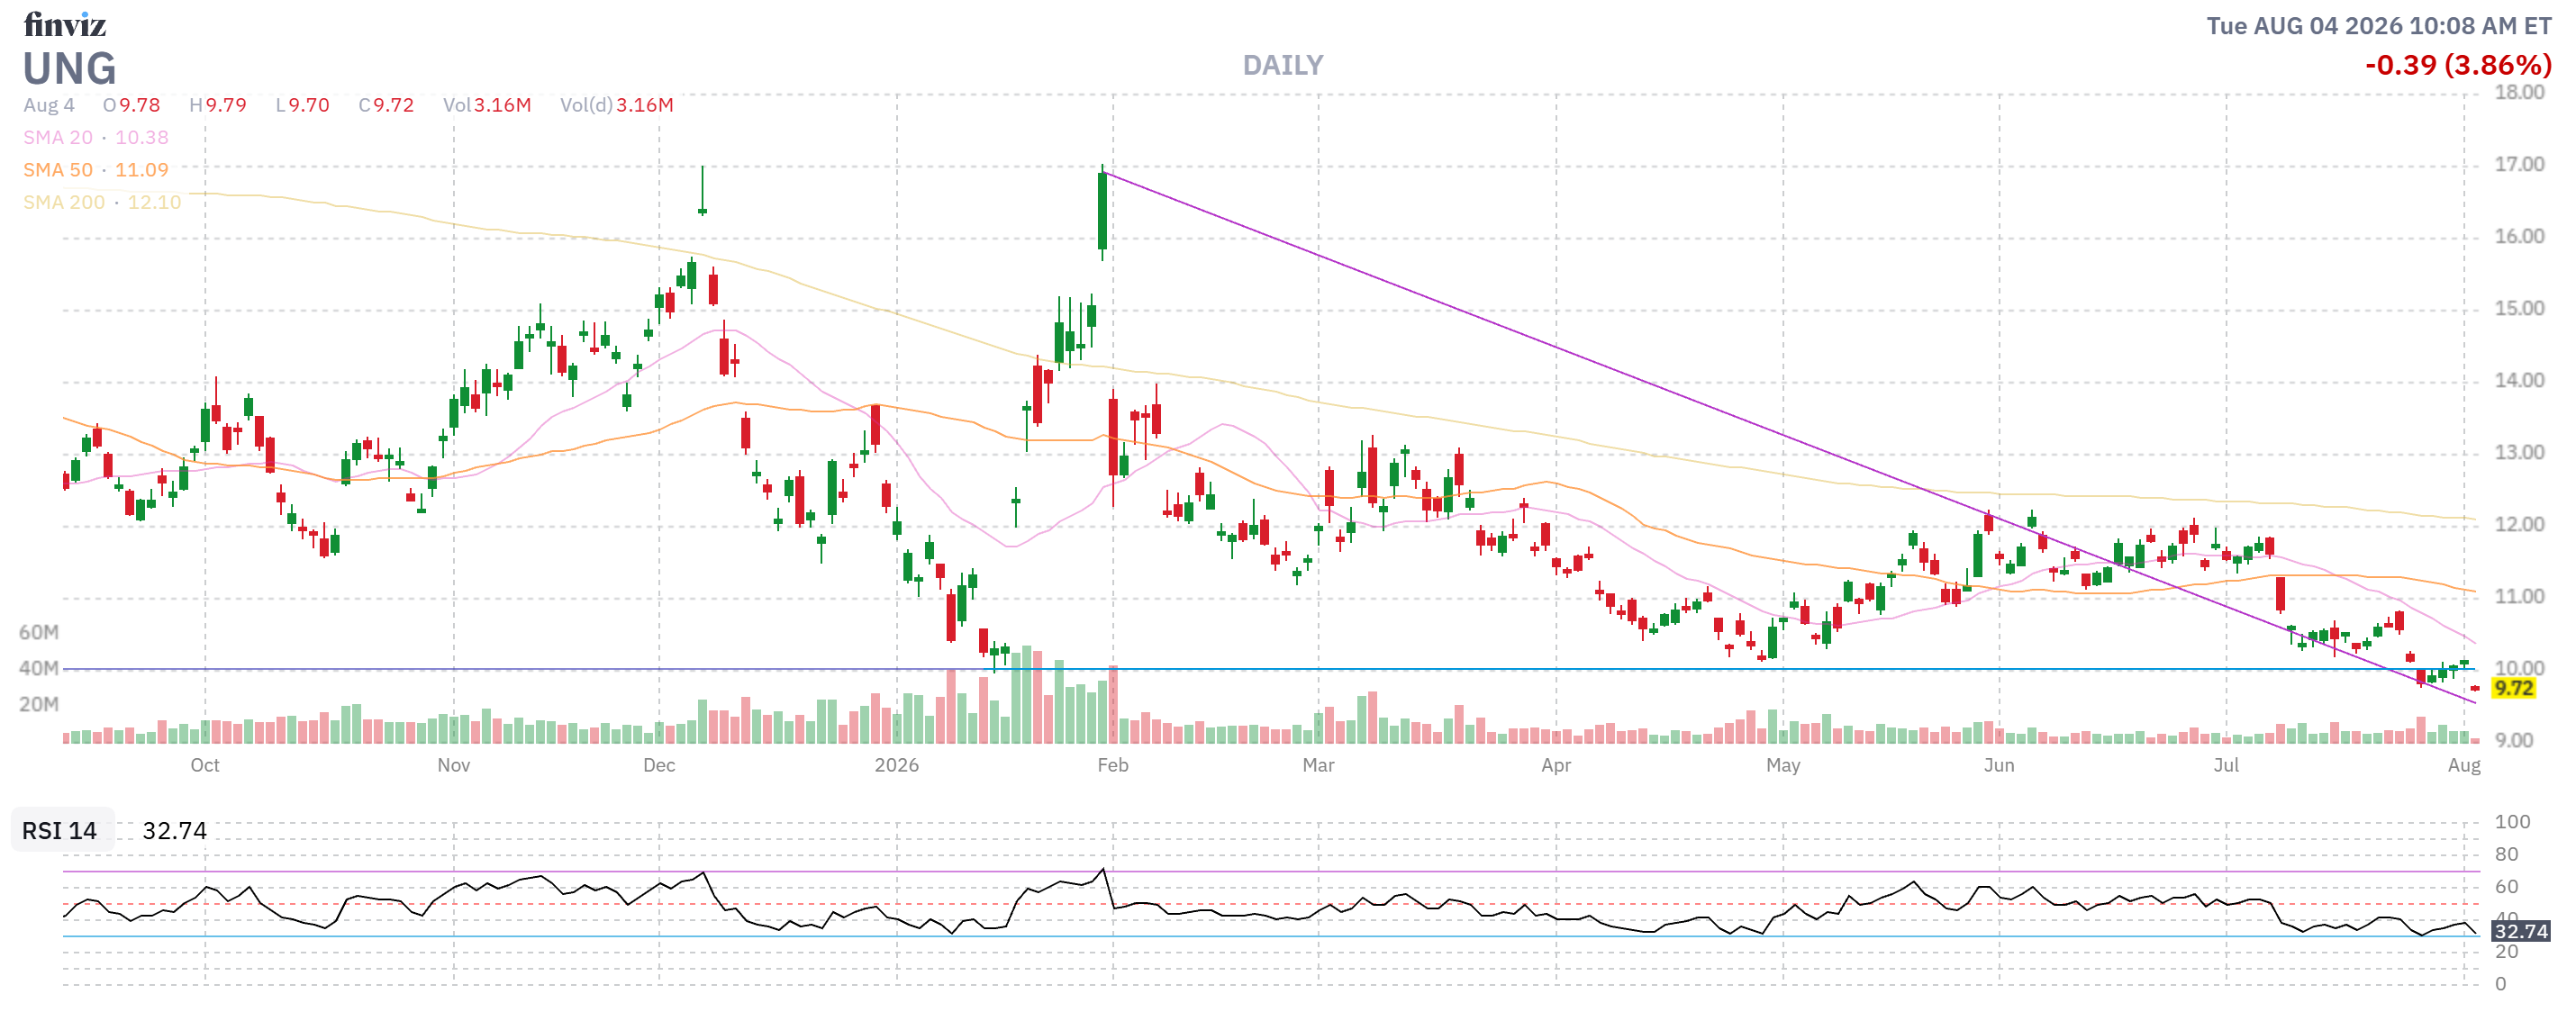
- UNG – Net $3,235 on the $6,000 spread and we have 6 more chances to sell $385 so $5,075 (156%) upside potential and I feel good about the target so Good for a New Trade.
So we’re in better shape than I thought with $16,000 off the table (over $35,000 CASH!!! now) and $141,125 in upside potential over 18 months is almost 100% so behind our current pace but with cash and opportunities to follow as the next 12 months roll along. That means you COULD start now with $153,234 and we MIGHT get to our goal in less than 3 years but, more importantly, we’ll certainly get there in the not-too-distant future!
Portfolio Positions & Upside Potential
| Position | Current Net Value | Upside Potential ($) | Upside Potential (%) | Notes / Calculation |
| ET | $2,580 | $420 | 16.2% | Net $2,580 on $3,000 spread |
| HELE | $5,050 | $2,450 | 48.5% | Net $5,050 on $7,500 spread |
| SOFI | $13,470 | $27,780 | 206.0% | Net $13,470 on $30,000 spread + 5 premium sales |
| GEO | $11,625 | $0 | 0.0% | Cashing out / taking off table |
| B | $14,026 | $14,000 | 99.8% | Premium sales + upside remaining |
| CAG | $2,550 | $3,450 | 135.3% | Net $2,550 on $6,000 spread |
| CLF | $1,787 | $11,213 | 627.5% | $1,213 spread upside + $10,000 premium sales |
| HPQ I | $6,020 | $6,000 | 99.7% | Net $6,020 on $8,000 spread + premium sales |
| HPQ II | $1,500 | $14,250 | 950.0% | $6,000 spread upside + $8,250 premium sales |
| M | $4,913 | $8,887 | 180.9% | $2,587 spread upside + $6,300 premium sales |
| NVO | $9,250 | $11,750 | 127.0% | Net $9,250 on $15,000 spread + premium sales |
| OWL | $3,462 | $6,538 | 188.9% | Net $3,462 on $7,500 spread + premium sales |
| PATH | $6,087 | $11,663 | 191.6% | Net $6,087 on $10,500 spread + premium sales |
| PFE | $1,433 | $4,487 | 313.1% | Net $1,433 on $5,000 spread + premium sales |
| PR | $1,600 | $9,400 | 587.5% | After cashing long calls ($5,525), net $1,600 on $5,000 spread + sales |
| STLA | $2,412 | $3,888 | 161.2% | Net $2,412 on $4,500 spread + premium sales |
| UNG | $3,235 | $5,075 | 156.9% | Net $3,235 on $6,000 spread + premium sales |
| TOTAL | $90,999 | $141,251 | 155.2% | Combined total upside across active positions |
Summary Highlights
-
-
Total Current Capital Tied Up (Excluding SQQQ): $90,999
-
Total Dollars Remaining to Gain: $141,251
-
Overall Average Return on Remaining Capital: 155.2%
-

