
Bill Luby at VIX and More reports on the ISE’s implied volatility charts’ new feature, an ISEE value, which is a ratio of call volume to put volume for a specific security. Bill chooses C as his example, since we should keep an eye on the Citigroup drama.
International Securities Exchange Revamps Implied Volatility Charts
Courtesy of Bill Luby, VIX and More
The International Securities Exchange (ISE), which publishes a superb implied volatility chart that I have featured on VIX and More on a number of occasions, has recently launched an enhanced version of their IV chart. The new version of this chart, which I have appended below, adds an “ISEE value” to the list of data. I have discussed the ISEE call to put ratio frequently in this space in the past. In this incarnation it is simply a ratio of call volume to put volume for the specified security.
I chose Citigroup (C) as my example security because all eyes should be on this bank, which is now trading at a 14 year low after hitting 3.57 earlier this morning. If Citigroup crumbles, it will dwarf the chaos created by AIG and Lehman Brothers.
Finally, for more information on the company that is the source of the volatility charts used by the ISE, check out Livevol.
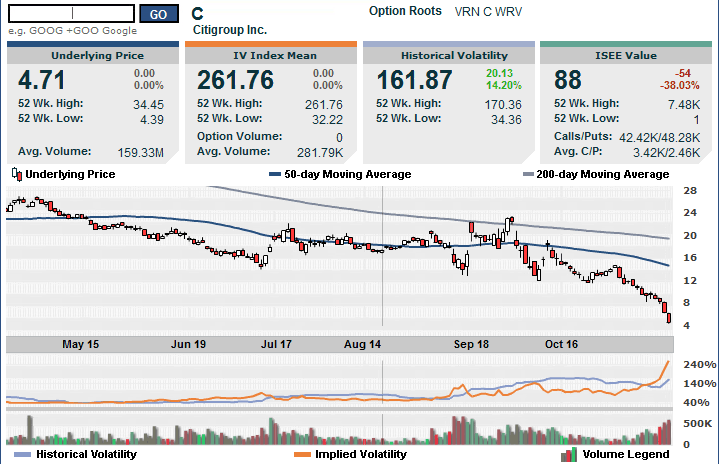
[chart courtesy of the International Securities Exchange]