
Comparing Today’s Bank Crisis to the Past
Courtesy of John Lounsbury at Piedmonthudson’s Weblog (posted at Seeking Alpha)
Even when adjusted for inflation and population growth, the 2008-09 banking crisis far exceeds previous banking crises, including even the Great Depression. There were 10,000 bank failures in the Great Depression, but few of them had branches.
Today, a medium sized bank usually has hundreds of branches and the two big failures, Washington Mutual and Wachovia Bank had more than 8,000 branches between them.
Thus, the number of actual bank locations affected in the current crisis, which is not over, is similar to the entire period of the Great Depression from 1929 to 1941.
When it comes to the amount of money involved, the current crisis has 70 times the asset dollars in failed banks compared to the Great Depression. Even when the figures are adjusted for inflation and population growth, the current crisis is still much larger in dollar terms.
An article at TheStreet.com entitled "Banking Crisis Dwarfs the Great Depression" gives the analysis details (here). The conclusion of that article states:
How does this bank crisis compare historically? There is no comparison.
This conclusion can also be seen in the analysis of the magnitude of assets involved in past crises to the GDP values at the time. This is shown in the following table:
The relationship of the current banking crisis to the size of the economy is more than seven times greater than the worst year of the Great Depression (1933). This crisis is 19 times larger with respect to GDP than the next worst year, 1989, in the S&L crisis.
These are astounding relationships. We have been and still are in unchartered territory. The Great Depression may not be repeated, but, in some ways, we have exceeded it to the downside. The ability of the U.S.and the world economy to withstand such a shock amazes me.
Now we have to see how the aftershocks and the financial system structure weakened by the "big one" interact in the coming years. I did not say months; it will take years to repair the effects of an event of this seismic magnitude.
Be prepared for the unexpected. We have never gone this way before.
Read the rest of the analysis in TheStreet.com article here and below:
Banking Crisis Dwarfs Depression
NEW YORK (TheStreet) — Four more banks went into Federal Deposit Insurance Corp. receivership on Friday, bringing to 81 the total of FDIC actions in 2009. Including FDIC bank closings in 2008, the total for the current financial crisis is now 104. Assets of these 104 banks totaled $146.7 billion. How does this compare with other crises in recent history?
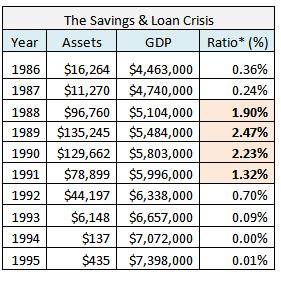
The worst banking crisis since the Great Depression was, until 2008, the savings and loan crisis that spanned 10 years from the 1980s into the 1990s. Total assets involved in that crisis were $519 billion. Adjusting for inflation, using the consumer price index, that is $923 billion in 2009 dollars. That dwarfs the current size of bank failures under the FDIC program in this crisis.
The table below shows the S&L crisis reached a peak in the fourth and fifth years — 1989 and 1990.
But we haven’t finished the second year of this crisis. Only 5.3% of the failures (based on assets) occurred in the first two years of the S&L crisis. We don’t know how long the current crisis will continue. We can only hope it doesn’t parallel the 10 years of the S&L crisis.
Currently, bank failures handled by the FDIC are only a tiny fraction of the financial institution failures. The totals are much larger if investment banks and so-called shadow banks, including AIG, Fannie Mae, and Freddie Mac, also are included. In addition, two FDIC-insured banks — Wachovia and Washington Mutual — were so large that the FDIC couldn’t handle the financial and logistic details of standard receivership. In the following table, institutions are defined as "failures" if they have survived to date with substantial or complete government ownership.
|
|||||||||

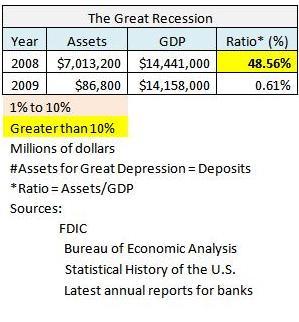
Assets for failures for this crisis total $7.1 trillion to date. This is nearly eight times the assets compared with the inflation-adjusted total for the S&L crisis.
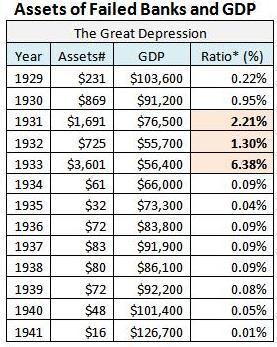
The data for bank failures in the Great Depression is shown in the following table. The total deposits involved were about $7.6 billion over a span of 13 years. Adjusted for inflation, that is $100 billion in 2009 dollars. The size of the crisis today, adjusted for inflation, is more than 70 times larger than the entire Great Depression. Because branch banking was quite uncommon in the 1930s, 10,000 bank closings then would be equivalent to a smaller number today.
When we adjust for population we get the results shown in the following table.
The S&L crisis was about five times bigger than the banking crisis of the Great Depression. The current crisis is about 25 times larger than the Great Depression. Both are per capita, adjusted for inflation. The current crisis is so large because the financial sector has grown to unprecedented economic dominance. The financial sector constituted 45% of earnings for the S&P 500 in 2006. If half of your eggs are in one basket, your diet becomes very restricted if you drop that basket.
The following table looks at layers in the banking crisis.
Every layer is much larger than the Great Depression banking crisis.
The New York Times reported over the weekend that Christopher Whalen, managing director at research firm Institutional Risk Analytics, has given a failing grade to 1,882 banks as of June 30. Whalen said that the assumed loss rate used in the Treasury’s stress tests already has been reached and the peak of the cycle has not. If half of these failing grades ended up as bank failures, this crisis could approach the 1,043 S&L failures.
It’s unlikely that bank failures can peak until we are close to a peak in mortgage foreclosures. Karen Weaver, global head of securities at Deutsche Bank Securities, projects that housing prices will continue to fall into early 2011. If that is the case, foreclosures could continue at a high rate until then. Many more banks may go under in such an eventuality.
So why then are bank stocks soaring? Two exchange-traded funds, SPDR KBW Regional Banking and SPDR KBW Bank are up 5.87% and 7.18%, respectively, in the past week. Over the last month they have gained 24.7% and 31.1%, respectively.
In my opinion, it is a case of a melt up in banking stocks. Investors are buying the robust "V" recovery story and will ride this market until we finally get a correction. The banks led the decline to March 9, and led the rebound. When a correction comes, banks should be one of the weakest sectors because investors will lock in huge profits and because significant questions will return about the strength of banking while falling house prices and mortgage default issues are still unresolved.
The worst situation for banks would be for the recovery to peter out. A "W" recovery, dipping back into recession, even if only for a couple of quarters, would push unemployment significantly higher and increase the mortgage foreclosure rates above the gloomiest projections made today. Such a scenario could take us beyond the thousand bank failures that many think unlikely. This also could put super banks, such as Bank of America, back on the list of banks at risk.
How does this bank crisis compare historically? There is no comparison.
— Written by John Lounsbury in Clayton, N.C.