
Consumer Demand Continues to Contract
Courtesy of Larry Doyle at Sense on Cents, based on the work of Rick Davis at Consumer Metrics Institute
For those inclined to monitor the pulse of the American consumer, please make it a habit to regularly visit the Consumer Metrics Institute. Rick Davis and team do fabulous, cutting edge, and real-time analysis of consumer activity in our domestic economy. Recall that Rick is already way ahead of the curve in calling for -1.5% 2nd quarter GDP and has an early call for a -2% 3rd quarter GDP.
What has Rick seen over the last ten days? Continued contraction in consumer spending. Let’s navigate.
‘Daily Growth Index’ Continues to Weaken:
Our ‘Daily Growth Index’ represents the average ‘growth’ value of our ‘Weighted Composite Index’ over a trailing 91-day ‘quarter’, and it is intended to be a daily proxy for the ‘demand’ side of the economy’s GDP. Over the last 60 days that index has been slowly dropping, and it has now surpassed a 2% year-over-year rate of contraction.
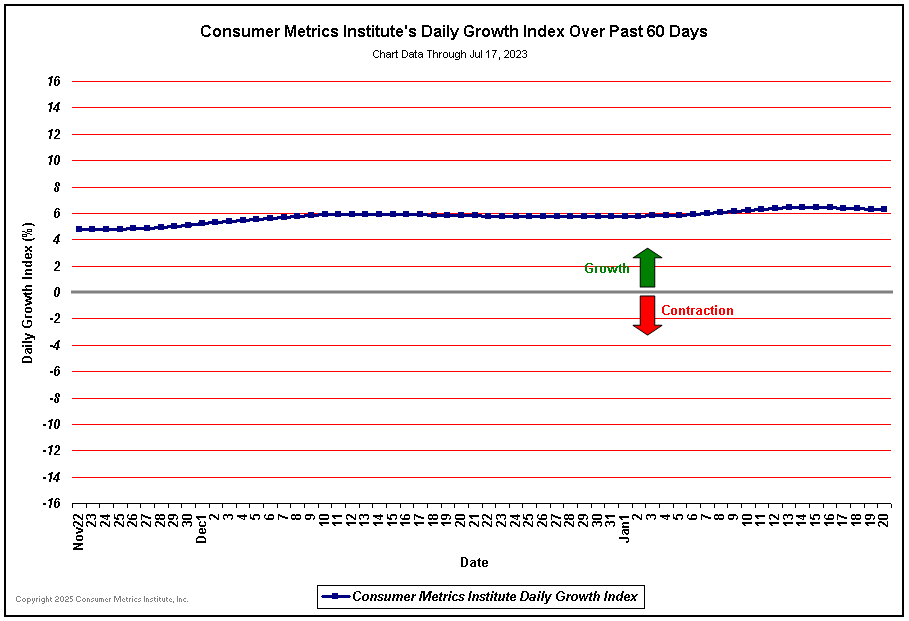
The downturn over the past week has emphasized the lack of a clearly formed bottom in this most recent episode of consumer ‘demand’ contraction. Compared with similar contraction events of 2006 and 2008, the current 2010 contraction is still tracking the mildest course, but unlike the other two it has now progressed over 140 days without an identifiable bottom.
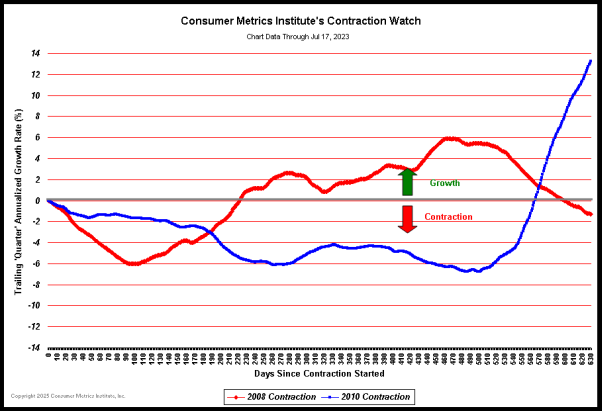
As we have mentioned before, this pattern is unique and unlike the ‘V’ shaped recovery (or even the ‘W’ shaped double-dip) that many had expected. From our perspective the unique pattern is more interesting than the simple fact of an ongoing contraction event. At best the pattern suggests an extended but mild slowdown in the recovery process. But at worse the pattern may be the early signs of a structural change in the economy.
Not everything has been doom-and-gloom over the past two weeks. The Retail Index rebounded nicely, reflecting increased strength in transaction levels at major chains during the Memorial Day weekend and the first week of June, even though the relatively low quality of the transactions did not result in corresponding movement in the ‘Weighted Composite Index’.
The weakest sector indexes during the prior week were the Technology Index and the Housing Index. However, the Housing sector has by far the greatest impact on our ‘Daily Growth Index’ and the GDP. This sector is unlikely to improve significantly unless applications for new home loans (as reflected in our weekly Home Loans Sub-Index) rebounds to more normal levels.
In summary, although there are some areas of consumer ‘feel good’ spending, the general weakness in our ‘Daily Growth Index’ points to continued consumer caution about assuming significant new or increased debt.
Do not expect to see this type of analysis in the realm of most marketing and media outlets. Marketers and most media are inclined to paint a picture so you will ’spend your cents’ while Rick Davis and yours truly are inclined to paint the real picture so you can make ’sense on cents.’