
Dark Horse Hedge 7/14/10

By Scott Brown of Sabrient and Ilene at PSW
Intel Corp (INTC) set the stage for what could have been a 7th consecutive bullish day for all 3 major indexes, but in the end the S&P closed just below the flat-line for the day, down 0.17 at 1095.2. There were two apparent reasons the market struggled in the face of such an upbeat report from INTC. The first was that financial stocks slumped all day, finishing down 0.9% as a group. STI, which we shorted in our last update, was down 2.75%. JPMorgan (JPM) announces its quarterly report tomorrow morning and that could be contributing to overall weakness in the financial sector. The second factor holding the market back today was the FOMC meeting minutes in which real GDP for 2010 was downgraded from 3.2-3.7% to 3.0-3.5%.
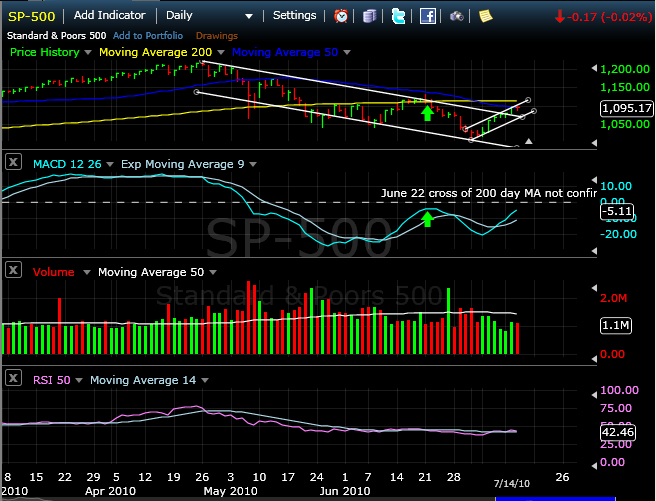
The S&P 500 is trading right along the 50 day Moving Average. Our Dark Horse Hedge portfolio is tilted short, 2:1. That is, our positions are weighted 67% short and 33% long, so while DHH is largely hedged, it has a net short exposure. We would change to a balanced Short/Long ratio, 1:1, if our models supported such a move. So far, they have not, even though they’re close.
In determining when a shift in "tilt" is appropriate, we apply a "hysteretic" model. Hysteresis refers to systems that have memory, where the effects of the current input (or stimulus) to the system are experienced with a certain memory for the previous input and a certain delay in reaction time. Hysteresis is defined as "the phenomenon exhibited by a system in which the reaction of the system to changes is dependent upon its past reactions to change" and as "the lag in response exhibited by a body in reacting to changes in the forces." Using a hysteretic formula, we look for more confirmation of a breakout than just breaking across a Moving Average on a given day.
Quantitative analysis involves a graduate level economics course to thoroughly explain, but that isn’t necessary for our purposes. The important thing to understand is that we take into consideration the direction of the movement across a Moving Average, and the support from other indicators such as MACD and RSI, to accumulate a preponderance of evidence prior to changing our overall tilt. To avoid whipsaw movements as the indexes trade along their 50-day and/or 200-day Moving Averages, we employ a hysteretic formula to delay altering the tilt until the movement is confirmed by multiple variables or until prices remain above the Moving Averages for several days. Currently, he MACD 12-26-9 has moved much closer to its signal line (zero) at -5.1, and the RSI 14-day is at 42.5 (bullish signal is above 50). A review of the last attempt for our model to turn more bullish with the SP-500 trading near its 200-day Moving Averages, resulted in failure with the MACD at -4.2, and the RSI at 44.2. This led to a sharp decline which bottomed out on July 22, 2010 at 1022.6.
Reviewing the SP-500 tonight, the preponderance of chart evidence, weak economic data from the FMOC minutes, and anticipated weakness from JPMorgan/Financials tomorrow, we believe that "too far, too fast" is the most likely scenario and that the S&P 500 will refill the gap, most likely testing 1075. It will be important for short-term bulls to see support established at 1075 in order to allow the market to move higher. We are comfortable leaving the SHORT tilt in place. However, Dark Horse Hedge has a watch list of buys ready to go, and we will add add 3 LONG positions if the bullish movements are confirmed by our other signals. Just not yet.