

Courtesy of ZeroHedge. View original post here.
Submitted by Tyler Durden.
Submitted by Charles Hugh Smith from Of Two Minds
What Rising Gasoline Prices Do to the Economy
Charting gasoline prices against income and GDP provides some interesting results.
Since rapidly rising gasoline prices are in the news, let's look at some charts of gasoline and the economy, courtesy of frequent contributor B.C. These depict income and GDP in a ratio with the price of gasoline, and so they reveal information that is not contained in charts showing only the price of gasoline or GDP.
Here is disposable personal income and the price of gasoline:
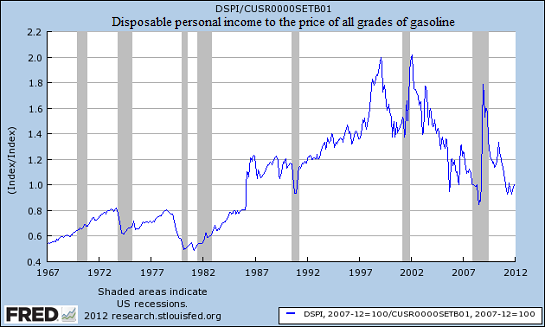
When real (inflation-adjusted) wages are stagnant and the price of gasoline is high, as was the case in the late 1970s and the recessionary early 1980s, the ratio is low. If income is stagnant and the cost of gasoline is high, then people have less money to spend on other items and the economy is also stagnant–exactly what occurred after the 1979 Iran Crisis pushed gasoline prices up. (Sound familiar?)
When gasoline is relatively cheap and incomes are rising, then the ratio is high. Thus when oil prices hit bottom and incomes were rising in the late 1990s, then the ratio was peaking.
Look at it now. The ratio spiked in 2009 as oil prices plummeted from $140 per barrel in 2008 to less than $40 by the end of 2009.
Since incomes are stagnant (actually down since the 2007 top) and gasoline is once again on the rise, the ratio is returning to recessionary levels.
Here is GDP and the price of gasoline:
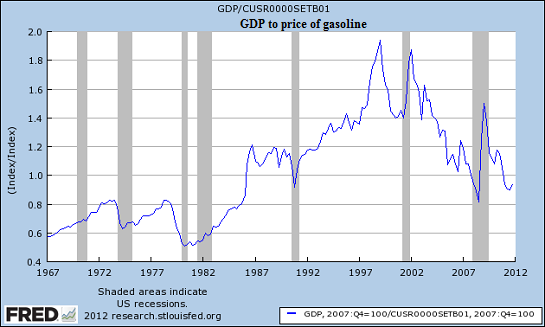
As B.C. noted: "These charts show that wages, incomes, and GDP have fallen dramatically in relation to the increase in the price of gasoline (and energy in general) since the secular peak in the late '90s to early '00s." The ratio is back to the recessionary levels of 1990 and 2008 and not far above the "oil shock" stagflation of the 1970s.
If the government portion of GDP is removed, what's left is private GDP to gasoline prices:
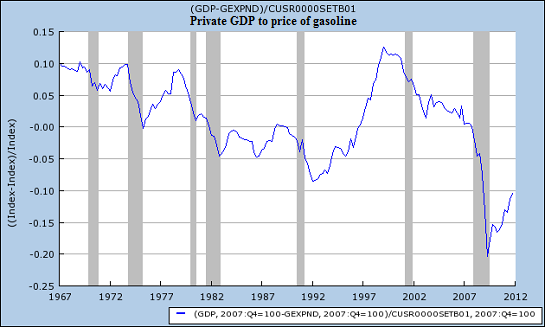
This chart shows the secular decline in the private economy from the late 60s into the late 1980s, and the expansion of the 1990s. The ratio once again began a secular decline from its peak in the Internet boom years of 1999-2000, and then fell off a cliff in the 2008-9 recession.
Though it has recovered a bit, the ratio suggests that in terms of private (non-government) GDP and the price of gasoline, the private-sector economy is plumbing depths that are unprecedented in last 45 years. (The "oil shock" stagflationary 1970s look resilient by comparison, and the nation wasn't borrowing 10% of its GDP every year, either.)
Yes, the Federal government can cover up the damage by borrowing 10% of GDP each and every year ($1.5 trillion, and don't forget to add in the off-budget "supplementary appropriations"), and the Federal Reserve can add trillions in quantitative easing stimulus, but even adding $8 trillion of borrowed/printed money to the economy over the past four years has had remarkably little effect on the private-sector economy. That does not bode well for the "recovery."
And for those stapped for time, here is what we posted exactly a year ago:
The Impact Of Surging Oil Prices On The US Consumer: A Primer

A quick talking point: assuming a pure crowding out, the effective $700 tax on consumers reduces GDP by 0.5% (disclosure, the sensitivity is higher than some on the street who use 2.5-2.75 cents for every $1 in oil).