

Courtesy of The Automatic Earth.

For all of you who like charts, this is a guest post by Josh Clark at chartistfriendfrompittsburgh.blogspot.com. I'll let it speak for itself.
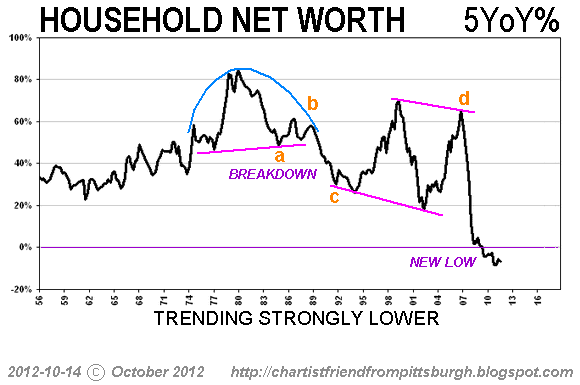
Josh Clark: Business Insider published the presentation David Rosenberg gave at last week's Big Picture conference. There are 57 slides in the show. One of them shows the 5 year percent change of household net worth. It's an extremely bearish chart.

And it's a chart that lends itself to clear curvilinear wave analysis.
I knew FRED had this data so I decided to check it out for myself. And then I realized Rosenberg was looking at the raw data in a way that FRED does not allow. They provide a year over year percent function but not a five year option. That's when I decided it was time to spend some time with Excel.
Here are the results…
Household net worth hit a high of $67 trillion in 2007. It's now $5 trillion lower.

When the stock market starts falling apart again expect household net worth to collapse with it.
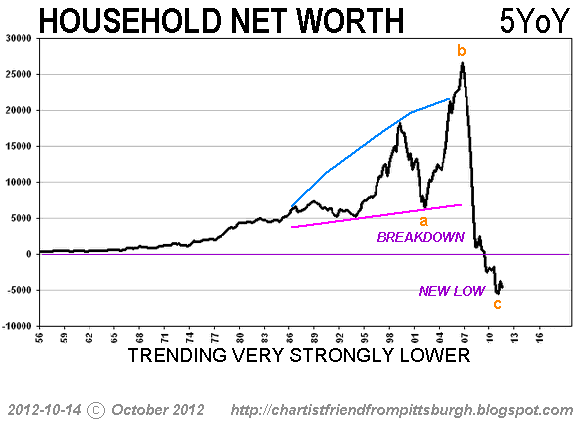
Here's what household net worth looks like on a straight five year change basis – a total disaster.
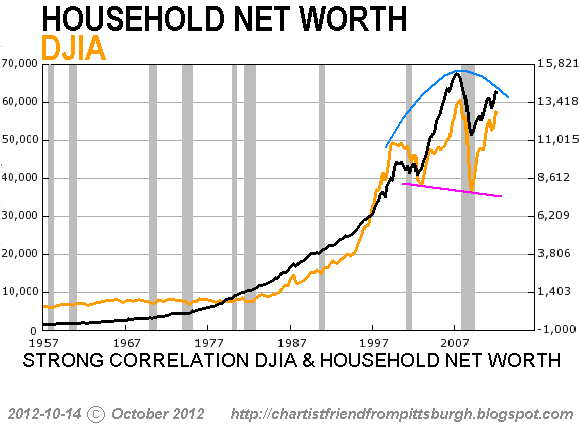
Here's what the DJIA looks like on that basis – not exactly bullish.

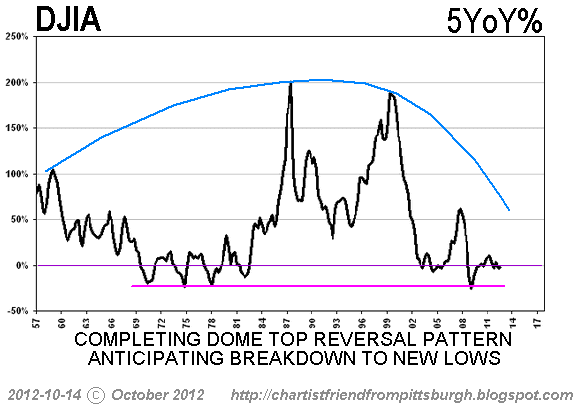
Here's what the DJIA looks like on a five year percent change basis – another winner.
Here's what household net worth looks like on a straight year over year change basis – get ready for another wave of massive wealth destruction.

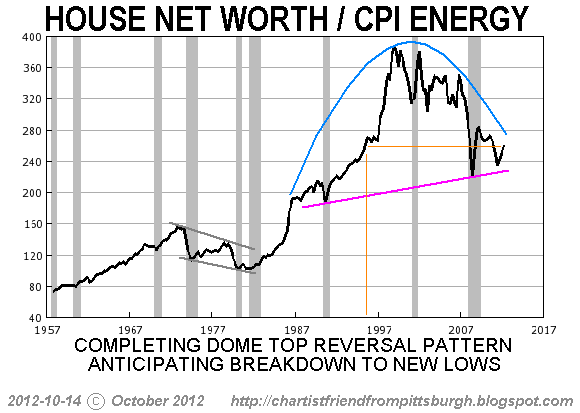
And finally no discussion of household net worth would be complete without looking at it in "real" terms. Here's the data adjusted for energy inflation – since 1995 there has been no real wealth creation.
There is one way to protect yourself from the effects of the upcoming wave of wealth destruction – ride the collapse down like Pasquale Buzzelli by shorting the market. Some of the stock charts I have recently analyzed show the potential for 90% price declines over the next few years.