

Reminder: Sabrient is available to chat with Members, comments are found below each post.
Courtesy of Sabrient Systems and Gradient Analytics
Congress got its act together just enough to stave off the fiscal cliff. Unfortunately, they merely added a long “pirate plank” to the edge of the cliff, as spending was not addressed. So the country has stepped off the cliff and now we are “walking the plank,” albeit without the blindfold since we know when the debt ceiling and sequestration are scheduled to kick in.
Our elected representatives inked a deal that satisfies no one, despite the self-congratulatory rhetoric you hear from the White House on fulfilling the “tax the rich” promise. Still left unresolved are the debt ceiling, sequestration, spiraling health care expenses, and entitlement reform. With no agreed-upon spending cuts of any kind, it appears that we will be adding substantially to the already out-of-control deficit. “That government is best which governs least” is now just a quant old saying from our founding fathers in another place and time that has been cast into history’s scrap heap by an entitlement-hungry electorate.
Nevertheless, investors cheered the tax deal, such as it is, by providing an impressive upside gap on Wednesday morning followed by a strong late-day finish. Coupled with Monday’s strong engulfing candlestick, the S&P 500 gained a robust 4.3% in just 2 trading days—and each day ended with a surge in buying rather than profit-taking. Not too shabby. The epitome of a relief rally. Even Apple (AAPL) seems to want to reestablish its former glory as a market leader.
Most of the big macro concerns of 2012 are still in place, however. The MacroReport, a co-publication of Sabrient Systems and MacroRisk Analytics, addressed many of them during the past year, including the Eurozone debt crisis, China’s growth rate, global oil prices, and central bank initiatives. But with low interest rates and lots of investable cash, stocks still have a strong wind in their sails—at least until the debt ceiling is hit.
I mentioned in mid-December that it might be worthwhile to buy some February call options on a market index as a lottery ticket for a bullish surge after a budget deal is inked. I hope you did so. I took my own advice and bought some calls on the SPY. I sold half on Wednesday just to get my original investment back, while letting the balance of the position ride risking only house money.
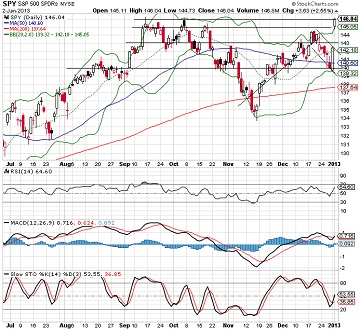
The S&P 500 SPDR Trust (SPY) closed Wednesday at 146.04. Monday’s big engulfing candle retraced the full span of the bull flag pattern after 140 provided strong support, and then Wednesday brought a massive gap breakout, blasting through resistance at 143 and 145. It now is trying to break through this area of triple-top resistance (146-148). Oscillators RSI, MACD, and Slow Stochastic are all pointing up bullishly, although we eventually should see at least a partial retracement of the breakaway gap.
The CBOE Market Volatility Index (VIX), a.k.a. “fear gauge,” fell nearly 20% on Wednesday to close at 14.68, which is down from its brief fear spike above 23 last Friday and well below the important 20 threshold. Its 35.4% fall over the past two trading days is the biggest 2-day drop in the history of the VIX.
Latest rankings: The table ranks each of the ten U.S. industrial sector iShares (ETFs) by Sabrient’s proprietary Outlook Score, which employs a forward-looking, fundamentals-based, quantitative algorithm to create a bottom-up composite profile of the constituent stocks within the ETF. In addition, the table also shows Sabrient’s proprietary Bull Score and Bear Score for each ETF.
High Bull score indicates that stocks within the ETF have tended recently toward relative outperformance during particularly strong market periods, while a high Bear score indicates that stocks within the ETF have tended to hold up relatively well during particularly weak market periods. Bull and Bear are backward-looking indicators of recent sentiment trend.
As a group, these three scores can be quite helpful for positioning a portfolio for a given set of anticipated market conditions.
Observations:
1. These rankings reflect a pre-budget deal conservatism. There has been very little in the way of Wall Street adjustments to earnings estimates. Healthcare has surged to the top with an Outlook score of 88. IYH shows relatively good support among analysts, a reasonably good forward P/E, and solid return ratios. Consumer Goods (IYK) holds onto second place with an Outlook score of 81. It boasts the best analyst score and strong return ratios. Technology (IYW) has fallen to third place with a 71, and then there is a 19-point gap down to Energy (IYE).
2. Telecom (IYZ) stays in the cellar with an Outlook score of 14, and is joined in the bottom two this week by Consumer Services (IYC) with a 30. Stocks within IYZ appear overvalued from the standpoint of the forward P/E and lack analyst support.
3. Overall, I would characterize the fundamentals-based Outlook rankings as slightly defensive, with Healthcare and Consumer Goods at the top of the rankings followed by the all-weather Tech and Energy sectors. The more economically-sensitive sectors like Industrial, Financial, Materials, and Consumer Services are all languishing a bit, which reflects uncertainty among Wall Street analysts about economic growth and the Federal budget negotiations. However, I suspect that next week’s rankings might be a bit less defensive given recent developments.
4. Looking at the Bull scores, Energy (IYE) has been the clear leader on strong market days, scoring 59. Utilities (IDU) is the laggard on strong market days, scoring 42. In other words, Energy stocks have tended to perform the best when the market is rallying, while Utilities stocks have lagged.
5. Looking at the Bear scores, none of the sectors are scoring very high. Utilities (IDU) is still the favorite safe haven on weak market days, but it’s only scoring an amemic 50, which indicates that most everything is selling off during recent market weakness. Energy (IYE) is the worst during market weakness, as reflected in its low Bear score of 38, but there’s only a 12-point range from top to bottom. Still, Energy stocks have been selling off the most when the market is pulling back, while Utilities stocks have held up the best.
6. Overall, Healthcare (IYH) now shows the best all-weather combination of Outlook/Bull/Bear scores. Adding up the three scores gives a total of 180. Telecom (IYZ) is by far the worst at 111. However, looking at just the Bull/Bear combination, IYH doesn’t look very good at all—with a total score of only 92—which is tied with Utilities (IDU) for the lowest. Somewhat surprisingly, Basic Materials (IYM) now has the best score at 101, while Energy (IYE) and Utilities (IDU) share the worst at 94. So, although IYH has the best Outlook score, investor sentiment as reflected by Bull and Bear behavior has not corroborated it.
These scores represent the view that the Healthcare and Consumer Goods sectors may be relatively undervalued overall, while Telecom and Consumer Services sectors may be relatively overvalued based on our 1-3 month forward look.
Top-ranked stocks within IYH and IYK include DaVita HealthCare Partners (DVA), Gilead Sciences (GILD), Middleby Corp (MIDD), and Monsanto (MON).
By the way, Sabrient is proud to announce that our “Baker’s Dozen” Top Stocks for 2012 closed the year up an astounding +43%. This was the fourth straight year of market-beating returns since inception in 2009. A third-party web site called Dark-Liquidity has been tracking a number of model portfolios from the larger brokers, financial publications, and independents, and Sabrient finished well ahead of all of them as described in this Seeking Alpha article: http://seekingalpha.com/article/1090611-performance-review-2012-smart-money-portfolios
The new Sabrient Baker’s Dozen list for 2013 will be released on January 11 in conjunction with a Unit Investment Trust for the same portfolio. You can learn more at http://www.sabrientsystems.com/bakers-dozen-2013.
Disclosure: Author has no positions in stocks or ETFs mentioned.
About SectorCast: Rankings are based on Sabrient’s SectorCast model, which builds a composite profile of each equity ETF based on bottom-up aggregate scoring of the constituent stocks. The Outlook Score employs a fundamentals-based multi-factor approach considering forward valuation, earnings growth prospects, Wall Street analysts’ consensus revisions, accounting practices, and various return ratios. It has tested to be highly predictive for identifying the best (most undervalued) and worst (most overvalued) sectors, with a 1-3 month forward look.
Bull Score and Bear Score are based on the price behavior of the underlying stocks on particularly strong and weak days during the prior 40 market days. They reflect investor sentiment toward the stocks (on a relative basis) as either aggressive plays or safe havens. So, a high Bull score indicates that stocks within the ETF have tended recently toward relative outperformance during particularly strong market periods, while a high Bear score indicates that stocks within the ETF have tended to hold up relatively well during particularly weak market periods.
Thus, ETFs with high Bull scores generally perform better when the market is hot, ETFs with high Bear scores generally perform better when the market is weak, and ETFs with high Outlook scores generally perform well over time in various market conditions.
Of course, each ETF has a unique set of constituent stocks, so the sectors represented will score differently depending upon which set of ETFs is used. For Sector Detector, I use ten iShares ETFs representing the major U.S. business sectors.
About Trading Strategies: There are various ways to trade these rankings. First, you might run a sector rotation strategy in which you buy long the top 2-4 ETFs from SectorCast-ETF, rebalancing either on a fixed schedule (e.g., monthly or quarterly) or when the rankings change significantly. Another alternative is to enhance a position in the SPDR Trust exchange-traded fund (SPY) depending upon your market bias. If you are bullish on the broad market, you can go long the SPY and enhance it with additional long positions in the top-ranked sector ETFs. Conversely, if you are bearish and short (or buy puts on) the SPY, you could also consider shorting the two lowest-ranked sector ETFs to enhance your short bias.
However, if you prefer not to bet on market direction, you could try a market-neutral, long/short trade—that is, go long (or buy call options on) the top-ranked ETFs and short (or buy put options on) the lowest-ranked ETFs. And here’s a more aggressive strategy to consider: You might trade some of the highest and lowest ranked stocks from within those top and bottom-ranked ETFs.