

Courtesy of Sabrient Systems and Gradient Analytics
 Overall, earnings reports have continued to beat the low bar of expectations. The Financial sector started earnings season with strong reports, and now Technology has been the leader this week. Note that these two have dominated the top of Sabrient’s forward-looking SectorCast ETF rankings for several months. But as earnings season progresses, investors have been watching intently for companies to report increased revenues as well as earnings, with the greatest rewards going to those firms confident enough to raise their forward guidance.
As July comes to a close, the forward P/E of the S&P 500 is 15.7x projected earnings estimates, which reflects some inflation in the multiple since the start of the year, as price growth as outpaced earnings growth, which of course is unsustainable longer term. Of course, the markets are no longer burdened so much by the earlier threats of European insolvencies and China’s growth slowdown. But still, earnings growth will be a prerequisite for further growth in equity prices — and it will have to be led by top-line growth, as cost cutting and productivity improvements have been just about maxed out (at least in the private sector, that is).
If you have been following my stock ideas the past couple of weeks, you noticed a couple of big winners this week in CommVault Systems (CVLT) and Harris Corp (HRS). Both beat earnings estimates and boasted impressive top-line growth. CVLT revenue rose +21%, while HRS revenue rose +26%.
Besides faring well in Sabrient’s quantitative ratings algorithms, each of these two companies also displays a solid score in our new Earnings Quality Rank (EQR), which is a pure accounting-based risk assessment signal that has proven valuable for both fundamental screening and as an orthogonal alpha factor for quant models. The model was co-developed by Sabrient and subsidiary Gradient Analytics, a forensic accounting firm.
As a reminder, Sabrient’s annual Baker’s Dozen portfolio of top stocks for 2013 continues to perform. It is up +25.6% from the portfolio’s inception on January 11, while the S&P 500 is up only +14.5% over the same timeframe. In fact, all 13 stocks are solidly positive, and 12 are comfortably up by double digits, which we largely attribute to the presence of EQR as a key scoring factor in the underlying multifactor model to help avoid meltdowns that can ruin overall portfolio performance.
Following Tuesday’s favorable reports in consumer confidence and the home price Index, on Wednesday ADP employment and GDP both looked solid. Then, the FOMC policy statement said the economy continues to recover but still needs support, with no change to the $85 billion monthly bond-buying program. All of this emboldened the market to make a rally attempt, but alas it got smacked down right at the 3:00 hour, leading traders to bail for the day and/or book their gains for the month.
Nevertheless, the S&P 500 closed the month of July with a +5% gain, making this its strongest month since January. The index continues to make a push toward another new high as it challenges the 1700 level, which is proving to be tough psychological resistance. It behaved similarly at the end of April when it was trying to break through the 1600 level.
Looking at the chart of the SPDR S&P 500 Trust (SPY), it closed Wednesday at 168.71, which is right where it was last Wednesday. It took another run at 170 on Wednesday after the FOMC statement as bulls tried to close July with gusto, but it failed at that level as it did last week. SPY remains above all its major moving averages and the uptrend line from November. I also have drawn on the chart another uptrend line just since the April lows that appears to be supporting recent price action of higher lows, and in fact, it may be serving as the lower line of a bullish ascending triangle, in which 170 represents the flat upper line of the triangle. This bullish formation appears to be simply awaiting the next catalyst for a breakout. Oscillators RSI, MACD, and Slow Stochastic are all looking mostly neutral.
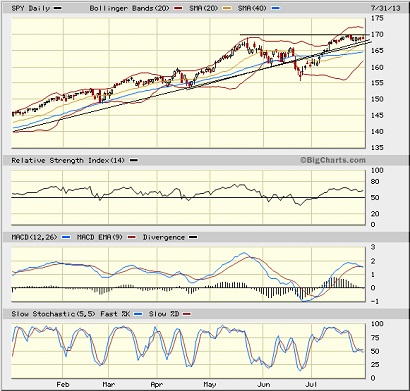
As the market remains near its high, it’s no surprise that the CBOE Market Volatility Index (VIX), a.k.a. “fear gauge,” remains historically low. It closed Wednesday at 13.45, which is about where it was last Wednesday and keeps it in the zone of high complacency (and low fear) below 15 that we saw for most of the earlier part of the year.
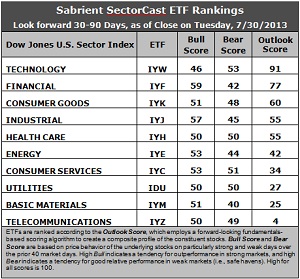
Latest rankings: The table ranks each of the ten U.S. business sector iShares ETFs by Sabrient’s proprietary Outlook Score, which employs a forward-looking, fundamentals-based, quantitative algorithm to create a bottom-up composite profile of the constituent stocks within the ETF. The multi-factor model considers forward valuation, historical earnings trends, earnings growth prospects, the dynamics of Wall Street analysts’ consensus estimates, accounting practices and earnings quality, and various return ratios. In addition, the table also shows Sabrient’s proprietary Bull Score and Bear Score for each ETF.
High Bull score indicates that stocks within the ETF have tended recently toward relative outperformance during particularly strong market periods, while a high Bear score indicates that stocks within the ETF have tended to hold up relatively well during particularly weak market periods. Bull and Bear are backward-looking indicators of recent sentiment trend.
As a group, these three scores can be quite helpful for positioning a portfolio for a given set of anticipated market conditions.
Observations:
1. Technology (IYW) remains in the top spot with a strong Outlook score of 91. Anything above 90 is impressive. IYW displays a low forward P/E, a solid long-term projected growth rate, and the best return ratios. Financial (IYF) takes the second spot again with a score of 77 as it enjoys a low forward P/E, strong insider sentiment, and a notable surge in Wall Street support. In fact, sell-side analysts aren’t doing much in the way of earnings upgrades on any other sector, so IYF scores well above the rest on this metric. Consumer Goods (IYK) has moved back into third place with an Outlook score of 60. Last week, Energy (IYE) made a brief appearance in the top three, but it has fallen back this week after getting hit with a number of downward earnings revisions.
2. Telecom (IYZ) stays in the cellar yet again with an Outlook score of 4. IYZ is generally weak in all factors across the board, including a high forward P/E, modest long-term projected growth, and poor return ratios. Also in the bottom two again this week is Basic Materials (IYM) with a score of 25, as stocks within the sector just can’t catch a break from Wall Street.
3. This week’s fundamentals-based rankings seem to maintain the slightly bullish bias I have been observing, with Technology, Financial, and Industrial (IYJ) in the top four. In fact, IYJ is now scoring above 50 for the first time since March.
4. Looking at the Bull scores, IYF has been the leader on particularly strong market days, scoring 59, followed closely by IYJ at 57, while Technology (IYW) surprisingly scores the lowest at 46. In fact, IYW is the only sector scoring below 50. The top-bottom spread is a still-narrow 13 points, indicating relatively high sector correlations on bullish market days, i.e., all boats are lifted together rather than a thoughtful stock-picking approach. Nevertheless, the spread has grown a bit.
5. Looking at the Bear scores, IYW remains the surprising favorite “safe haven” on weak market days, scoring 53, which is well ahead of defensive sectors like Utilities (IDU), but is not anywhere near the usual high in Bear scores of around 65-70 that we’ve often seen in IDU. IYM displays the worst performance during extreme market weakness as reflected in the low Bear score of 40. The top-bottom spread is a still-narrow 13 points, indicating relatively high sector correlations on weak market days, but like the Bull scores, the spread has grown a bit (which is good).
6. Overall, Technology (IYW) shows the best all-weather combination of Outlook/Bull/Bear scores. Adding up the three scores gives a total of 190. Telecom (IYM) is the by far the worst at 103. Looking at just the Bull/Bear combination, Consumer Services (IYC) displays the highest score of 104, which indicates good relative performance in extreme market conditions (whether bullish or bearish), while Materials (IYM) scores the lowest at 91, which indicates investor avoidance during extreme conditions.
These Outlook scores represent the view that Technology and Financial sectors are still relatively undervalued, while Telecom and Basic Materials sectors may be relatively overvalued based on our 1-3 month forward look.
Some top-ranked stocks within IYW and IYF that look good to me this week include Cognizant Technology Solutions (CTSH), QUALCOMM (QCOM), Ameriprise Financial (AMP), and Portfolio Recovery Associates (PRAA), which just beat on earnings.
Disclosure: Author has no positions in stocks or ETFs mentioned.
About SectorCast: Rankings are based on Sabrient’s SectorCast model, which builds a composite profile of each equity ETF based on bottom-up aggregate scoring of the constituent stocks. The Outlook Score employs a fundamentals-based multi-factor approach considering forward valuation, earnings growth prospects, Wall Street analysts’ consensus revisions, accounting practices, and various return ratios. It has tested to be highly predictive for identifying the best (most undervalued) and worst (most overvalued) sectors, with a 1-3 month forward look.
Bull Score and Bear Score are based on the price behavior of the underlying stocks on particularly strong and weak days during the prior 40 market days. They reflect investor sentiment toward the stocks (on a relative basis) as either aggressive plays or safe havens. So, a high Bull score indicates that stocks within the ETF have tended recently toward relative outperformance during particularly strong market periods, while a high Bear score indicates that stocks within the ETF have tended to hold up relatively well during particularly weak market periods.
Thus, ETFs with high Bull scores generally perform better when the market is hot, ETFs with high Bear scores generally perform better when the market is weak, and ETFs with high Outlook scores generally perform well over time in various market conditions.
Of course, each ETF has a unique set of constituent stocks, so the sectors represented will score differently depending upon which set of ETFs is used. For Sector Detector, I use ten iShares ETFs representing the major U.S. business sectors.
About Trading Strategies: There are various ways to trade these rankings. First, you might run a sector rotation strategy in which you buy long the top 2-4 ETFs from SectorCast-ETF, rebalancing either on a fixed schedule (e.g., monthly or quarterly) or when the rankings change significantly. Another alternative is to enhance a position in the SPDR Trust exchange-traded fund (SPY) depending upon your market bias. If you are bullish on the broad market, you can go long the SPY and enhance it with additional long positions in the top-ranked sector ETFs. Conversely, if you are bearish and short (or buy puts on) the SPY, you could also consider shorting the two lowest-ranked sector ETFs to enhance your short bias.
However, if you prefer not to bet on market direction, you could try a market-neutral, long/short trade—that is, go long (or buy call options on) the top-ranked ETFs and short (or buy put options on) the lowest-ranked ETFs. And here’s a more aggressive strategy to consider: You might trade some of the highest and lowest ranked stocks from within those top and bottom-ranked ETFs.