

Courtesy of Lance Roberts, RealInvestmentAdvice.com
On the “Real Investment Hour” on Tuesday night, I addressed the issue of price versus fundamentals. In the short-term, a period of one-year or less, political, fundamental, and economic data has very little influence over the market. This is especially the case in a late-stage bull market advance, such as we are currently experiencing, where the momentum chase has exceeded the grasp of the risk being undertaken by unwitting investors.
As shown in the chart below, the longer-term price trend of the market remains clearly bullish. However, despite commentary on valuations, sentiment, economics, or politics, the PRICE of the market suggests a weakening trend in investor confidence at current levels. That weakness has also instigated a short-term “sell signal” which suggests prices may struggle more in the days ahead. One thing we need to pay attention to is a potential break of the bullish trend line running along the 50-day moving average. Such a break would likely coincide with a correction back to 2330 in the short term.

Alternatively, if the market can reverse the current course of weakness and rally above recent highs, it will confirm the bull market is alive and well, and we will continue to look for a push to our next target of 2500.
With portfolios currently fully allocated, we are simply monitoring risk and looking for opportunities to invest “new capital” into markets with a measured risk/reward ratio.
However, this is a very short-term outlook which is why “price is the only thing that matters.”
Price measures the current “psychology” of the “herd” and is the clearest representation of the behavioral dynamics of the living organism we call “the market.”
But in the long-term, fundamentals are the only thing that matters. I have shown you the following chart many times before. Which is simply a comparison of 20-year forward total real returns from every previous P/E ratio.
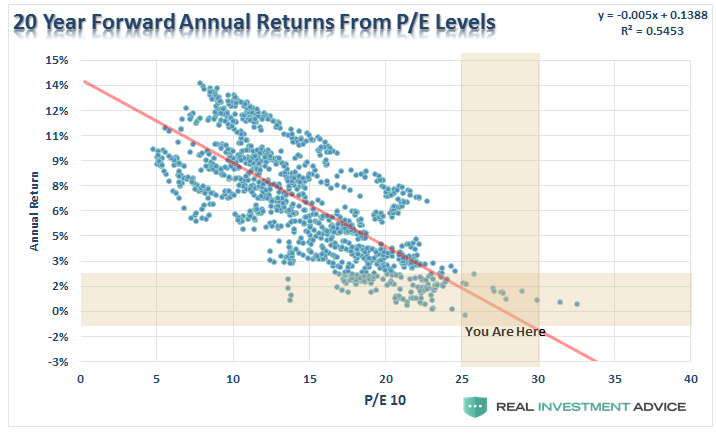
I know, I know.
“P/E’s don’t matter anymore because of Central Bank interventions, accounting gimmicks, share buybacks, etc.”
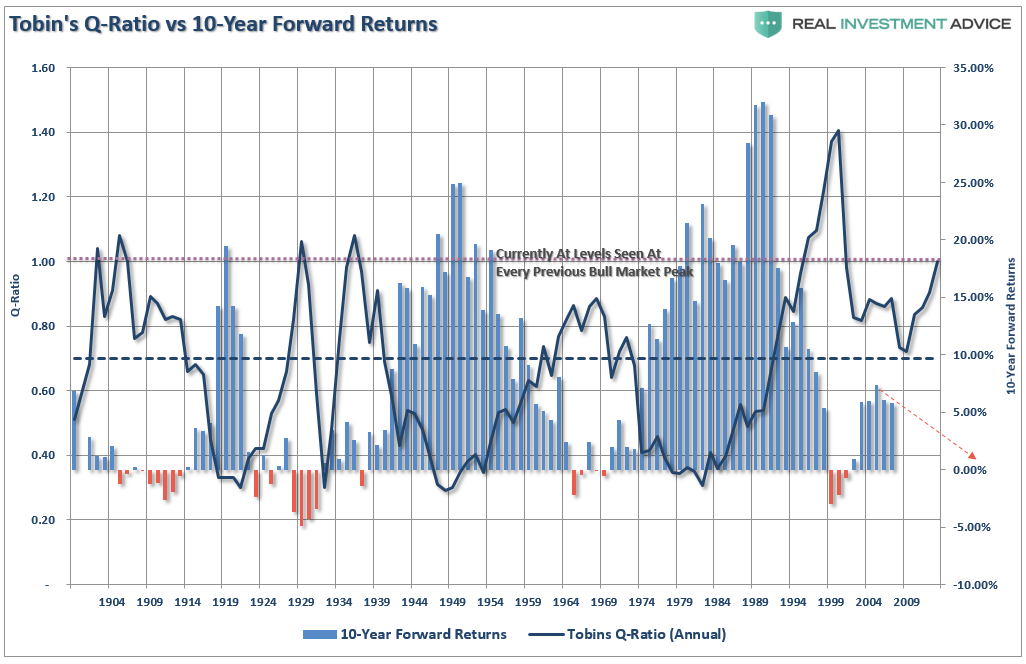
In the following series of charts, I am using forward 10-year returns just for consistency as some of the data sets utilized don’t yet have enough history to show 20-years of forward returns.
The purpose here is simple. Based on a variety of measures, is the valuation/return ratio still valid, OR, is this time really different?
Let’s see.
Tobin’s Q-ratio measures the market value of a company’s assets divided by its replacement costs. The higher the ratio, the higher the cost resulting in lower returns going forward.
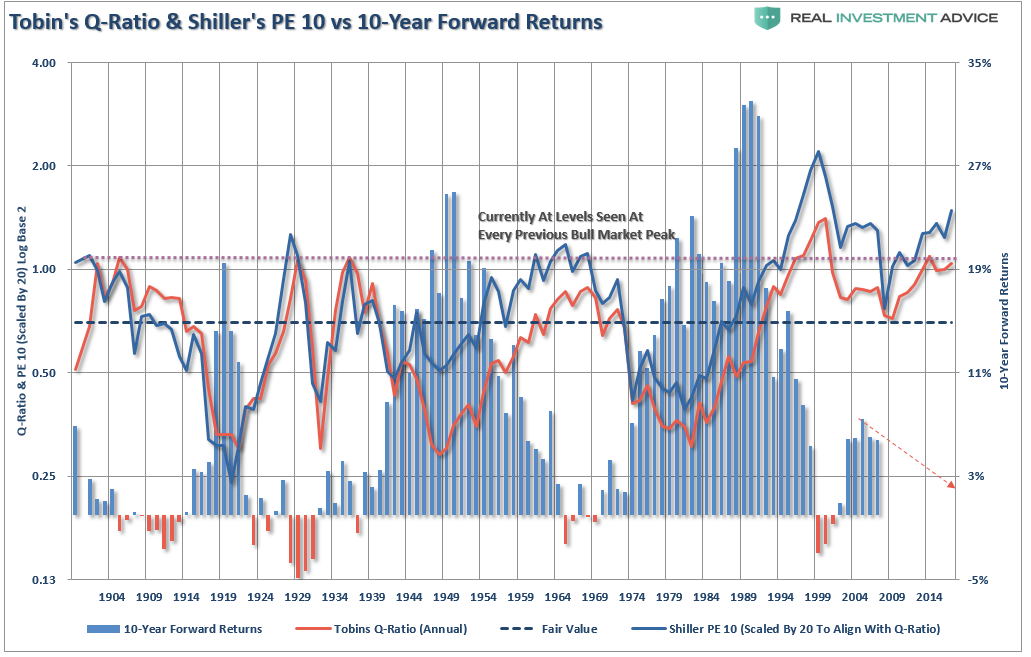
Just as a comparison, I have added Shiller’s CAPE-10. Not surprisingly the two measures not only have an extremely high correlation, but the return outcome remains the same.
One of the arguments has been that higher valuations are okay because interest rates are so low. Okay, let’s take the smoothed P/E ratio (CAPE-10 above) and compare it to the 10-year average of interest rates going back to 1900.
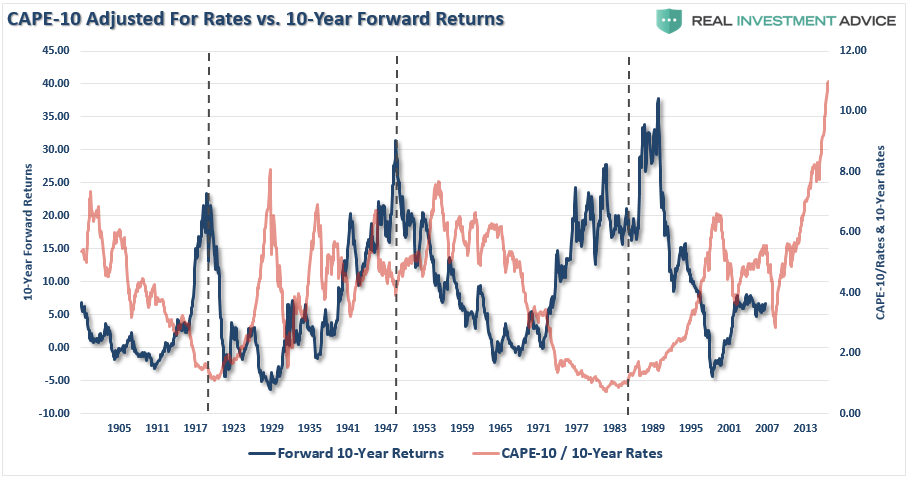
The analysis that low rates justify higher valuations clearly does not withstand the test of history.
But earnings can be manipulated, so let’s look at “sales” or “revenue” which occurs at the top-line of the income statement. Not surprisingly, the higher the level of price-to-sales, the lower the forward returns have been. You may also want to notice the current price-to-sales is pushing the highest level in history as well.

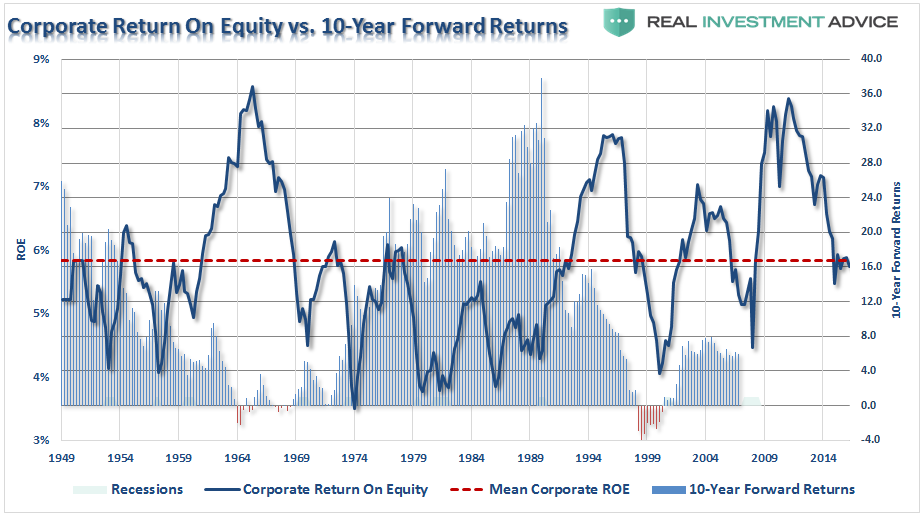
Corporate return on equity (ROE) sends the same message.
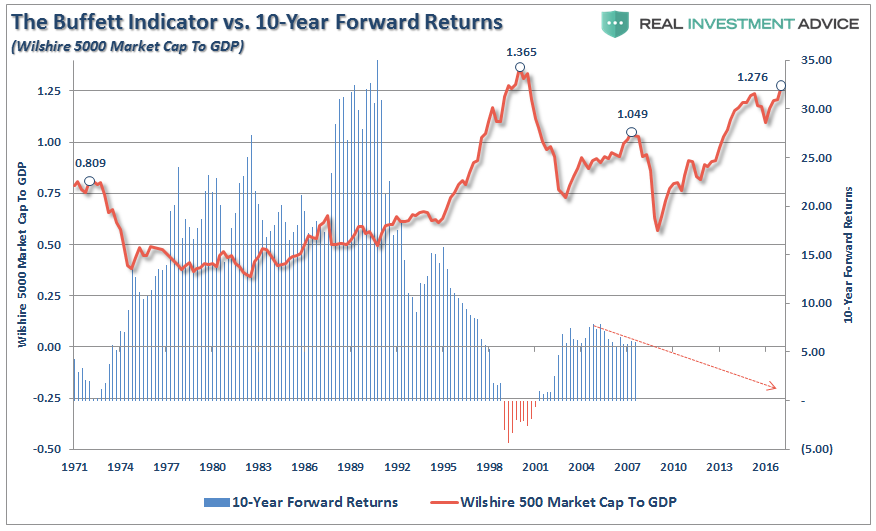
Even Warren Buffett’s favorite indicator, market cap to GDP, clearly suggests that investments made today, will have a rather lackluster return over the next decade.
If we invert the P/E ratio, and look at earnings/price, or more commonly known as the “earnings yield,” the message remains the same.
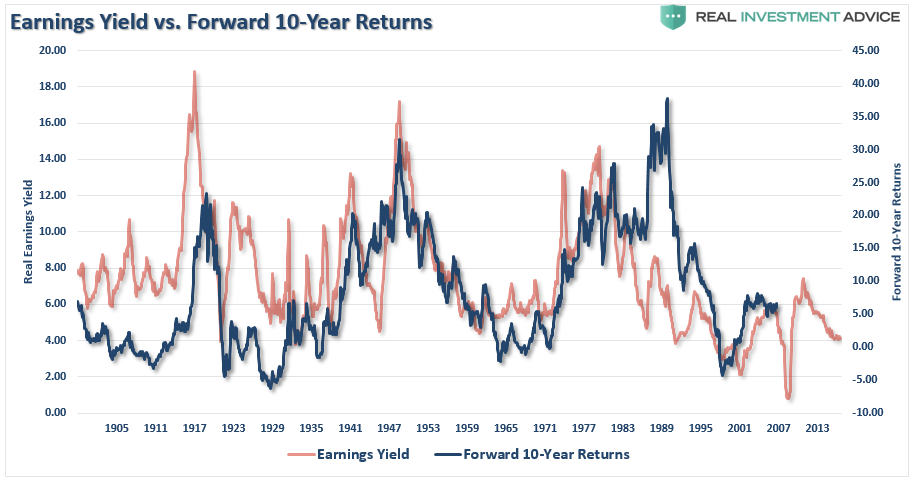
No matter, how many valuation measures I use, the message remains the same. From current valuation levels, the expected rate of return for investors over the next decade will be low.
There is a large community of individuals which suggest differently as they make a case as to why this “bull market” can continue for years longer. Unfortunately, any measure of valuation simply does not support that claim.
But let me be clear, I am not suggesting the next “financial crisis” is upon us either. I am simply suggesting that based on a variety of measures, forward returns will be relatively low as compared to what has been witnessed over the last eight years. This is particularly the case as the Fed, and Central Banks globally, begin to extract themselves from the cycle of interventions.
This does not mean that markets will just produce single-digit rates of return each year for the next decade. The reality is there will be some great years to be invested over that period, unfortunately, like in the past, the bulk of those years will be spent making up the losses from the coming recession and market correction.
That is the nature of investing in the markets. There will be fantastic bull market runs as we have witnessed over the last 8-years, but in order for you to experience the up, you will have to deal with the eventual down. It is just part of the full-market cycles that make up every economic and business cycle.
Despite the hopes of many, the cycles of the market, and the economy, have not been repealed. They can surely be delayed and extended by artificial interventions, but they can not be stalled indefinitely.
No. “This time is not different,” and in the end, many investors will once again be reminded of this simple fact:
“The price you pay today for any investment determines the value you will receive tomorrow.”
Unfortunately, those reminders tend to come in the most brutal of manners.