

Courtesy of Lance Roberts, Real Investment Advice
Well, I jinxed it.
In this past weekend’s missive I wrote:
“There are generally two events that happen every year – somebody forgets their coat, goggles or some other article of clothing needed for skiing, and someone visits the emergency clinic with a minor injury.”
The tradition continues as my wife fell and tore her ACL. The good news is she tore the right one three years ago, and after surgery is stronger than ever. Now she will get to do the left one.
But, while I was sitting in the emergency clinic waiting for the x-rays to be completed, I was sent a chart of the technology sector with a simple note: “Chart Of The Year.”
Chart Of The Year?
Yes, the technology sector has broken out to an all-time high. Yes, given the sector comprises roughly 25% of the S&P 500, it suggests that momentum is alive and well keeping the “bullish bias” intact. (We removed our hedges last week on the breakout of the market above the 50-dma on a weekly basis.)
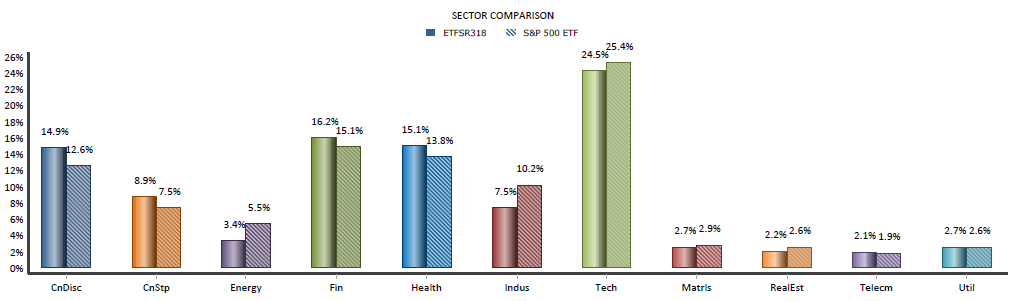
This is why we are currently only slightly underweight technology within our portfolio allocation models as shown below.
But why “the chart of the year” now? As shown below the technology sector has broken out to all-time highs several times over the last 18-months. What makes this one so special?
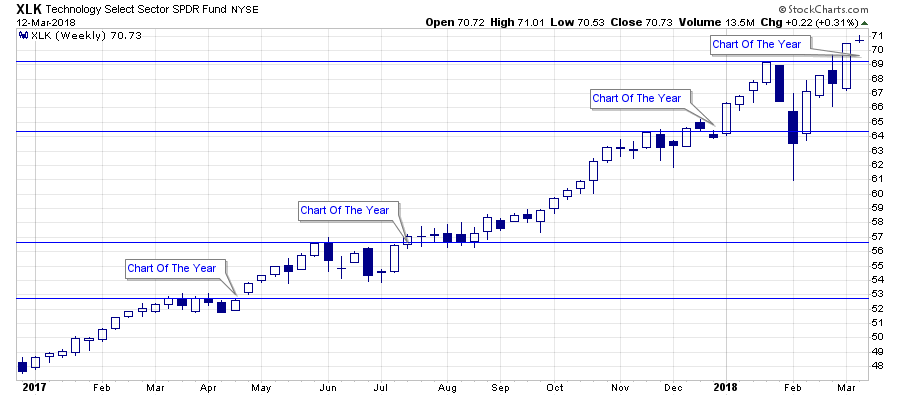
The Last Breakout
As stated, breakouts are indeed bullish and suggest higher prices in the short-term. This time is likely no different. However, breakouts to new highs are not ALWAYS as bullish as they seem in the heat of the moment. A quick glance at history shows there is always a “last” break out of every advance.
1999-2000

2007-2008

As I discussed yesterday, the technology sector is once again the darling of “Wall Street” just as it was at the peak of the previous two bull-markets.
“When we compare the fund to Shiller’s CAPE ratio, not surprisingly, since Technology makes up a quarter of the S&P 500 index, there is a high correlation between Technology and overall market valuation expansion and contraction.”
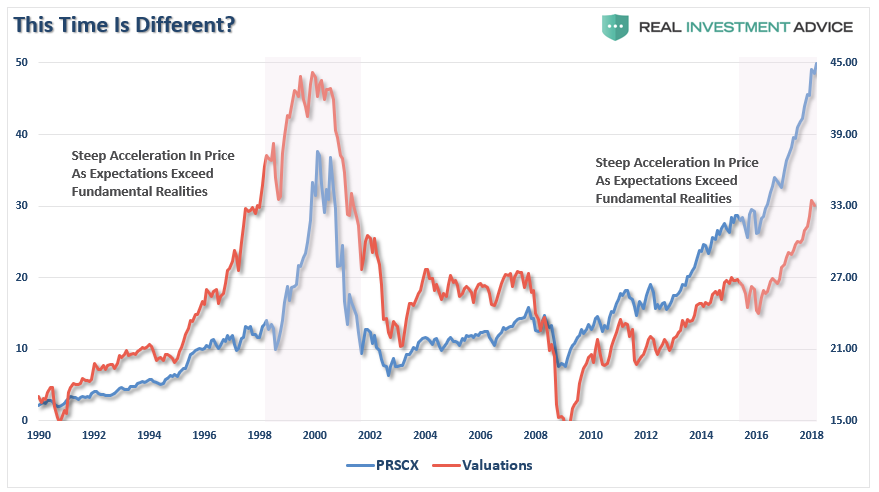
“As was the case in 1998-2000, the fund exploded higher as exuberance over the transformation of the world was occurring before our eyes. Investors globally were willing to pay “any price” to “get in on the action.” Currently, investors are once again chasing returns in the “FANG” stocks with little regard to underlying value. The near vertical ramp in the fund is reminiscent of the late 1990’s as valuations continue to escalate higher.”
I am not suggesting the current breakout is “THE” last breakout, and from a “trading perspective” the breakout is certainly bullish and should be bought.
However, from a long-term investing viewpoint, the problem is knowing the difference in a “breakout” and “the last breakout.”
In both previous instances, there were no warnings, no fanfare, or any glaring impediment to the technology sector, or the markets. Investors were bullishly optimistic, fully invested, margined, and willing to overlook fundamental valuation problems on the “hope” that “reality” would soon catch up with the price.
They were wrong on both previous occasions and suffered large losses of capital not soon thereafter.
Once again, we are witnessing the same mistakes being played out in “real time.”
But there is a “difference this time” as noted by the brilliant Harold Malmgren yesterday:
Central banks now own almost half of global GDP? Is this a market economy, or something else: Economies&markets guided by non-elected, supposedly independent wizards? pic.twitter.com/Fc6LWnzDeX
— Harald Malmgren (@Halsrethink) March 10, 2018
The importance of the point should not be overlooked as it has been the key source of liquidity pushing markets higher since 2009.
But that is now coming to an end via ZeroHedge:
“Yet the time of this unprecedented monetary experiment is coming to an end as we are finally nearing the point where due to a growing shortage of eligible collateral, the central bank support wheels will soon come off (the ECB and BOJ are still buying massive amounts of bonds and equities each month), resulting in gravity finally regaining control over the market’s surreal trendline.
It’s not just central banks, however: also add the one nation which 5 years ago we first showed has put the central bank complex to shame with the amount of debt it has injected in the global financial system: China.
Appropriately, this central bank handoff is also the topic of the latest presentation by Matt King, in which the Citi credit strategist once again repeats that “it’s the flow, not the stock that matters“, a point we’ve made since 2012, and underscores it by warning – yet again – that “both the world’s leading marginal buyers are in retreat.” He is referring to central banks and China, the world’s two biggest market manipulators and sources of capital misallocations.”

With markets heavily leveraged, global growth beginning to show signs of deterioration, breakeven inflation rates falling, and liquidity support being removed – the markets have yet to recognize the change.
So, yes, the breakout in the Technology sector may indeed be the “Chart Of The Year” for 2018. But not for the reason as touted by the overly optimistic “hopefuls,” rather because this could very well mark the “last breakout” of this particular bull market cycle.
Just something to consider.