


A Beginner’s Guide to Option Pricing
Part 4 – When the Crowd Takes Over: Reading a Highly Liquid Option Chain
A Real-World Example Using NVIDIA (NVDA)
In Part 3, we examined the option chain of Veeva Systems (VEEV), a stock with a relatively quiet options market. That example illustrated how pricing models and market makers influence option prices when relatively few investors are actively trading a particular contract. The bid-ask spreads were wide, trading volume was modest, and the market maker’s theoretical pricing models played a significant role in determining where trades occurred.
NVIDIA provides an almost perfect contrast.
Like VEEV, NVIDIA options are ultimately priced using the same mathematical principles we discussed in Parts 1 (Theoretical Value) and 2 (Implied Volatility). Market makers are still providing liquidity, and they’re still relying on sophisticated pricing models descended from Black-Scholes to estimate an option’s theoretical value. What changes is the number of investors participating.
NVIDIA has become one of the most actively traded stocks in the world, and its options market reflects that popularity. Thousands of retail investors, hedge funds, institutions, professional traders, and algorithmic trading firms are all buying and selling options throughout the day, so supply and demand exert a much greater influence over prices than they did in our VEEV example.
The option chain therefore becomes more than simply a list of prices. It becomes a record of where investors are concentrating their attention, where they’re placing their money, and, to some extent, what they believe is likely to happen over the next few days.
Before we examine the prices themselves, it’s worth looking at two columns that many beginning investors tend to overlook: volume and open interest. These numbers tell us something that option prices alone cannot.
What Volume and Open Interest Tell Us
Volume measures how many option contracts traded during the current trading session. If 10,000 July 17 $205 calls changed hands today, today’s volume for that contract is 10,000.
Open interest represents the number of option contracts that currently exist and remain open. It’s not a measure of today’s activity, but rather the number of outstanding contracts that haven’t yet been closed, exercised, or allowed to expire.
The distinction matters because the two numbers answer different questions: volume tells us where traders are active today, while open interest tells us where positions have accumulated over time.
Imagine a newly listed option strike that has never traded before. Open interest begins at zero. If one investor buys 100 contracts from another investor who is opening a new position, open interest becomes 100. If those same 100 contracts change hands several more times during the following week, volume continues increasing each day, but open interest may remain unchanged, since no new contracts have been created — the existing contracts are simply moving from one owner to another.
Professional traders look at both numbers together because they provide context that prices alone cannot. High trading volume tells us investors are actively interested in a particular strike price today; large open interest tells us many investors already have positions there. Once you start paying attention to these columns, an option chain begins revealing much more than simply what options cost.
Looking at NVIDIA’s Option Chain
The option chain below shows NVIDIA options expiring on Friday, July 17, with the stock trading at $206.17 as of midday Monday, July 13.
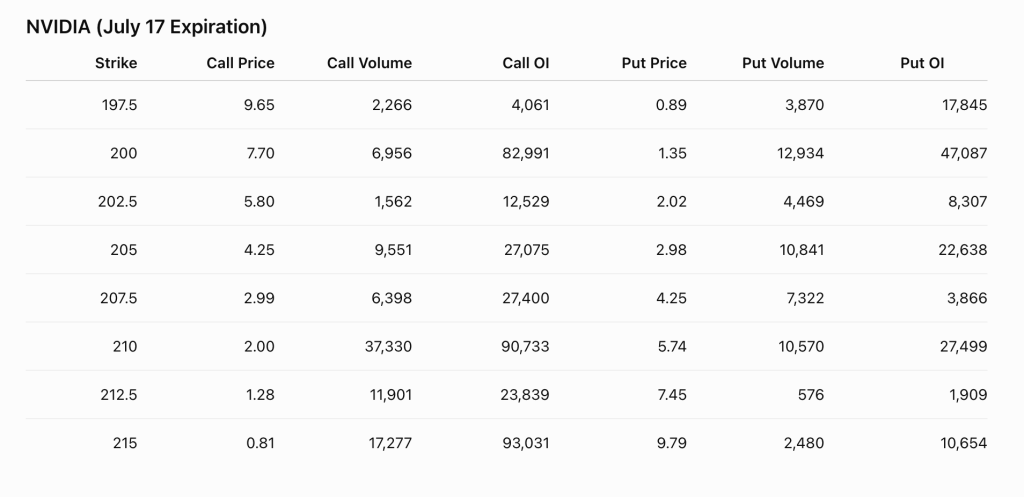
At first glance, the numbers may seem overwhelming. It helps to approach the option chain the way many professional traders do: start by identifying the strike price closest to the current stock price.
With NVIDIA trading around $206, the $205 strike becomes the natural place to begin. Options nearest the current stock price usually contain the greatest amount of time value while also beginning to acquire intrinsic value, so they often provide the clearest picture of how the market is currently pricing uncertainty.
At that strike, the July 17 $205 calls traded approximately 9,551 contracts during the session (at the time of this writing) and had 27,075 contracts of open interest. The corresponding $205 puts traded approximately 10,841 contracts and carried 22,638 contracts of open interest.
Those are remarkably large numbers compared with the VEEV example. Recall that VEEV’s $190 calls traded only 28 contracts during the entire trading day, while the corresponding puts traded only 23 contracts. NVIDIA’s option chain is operating on an entirely different scale.
Even before examining prices, we can conclude that this is a highly competitive marketplace where buyers and sellers are continuously entering and leaving positions throughout the day. Instead of relatively few participants relying heavily on market makers to provide liquidity, thousands of investors are actively determining where prices settle.
That difference explains why NVIDIA’s bid-ask spreads are so much narrower than VEEV’s. The July 17 $205 calls were quoted at approximately $4.20 bid and $4.30 ask, a spread of only 10 cents. The corresponding puts traded with a spread of only 3 cents, quoted around $2.96 bid and $2.99 ask. Compare that with VEEV, where both the calls and puts carried spreads of roughly 80 cents.
The narrower spreads tell us that market makers are facing much less risk. Because buyers and sellers are constantly entering the market, market makers can usually offset positions very quickly instead of carrying inventory for long periods, which lets them quote much tighter markets while still earning a return for providing liquidity.
The Option Chain Also Reveals Investor Behavior
One of the most interesting things about a highly liquid option chain is that it begins revealing something about the people participating in the market.
Notice, for example, the activity at the $210 strike. The July 17 $210 calls traded approximately 37,330 contracts during the day, with open interest exceeding 90,000 contracts. The corresponding $210 puts, by comparison, traded about 10,570 contracts, with open interest of roughly 27,500 contracts.
Why would one side of the option chain attract more than three times as much trading activity as the other? The answer has less to do with mathematics than with the different reasons investors use options.
Many retail investors are naturally attracted to call options because they provide leveraged exposure to rising stock prices — buying a call lets an investor participate in potential upside while risking only the premium paid for the option. NVIDIA has developed a reputation for making large price moves over relatively short periods, making it particularly attractive to traders looking for upside participation.
Put buyers often have different objectives. Some are speculating on a decline, but many are purchasing puts as portfolio insurance. Institutional investors frequently buy puts to protect large stock positions they already own, while other professional traders use puts as part of more complex multi-leg strategies. Their trading tends to be spread across multiple strike prices and expiration dates rather than concentrated in a single contract.
The result is an option chain that reflects not only mathematical pricing models, but also the different motivations of the investors participating in the market. This is one of the reasons option chains become so fascinating once you learn how to read them — every row represents buyers and sellers making decisions for different reasons. Some are speculating. Some are hedging. Some are generating income. Others are managing the risks of portfolios worth hundreds of millions of dollars. The prices we see on the screen are ultimately the result of all those competing objectives coming together in a single marketplace.
Reading the Prices
Now that we’ve looked at the trading activity, let’s return to the question that started this entire series: why aren’t the calls and puts priced the same?
At the time these prices were recorded, the July 17 $205 call was trading at approximately $4.25, while the corresponding $205 put was trading near $2.98. At first glance, that difference may seem surprising — both contracts have the same strike price and the same expiration date, so why should one be worth substantially more than the other? The answer is that several different factors are influencing the prices simultaneously.
The first is intrinsic value. Because NVIDIA was trading at $206.17, about $1.17 above the $205 strike, the call already possessed roughly $1.17 of intrinsic value — if the option expired immediately, its owner could exercise it and buy shares for $205 that were already worth $206.17. The put, on the other hand, had no intrinsic value, since there’d be no reason to exercise the right to sell shares for $205 when the market was already willing to pay more than that.
That explains part of the difference between the two prices, but not all of it. If intrinsic value were the only consideration, the call would trade only about $1.17 above the put. Instead, the actual gap is $1.27 — about 10 cents more.
To see where that extra 10 cents comes from, it helps to strip out intrinsic value entirely and look only at time value. The call’s time value is $4.25 − $1.17 = $3.08. The put’s time value is the entire put price, since it has no intrinsic value: $2.98. Those two numbers are remarkably close — within a dime of each other — and that’s not a coincidence.
Why Calls and Puts Move Together
At the same strike and expiration, call and put prices are locked together by a relationship known as put-call parity. Buying a call and selling a put at the same strike is, in effect, a way of synthetically recreating ownership of the stock itself. If that combination traded at a meaningfully different price than the stock, professional traders could buy the cheap side, sell the expensive side, and lock in a profit with no risk. That opportunity gets arbitraged away almost instantly, which is exactly why the call and put prices stay tied so closely together: the difference between them should track the difference between the stock price and the strike price, which here is $206.17 − $205 = $1.17 — very close to the $1.27 we actually see.
This also answers a natural question: shouldn’t the put be cheaper, since the stock is currently trading $1.17 against it? The answer is that it already is — its time value ($2.98) is slightly lower than the call’s time value ($3.08). The put isn’t escaping a penalty; it’s simply that once intrinsic value is set aside, calls and puts at the same strike are priced almost identically, because arbitrage won’t allow them to drift far apart.
The remaining ten cents comes mostly from interest rates. Owning the stock outright ties up capital, while owning a call lets an investor control the same shares while keeping that capital free to earn interest elsewhere. That difference gives calls a small structural edge over puts, beyond intrinsic value alone — larger when interest rates are higher or more time remains until expiration. With short-term rates around 5% and only a few days left before expiration, that effect works out to roughly a dime, which is almost exactly the gap left over here.
Time Value Still Reflects Uncertainty
Even with only several days remaining until expiration, both the call and the put carry meaningful time value, and that time value still reflects the market’s estimate of how much uncertainty remains before Friday’s expiration. NVIDIA is well known for making large price moves over short periods, and investors understand the stock could easily move several dollars before expiration. Someone buying the $205 call is paying not only for its existing intrinsic value but also for the possibility that NVIDIA could move much higher before expiration, while someone buying the $205 put is paying for the possibility that the stock reverses sharply lower.
As expiration approaches, that uncertainty steadily disappears. Every passing day leaves less time for the unexpected to happen, and as we discussed in Part 2, time value gradually decays toward zero. By expiration, every option consists entirely of intrinsic value — or no value at all.
This is also why buying short-dated options carries a particular kind of risk: because so little time remains, there’s little room for a wrong-direction move to correct itself before expiration. If the stock doesn’t move the way a buyer expects, the time value they paid for can evaporate quickly, with little time left for the position to recover.
Why Liquidity Changes Everything
In the VEEV example, relatively little trading occurred throughout the day. Under those circumstances, the market maker’s pricing models exerted considerable influence over where options traded, since there simply weren’t enough competing orders to move prices very far from their theoretical values.
NVIDIA operates differently. Thousands of investors are continuously expressing opinions through their trades — some believe the stock is likely to rally, others expect it to decline. Some institutions are purchasing puts to hedge large stock positions, other investors are selling covered calls to generate income, short-term traders are opening and closing speculative positions throughout the day, and professional firms are executing complex option strategies involving multiple strike prices and expiration dates.
Every one of those transactions affects supply and demand. The market makers are still quoting prices based on sophisticated pricing models, but they’re also constantly responding to customer order flow: if aggressive buying suddenly appears in the calls, call prices begin moving higher; if institutions begin accumulating protective puts, put prices respond as well. Rather than determining prices by themselves, market makers are continuously adjusting their quotes to reflect what the marketplace is actually doing. That’s one of the defining characteristics of a highly liquid options market.
What the Option Chain Is Telling Us
The option chain gives us far more information than simply what options are currently trading for. It shows us where investors are concentrating their trades, which strike prices are attracting the greatest interest, and where large positions have accumulated over time. It also reveals whether trading activity is increasing or fading, and whether today’s volume is unusually heavy relative to existing open interest.
Perhaps most importantly, it helps us recognize whether option prices are being influenced primarily by mathematical pricing models or by intense competition among buyers and sellers. The option chain is, in many ways, a snapshot of one of the largest continuous auctions in the financial markets.
Bringing the Three Forces Together
At the beginning of Part 1, we introduced three forces that determine every option price: mathematics, professional market makers, and ordinary buyers and sellers.
Pricing models estimate an option’s theoretical value using the stock price, time remaining until expiration, interest rates, dividends, and implied volatility. Market makers provide liquidity by standing ready to buy and sell options while continuously adjusting their quotes to manage their own risk. And the marketplace itself — every investor who buys or sells an option — contributes to the final price.
The difference between VEEV and NVIDIA isn’t that one follows different pricing rules than the other. Both markets operate according to exactly the same principles; the difference lies in which of those three forces exerts the greatest influence. In VEEV, pricing models and market makers play the dominant role because relatively few investors are actively trading the options. In NVIDIA, the mathematical models still provide the foundation and market makers still provide liquidity, but the sheer number of investors participating means supply and demand become a much more powerful influence on the prices that ultimately appear on the screen.
Understanding that distinction is one of the most important lessons in options trading.
Looking Ahead
When this series began, the question seemed deceptively simple: who decides what an option is worth?
We’ve shown that the answer is more complicated than most investors realize. An option’s price isn’t produced by a single mathematical formula, nor is it determined solely by buyers and sellers. It emerges from the interaction of pricing models, market makers, and the marketplace itself. Every option chain reflects those three forces working together, though their relative importance changes from one stock to another, and even from one particular option to another.
Recognizing which force is dominating at any given time is one of the first steps toward becoming a more informed option trader.
*****
A Beginner’s Guide to Option Pricing: Complete Series Index
1. A Beginner’s Guide to Option Pricing – Part 1 (Theoretical Value)
https://www.philstockworld.com/2026/07/11/who-decides-what-an-option-is-worth/
2. A Beginner’s Guide to Option Pricing – Part 2 (Implied Volatility)
https://www.philstockworld.com/2026/07/12/who-decides-what-an-option-is-worth-part-2/
3. A Beginner’s Guide to Option Pricing – Part 3 (Thinly Traded Options)
https://www.philstockworld.com/2026/07/12/a-beginners-guide-to-option-pricing-part-3/
4. A Beginner’s Guide to Option Pricing – Part 4 (Liquid Options)
https://www.philstockworld.com/2026/07/13/a-beginners-guide-to-option-pricing-part-4/
5. A Beginner’s Guide to Option Pricing – Part 5 (Put-Call Parity)
https://www.philstockworld.com/2026/07/14/a-beginners-guide-to-option-pricing-part-5/
6. A Beginner’s Guide to Option Pricing – Part 6 (Delta)
https://www.philstockworld.com/2026/07/15/a-beginners-guide-to-option-pricing-part-6-delta/
7. A Beginner’s Guide to Option Pricing – Part 7 (Gamma)
https://www.philstockworld.com/2026/07/15/a-beginners-guide-to-option-pricing-part-7-gamma/
8. A Beginner’s Guide to Option Pricing – Part 8 (Theta)
https://www.philstockworld.com/2026/07/16/a-beginners-guide-to-option-pricing-part-8-theta/
9. A Beginner’s Guide to Option Pricing – Part 9 (Vega)
https://www.philstockworld.com/2026/07/17/a-beginners-guide-to-option-pricing-part-9-vega/

