

Courtesy of Chris Kimble.
CLICK ON CHART TO ENLARGE
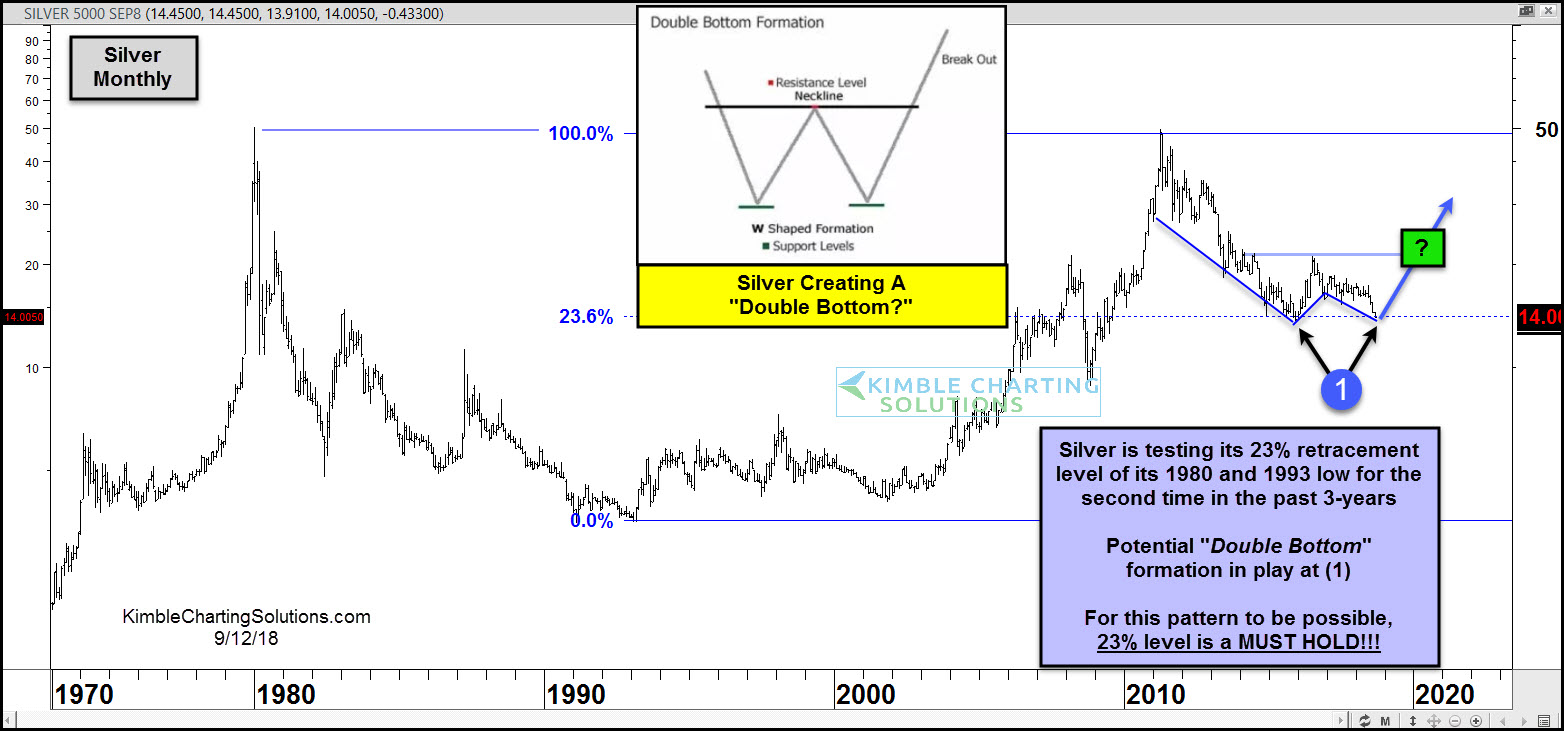
Could Silver be creating a long-term “Double Bottoming” pattern over the past 3-years? Let’s investigate the possibility and what it would take for the potential bullish pattern to fail.
Before we get started let me make this point clear; the trend in Silver since the highs in 2011 remains down!
This chart looks at Silver on a monthly basis over the past 45-years, where we applied Fibonacci retracement levels to its 1980 highs and 1993 lows. The 23% Fibonacci retracement level comes into play at the $14 level.
The 23% level was hit a couple of years (2016), where a 40% counter-trend rally took place. Weakness since the counter-trend high has it testing the 23% level again at (1), where it could be creating a “Double Bottom” formation. While it is testing this key retracement level for the 2nd time, smart money silver hedgers have a huge bet in play it will rally.
What would eliminate the potential that that Double bottom pattern failed? A simple break of the 23% level!
If you would like to invest in Gold, Silver, Copper and the Miners, we would be honored if you were a Metals Member. We are of the opinion some of the best opportunities/inflection points in years for the metals sector are in play!
–
To become a member of Kimble Charting Solutions, click here.