

Courtesy of Chris Kimble.
CLICK ON CHART TO ENLARGE
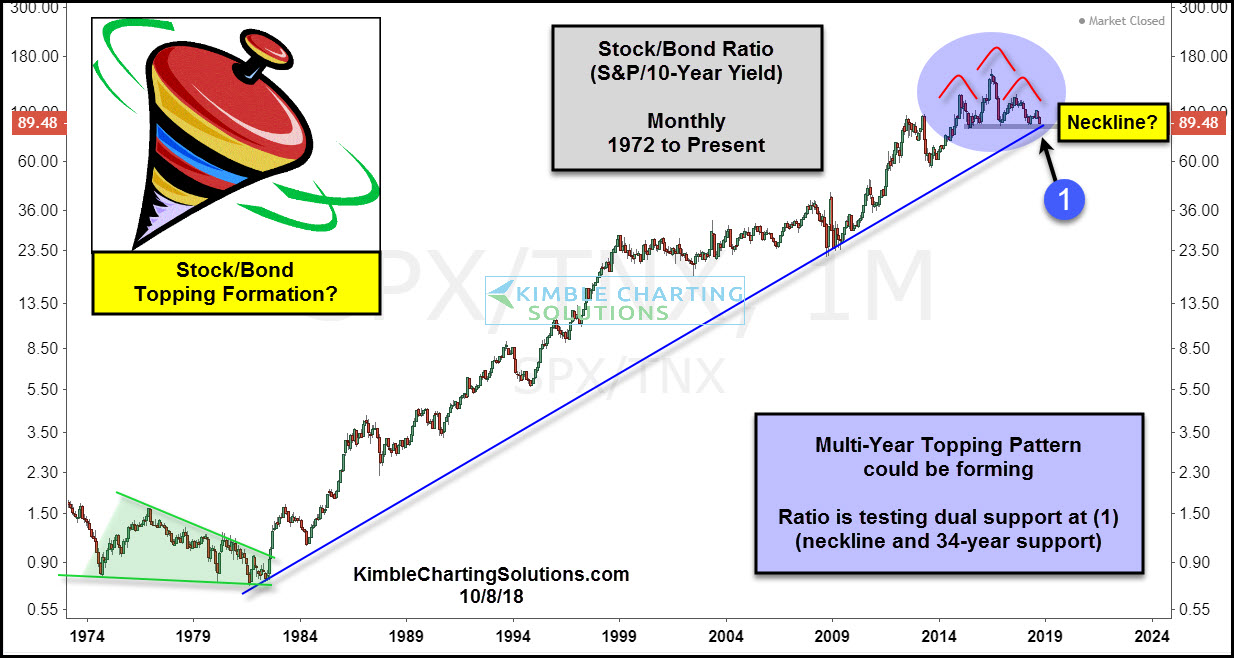
This chart compares the relative strength of Stocks to bonds by creating the S&P 500/10-Year yield ratio (SPX/TNX) on a monthly basis, since the mid-1970’s.
The stock/bond ratio’s trend has been up for the past 34-years, following a resistance breakout in the early 1980’s. Nothing of late has changed this long-term bullish trend. Currently, the long-term trend is experiencing a major support test right now at (1).
Over the past 3-years, the ratio has traded sideways, where it could be creating a “head & shoulders topping pattern.” Softness in the ratio of late has it testing 34-year rising support and potential neckline support at the same time at (1).
At this time support is support!!! If fails to hold it would be suggesting a long-term trend change is in play.
What the ratio does with support will send very a very important message to Stocks, Bonds, and asset allocation models!
–
To become a member of Kimble Charting Solutions, click here.