

Courtesy of Chris Kimble.
CLICK ON CHART TO ENLARGE
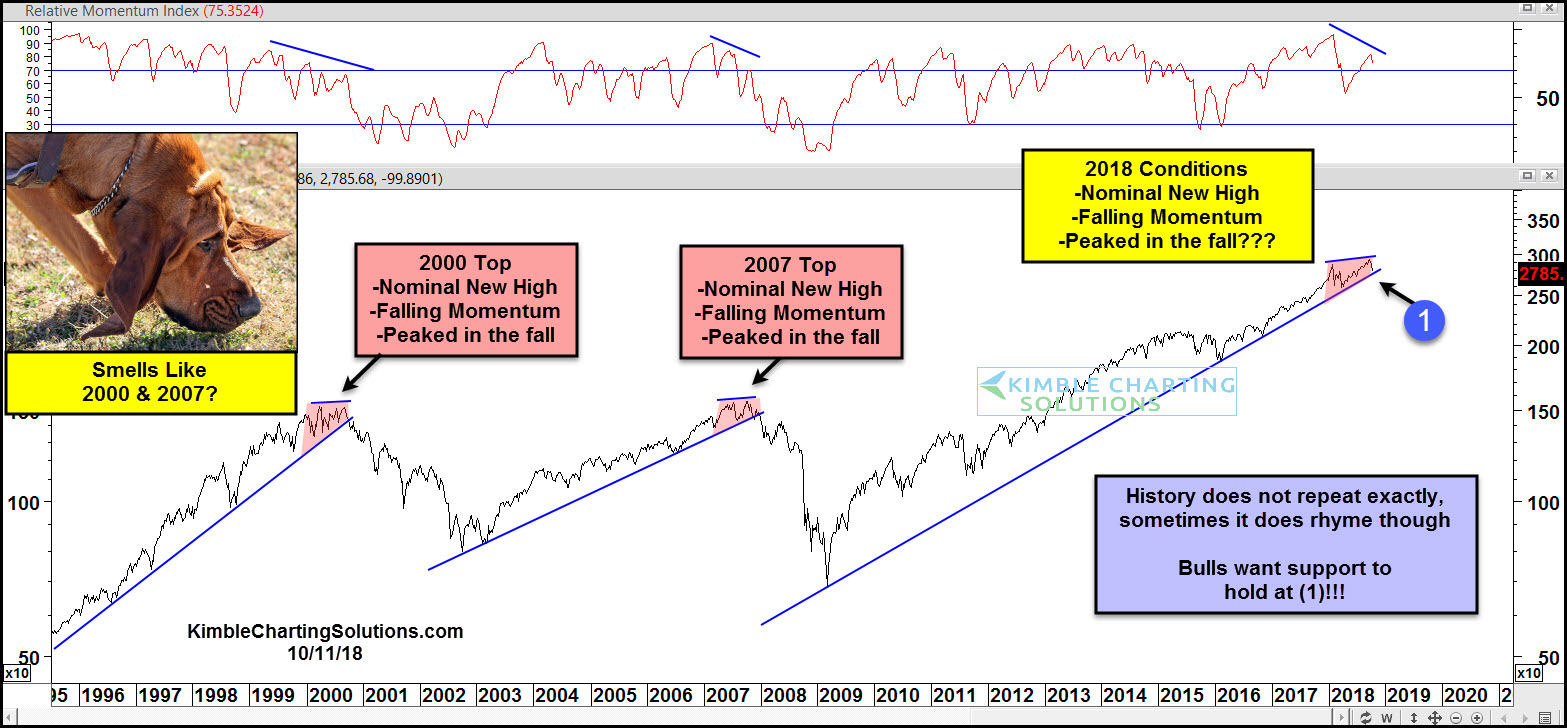
Did the top in the S&P 500 in 2007, have anything in common with the 2000 top? Yes!
In 2000 the S&P made a nominal new high near the first day of fall, as monthly momentum was creating lower highs. Once it broke support selling pressure increased.
In 2007 the S&P made a nominal new high near the first day of fall, as monthly momentum was creating lower highs. Once it broke support selling pressure increased.
Lately, the S&P made a nominal near the first day of fall, as monthly momentum was creating lower highs.
History doesn’t repeat exactly, yet it can rhyme from time to time. One of my favorite quotes comes to mind when looking at the above patterns; “The odds of a repeat are LOW, yet the impact would be big if it does!”
Line (1) represents very strong support off the 2009 lows! Regardless of a repeating pattern potential, one thing is for sure, stock bulls do not want to see support break at (1)!
–
To become a member of Kimble Charting Solutions, click here.