

Courtesy of Chris Kimble.
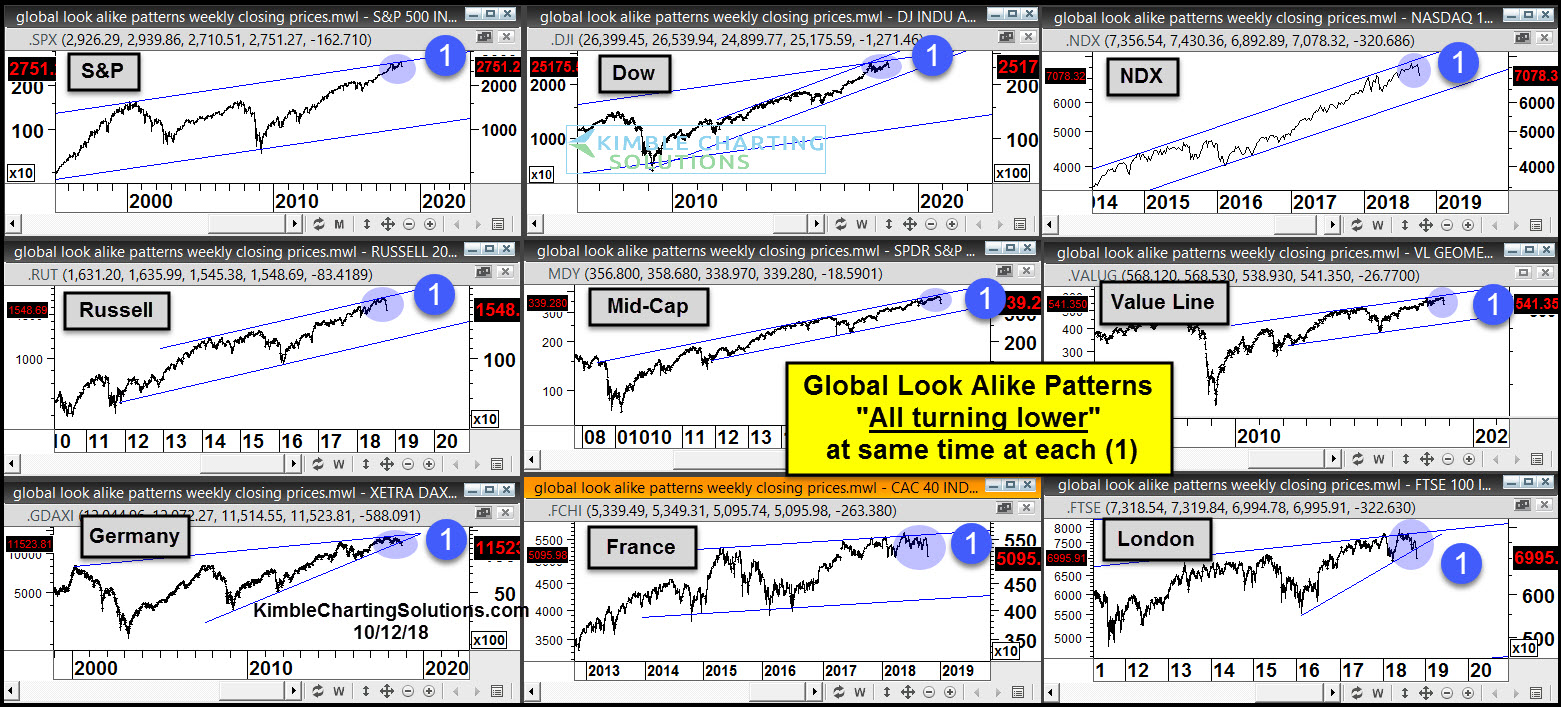
Over the past several weeks, I’ve shared several examples of key stock market indexes and indicators hitting long-term resistance. Today, we’ll do the same… but with a much wider lens. We’ll look at 9 different stock market indexes in the developed markets that look concerning.
When a stock or market index hits resistance, it has three possibilities: 1) to break out above resistance 2) to move sideways / consolidate near resistance 3) to turn lower and pullback or correct.
In the 9-pack of charts below, we are seeing bearish “look-alike” patterns emerging. And in each case, it looks like the given markets are turning lower (point 1).
The markets considered include 6 U.S. indexes and 3 European, including the S&P 500(NYSEARCA: SPY), Dow Jones Industrial Average (NYSEARCA: DIA), Nasdaq 100(NASDAQ: QQQ), Russell 2000 (NYSEARCA: IWM), Mid-Caps Index, Value Line Index, German DAX, French CAC 40, and London’s FTSE 100. It’s a pretty good glimpse at a portion of the developed markets.
If these markets see follow-through selling, investors could be in for a deeper decline.
9-Pack of Global Stock Market Indexes – Bears Growling?
CLICK ON CHART TO ENLARGE
This article was first written for See It Markets.com. To see original post CLICK HERE
To become a member of Kimble Charting Solutions, click here.