

Courtesy of Chris Kimble.
CLICK ON CHART TO ENLARGE
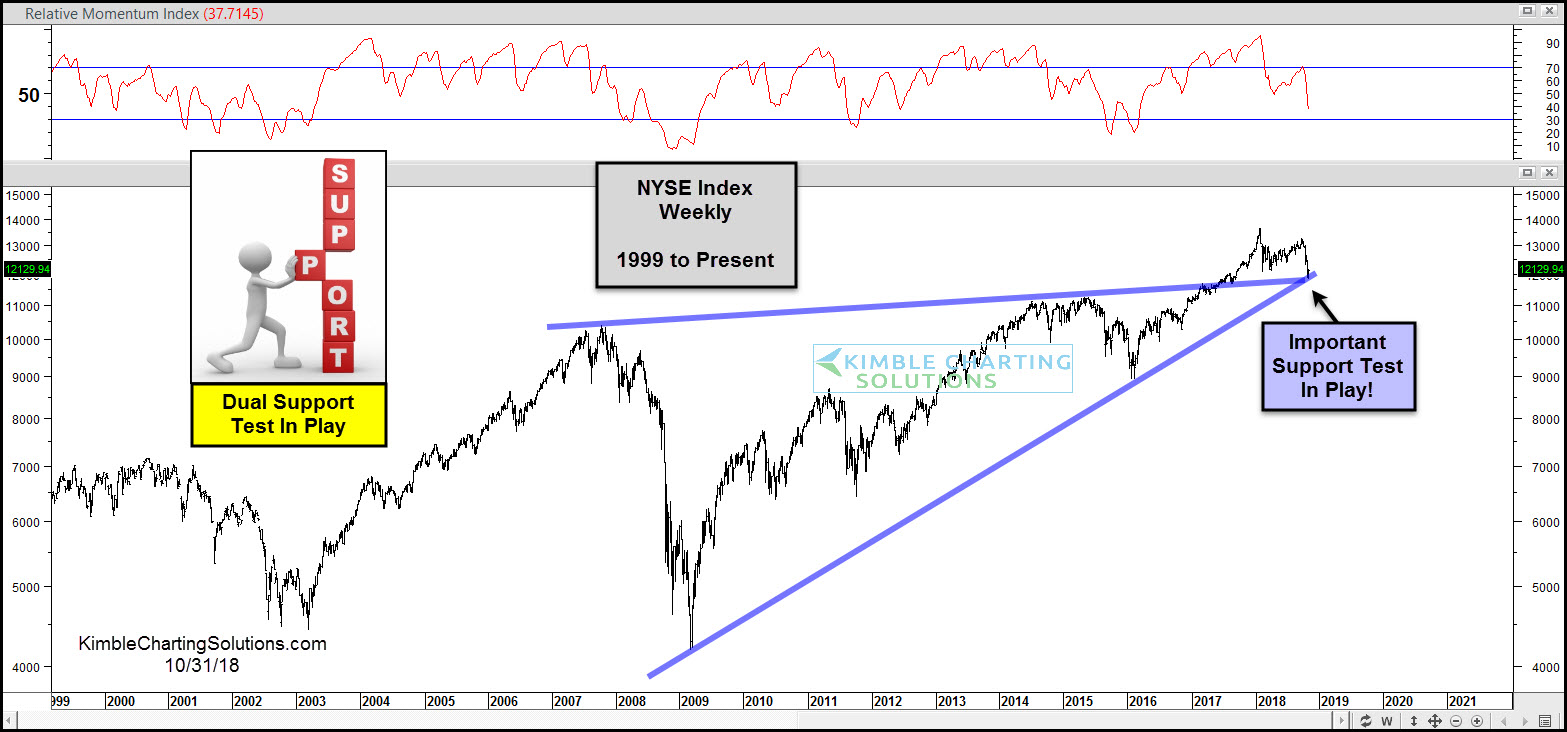
This chart looks at the NYSE Index over the past 20-years on a weekly basis. This very broad index has traded sideways for the past 15-months, while the long-term trend remains up.
Weakness this month finds the index testing dual long-term support as weekly momentum is creating lower highs as it nearing oversold levels.
Support is support until broken and this broad index is testing a very important support zone as October is coming to an end!
The long-term bull trend would get receive a concerning price message if dual support fails to hold.
–
To become a member of Kimble Charting Solutions, click here.