

Courtesy of Chris Kimble.
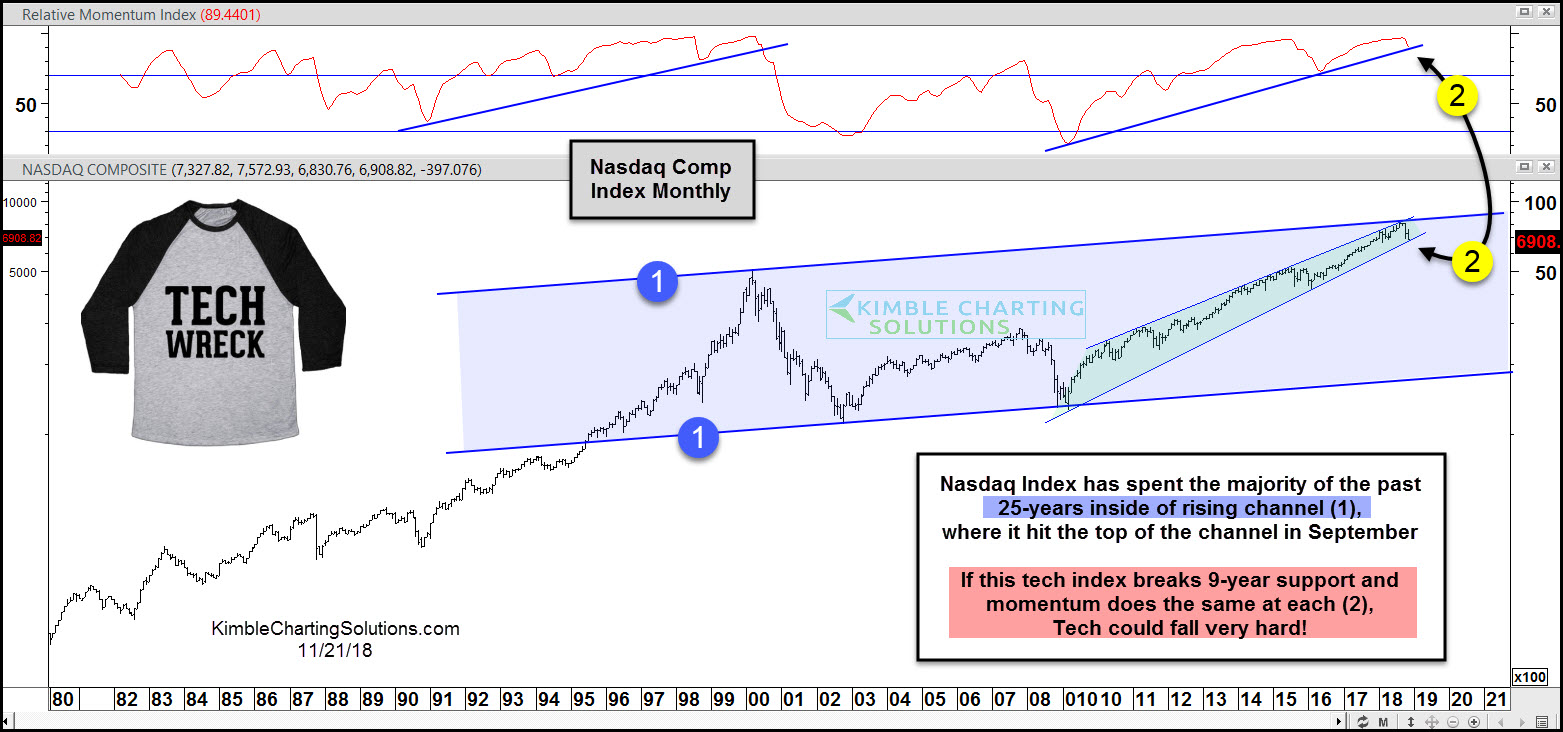
This chart looks at the Nasdaq Composite Index (IXIC) over the past 38-years. It has spent the majority inside of the past 25-years inside of rising channel (1).
The Long-term Trend in this index remains up, despite the softness of late.
The rally off the bottom of the channel that started in 2009, hit the top of the channel in September, as monthly momentum reached levels last seen in 2000. The price and momentum decline over the past 7-weeks has both testing 9-year rising support at (2).
Even though many feel Tech has been a wreck of late, its done nothing more than decline to test rising support.
The Power of the Pattern is of this opinion….If both support lines break to the downside at (2), the odds greatly increase that Tech sells off a large percent.
If Tech is to wreck, it most likely would get started on a dual break of support at (2)!
–
To become a member of Kimble Charting Solutions, click here.