

Courtesy of Chris Kimble.
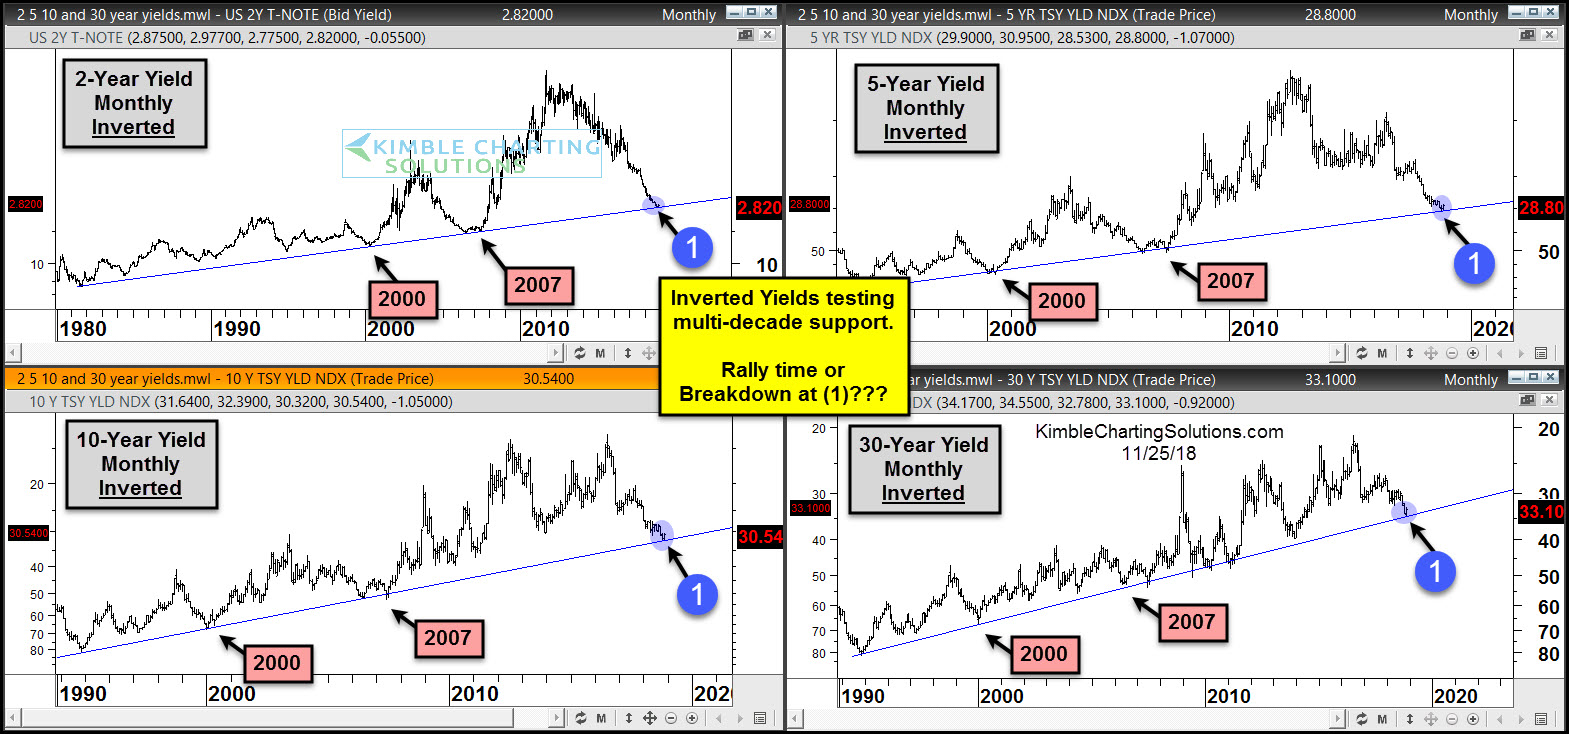
This 4-pack looks at short to long-term interest rates over the past few decades with a little twist, each chart is inverted (yields are upside down).
Each chart reflects that yields are testing multi-decade support at each (1).
These support lines were tested back in 2000 & 2000, where lows took place, which ended up being historical price points for bonds and stocks!
How will stocks react if support holds? How will stocks react if multi-decade support is broken to the downside?
What yields do at these multi-decade support points could be another historical inflection point for bonds and stocks!!!
–
To become a member of Kimble Charting Solutions, click here.