

Chris Kimble suggests that the S&P could be trading in a sideways pattern. The sideways pattern during 2015-2016 lasted two years. The sideways pattern now has lasted around 10 months. (I don't understand why Chris believes a resolution is nearing; perhaps it persists another year or so?) ~ Ilene
Courtesy of Chris Kimble.
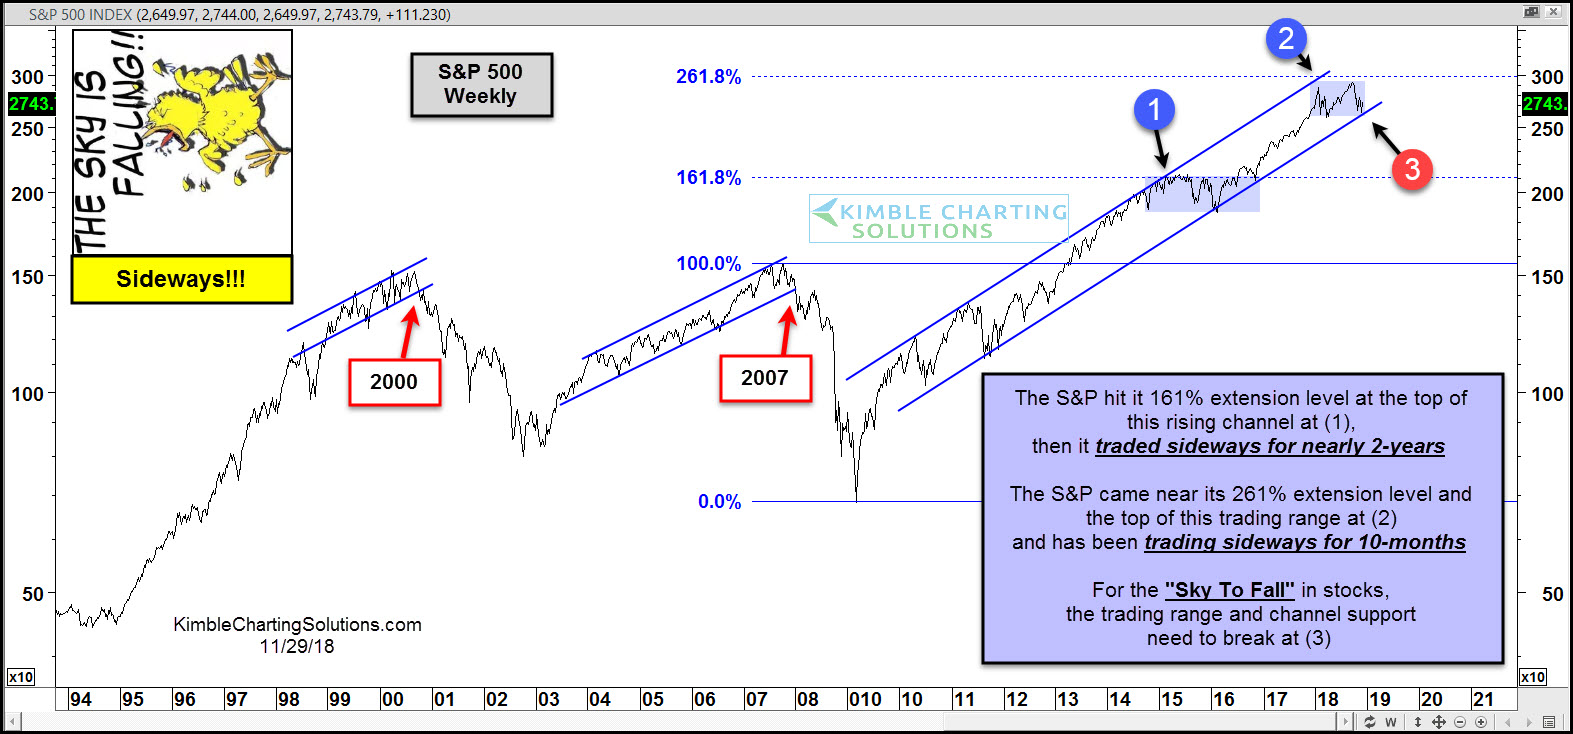
While many analysts are talking about the sky falling in stocks, the chart below reflects that the S&P 500 may simply be in a sideways trading range. As well, the S&P 500 remains within the uptrend channel (testing the lower support).
Seen this price action before? Yep, back in 2015-2016. At that point (1), the S&P 500 has just hit its 161.8% Fibonacci extension level at the top of the uptrend channel. That prompted a sideways trading range for 20-months.
This year, the S&P 500 hit its 261% Fibonacci extension level and has proceeded to trade sideways yet again at point (2). This has lasted 10 months thus far, but a resolution is nearing…
If the sky is to fall in stocks, the trading range and channel support need to break lower at point (3). If dual support breaks at (3), selling pressure in the S&P 500 could see itself 10% lower rather quickly.
As long as support holds, this bull is still alive. Stay tuned!
This article was first written for See It Markets.com. To see original post CLICK HERE.
–
To become a member of Kimble Charting Solutions, click here.