

Courtesy of Chris Kimble.
The stock market correction has morphed into a bear market for the Russell 2000(INDEXRUSSELL: RUT) and Nasdaq Composite (INDEXNASDAQ: .IXIC).
The S&P 500 (INDEXSP: .INX) and Dow Jones Industrials are nearing bear market territory, down 15 to 16 percent. Fear is in the air and investors are beginning to wonder what happened. If you follow my charts, you’ve seen several bearish reversal patterns and trend lines breaking down.
Today we look at two more: The S&P 500 and 5-Year Treasury Note Yield.
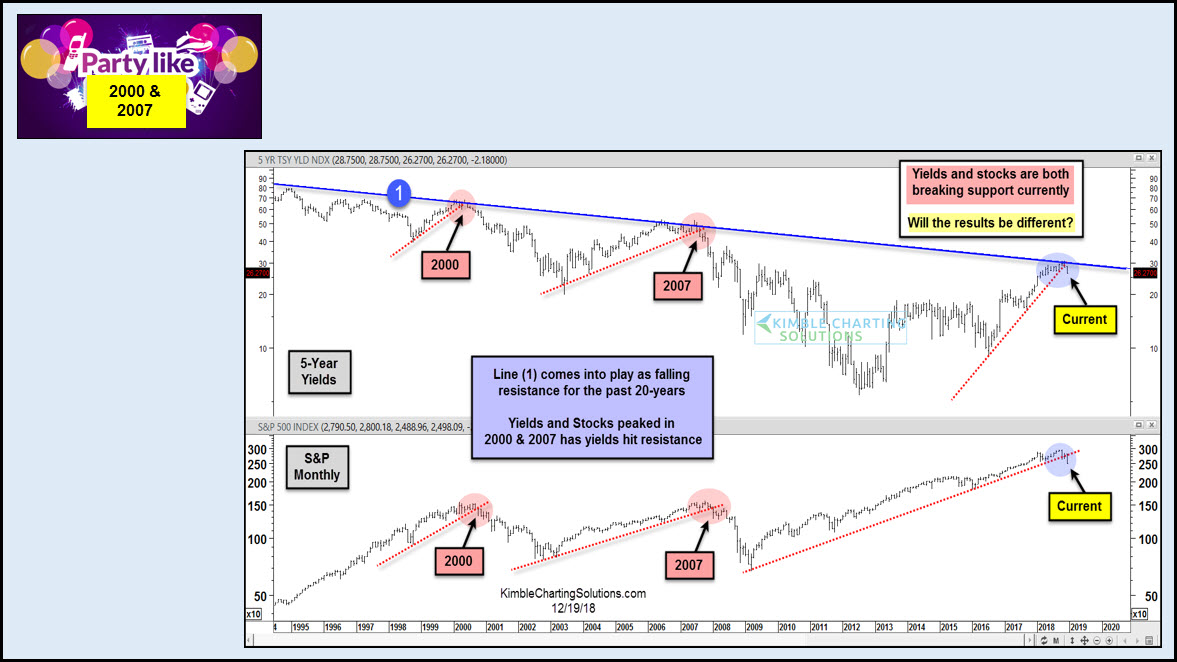
In the top pane of today’s chart, we track the 5-year yield over the past 20+ years. We can see that yields have been in a steady downtrend (1). And the last two times that yields have tested that trend line, it’s lead to a big decline in yields (see years 2000 and 2007). Also similar to 2000 and 2007 is that yields are breaking down below multi-year uptrends.
Same goes for stocks. As yields peak, investors worry about interest rates and price in an economic decline and fall in earnings. This shows up in the price action well before the actual “news”. In the bottom pane, we have the S&P 500. Note the 2000 and 2007 peaks. Stocks and bonds following suit. And once again, the S&P 500 is breaking a multi-year uptrend line.
Careful here!
S&P 500 “Monthly” Chart – 2000 & 2007 All Over Again?
This post was first written for See It Markets.com. To see original post CLICK HERE
–
To become a member of Kimble Charting Solutions, click here.