

Courtesy of Chris Kimble.
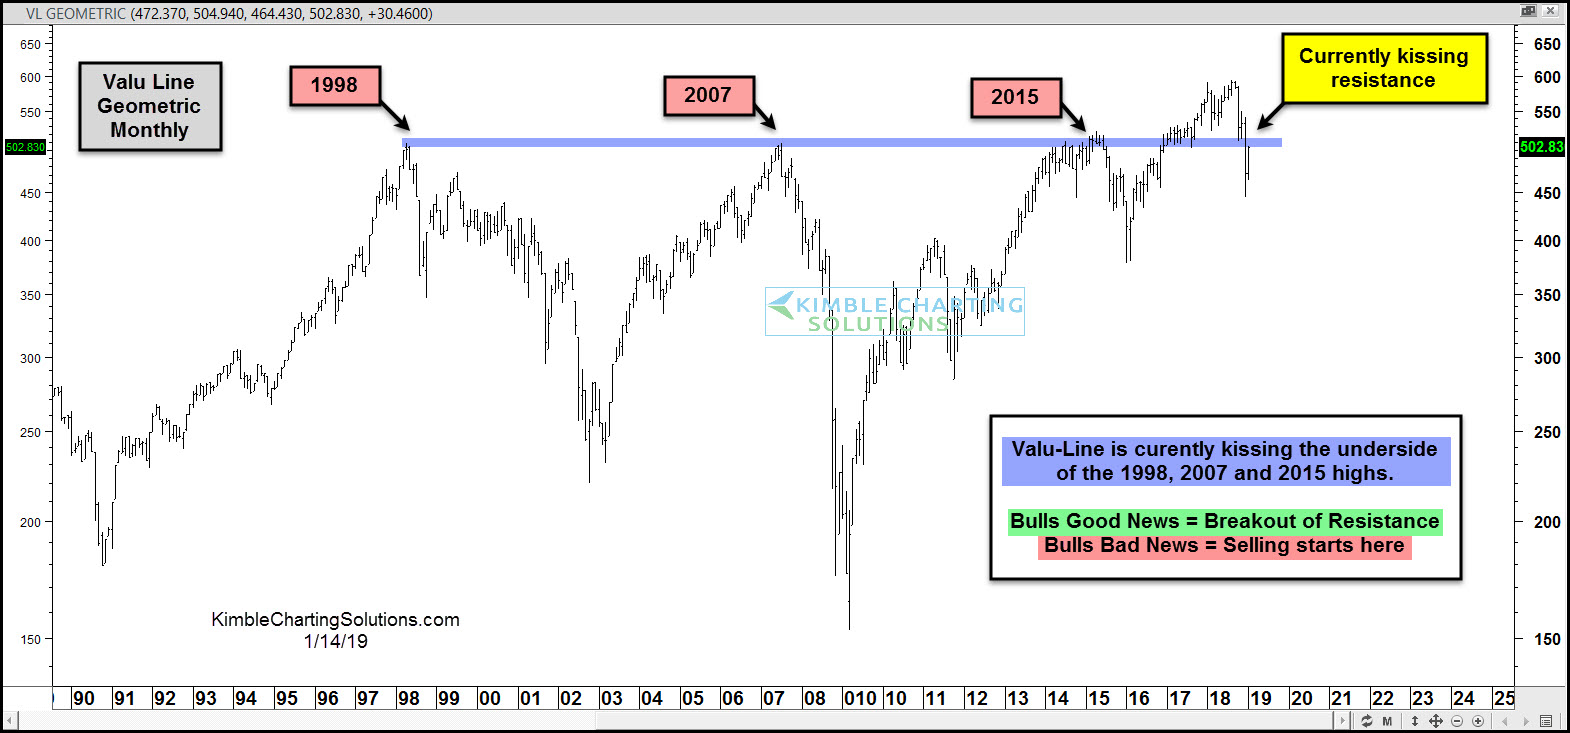
The Value Line Geometric Index tends to give investors a good idea of the health of the overall market. It is an equal-weighted index with a broad swath of stocks that gives investors an idea of how the “average stock” is performing.
The Value Line Geometric formed highs in the same area in 1998, 2007, and 2015 (see blue line). In the last two years, the index broke out above that line and held above it until the recent correction.
It is now testing the underside of that price area (now resistance). Bulls will get good news with a breakout ABOVE this resistance, while a failure BELOW resistance will be bad news.
Stay tuned. This is likely an important long-term price test for the average stock index.
This article was first written for See It Markets.com. To see original post CLICK HERE
–
To become a member of Kimble Charting Solutions, click here.