

Courtesy of Chris Kimble
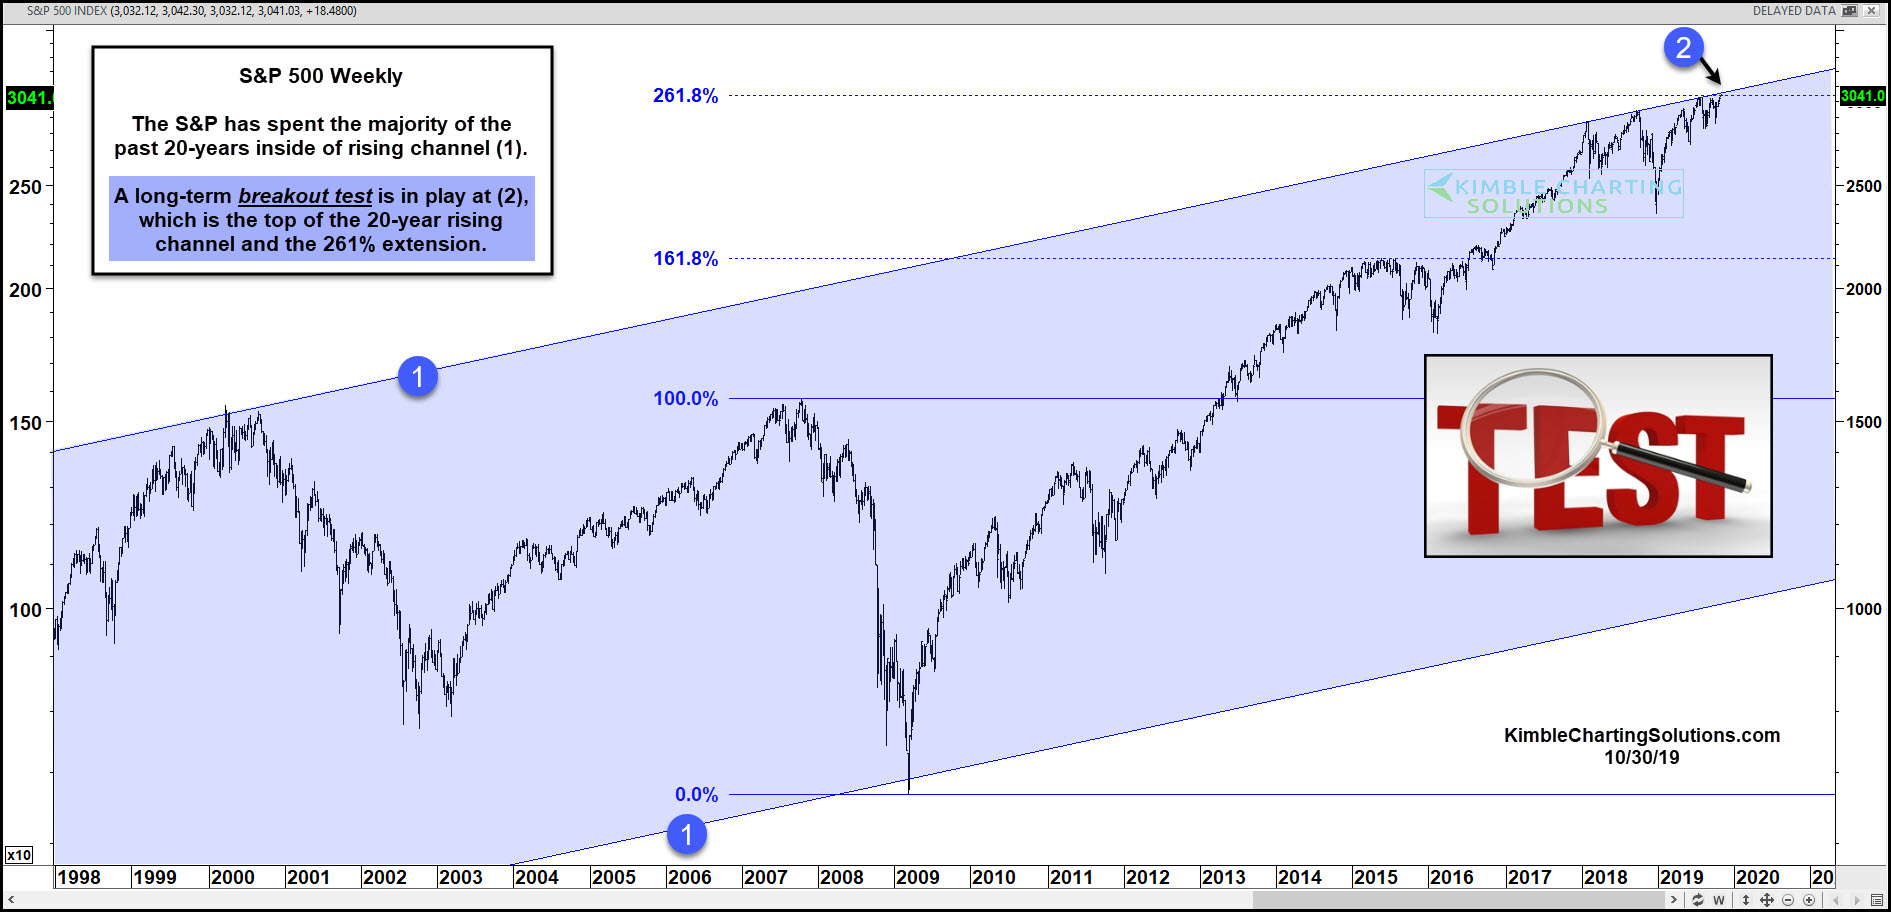
The S&P 500 Index appears to be setting up for an important breakout “TEST”.
Stock market bulls are cheering for a breakout, while bears are looking for a pullback off resistance.
In today’s chart, we look at the S&P 500 Index on a longer-term “weekly” basis.
As you can see, the S&P 500 has spent the majority of the past 20 years trading within a broad, rising price channel at each (1).
It is currently testing the top of this 20-year channel at (2). This area also happens to be the 261% Fibonacci price extension level of the 2007 highs and 2009 lows.
With the trend being up, this becomes a very important breakout test for the S&P 500!
Will the S&P 500 breakout? Or will bears turn prices lower? This is an important juncture for investors. Stay tuned!!
This article was first written for See It Markets.com. To see original post CLICK HERE
To become a member of Kimble Charting Solutions, click here.