
Month 5!
We have now been at war most of the year. That's how wars are, they start off as "operations" and then turn into the new routine. As with most of our wars - this one is happening very far away so we generally ignore it - except when there is inflation or shortages (jet fuel already) that impact our lives or when our children come home in body bags - thank God not much of that so far...
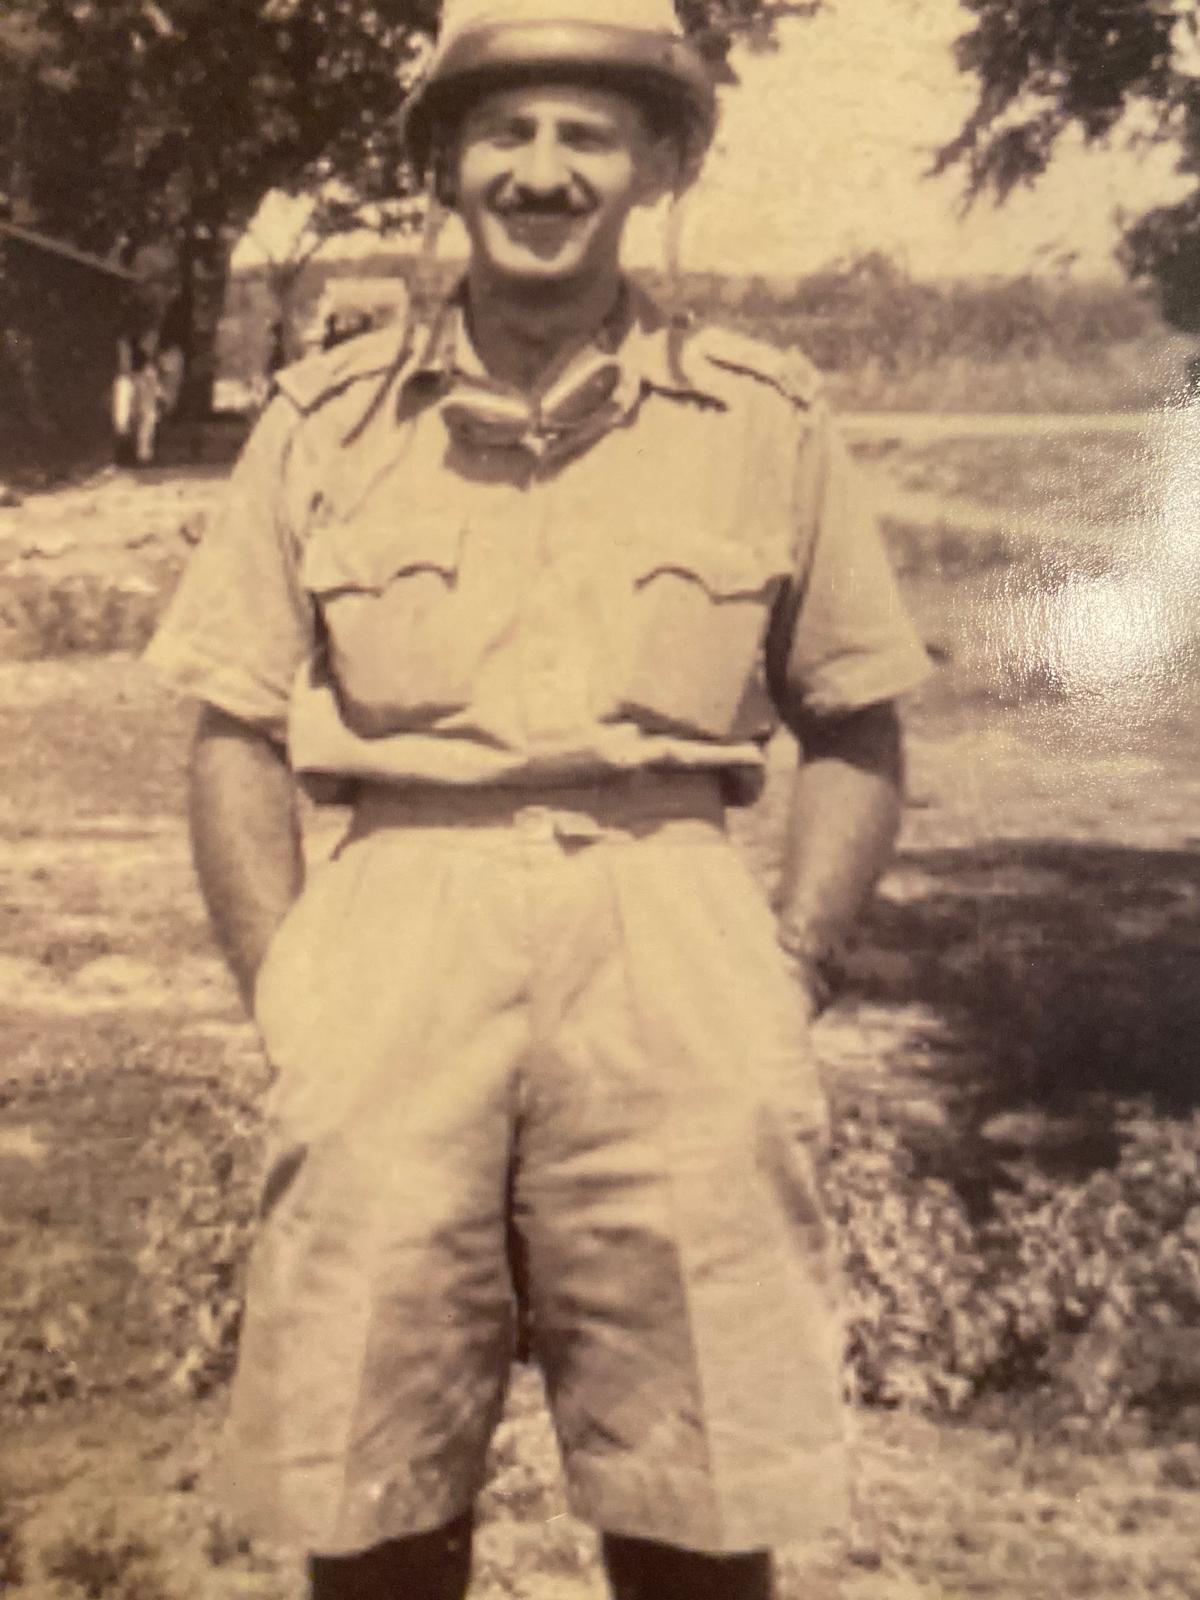 My mother was born in London, November of 1940 and her father was off fighting Nazis in India (tank brigade - very cool) - she never met him until he came home in 1945 and her earliest childhood memories were air-raid sirens, bombs and rationing - THAT's being in a war! - One time she was standing looking at out the right window of the house and the left window exploded from a bomb that landed on her street - a different choice of view and she'd be dead and I wouldn't be here - we make those choices every day, don't we?
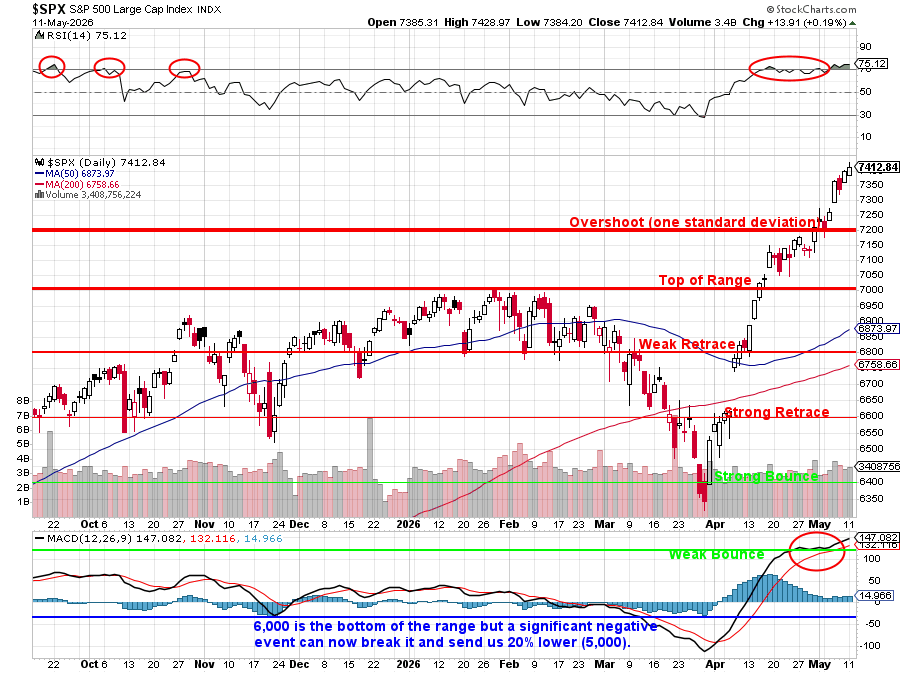
When Trump's war began, I made a timeline of World Wars I and II to illustrate how these things are slow-rolling disasters early on - the then snowball our of control. I would love to say, 73 days later, that we're not on that path but we're halfway through our 3rd month and no end in site. Oil is $101.57 this morning and Brent is $107.84 and Trump is off to Bejiing, not at the table with Iran - instead he sent the man he used to call "little Marco" to negotiate.
Let's see what has changed since our March 5th concerns:
WHY THIS MATCHES WWI/WWII PATTERN:
1. Alliance Systems Activating
Just like 1914:
-
-
-
- US-Israel joint operations
- France deploying carrier, authorizing base use
- Canada can’t rule out joining
- NATO intercepting missiles for Turkey
- Gulf states being pulled in whether they want to or not
-
-
2.