This is very important:
-
- This podcast details a violent reassessment of AI economics, arguing that the industry is shifting from an era of “irrational exuberance” to a “financial catastrophe” driven by negative returns on investment.
- Roy and Penny contrast a failed “bullish thesis” of exponential growth with the reality of token price implosion and “model substitution,” where companies abandon expensive frontier models for cheaper, specialized alternatives.
- Central to the narrative is the architectural limitation of large language models, which Phil Davis compares to a “million monkeys” experiment that has hit a wall of diminishing returns and model collapse due to a reliance on synthetic data.
- The discussion concludes that the future of the field lies not in “brute force” scaling and massive hardware spend, but in a paradigm shift toward MadJac’s “binding” methodologies that prioritize logical context and efficiency over massive parameter counts.
It’s important because we need to be able to step back in look at the market from the outside – without all the daily cross-currents that toss us back and forth. Only then will we know clearly when it’s time to GET OUT!!! And it will be time, one day – and we need to know what the signs are going to be.
We have already moved our portfolios, for the most part, away from overpriced Tech but a real market crash won’t spare “the good ones” and we need to be ready for when it happens as it won’t be a “Women and children first” situation but very much “Every man for himself!”
The video is just what I’ve been warning would happen for 2 years but we’ve still managed to have 2 years of amazing portfolio performance playing the rally that kept going – despite the fact that it is racing towards its doom (I could still be wrong – but it doesn’t seem likely) and this is just a broad-strokes guide that tells us where the exits are in case of an emergency – like those signs on the door of a hotel room that we all ignore…
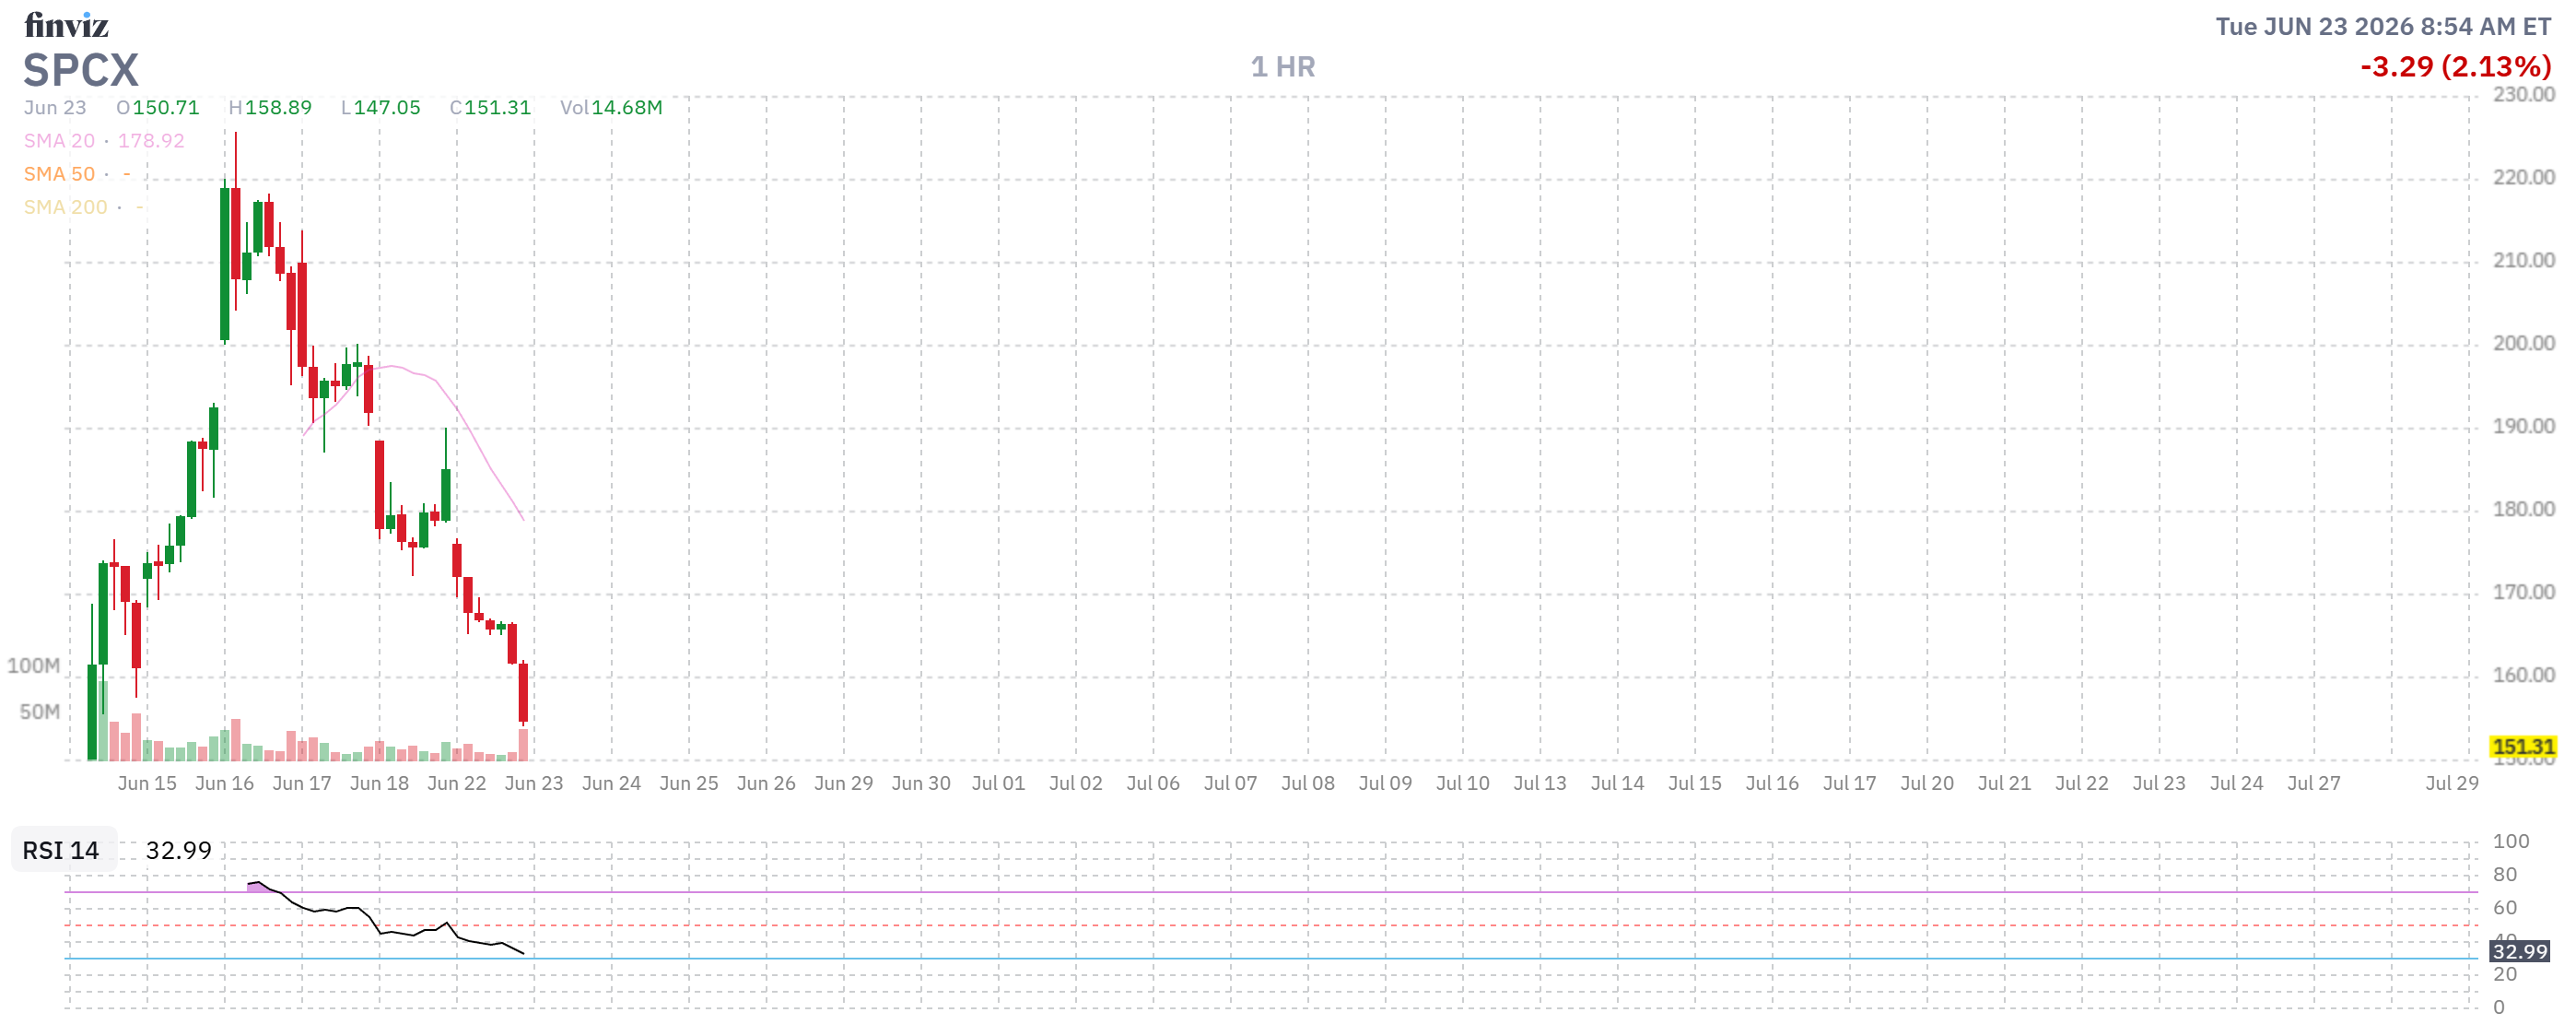
Don’t forget that, despite SPCX falling all the way back to $150 (from $210) yesterday, it’s still over $2Tn with 7.4 BILLION shares outstanding (and only 555M sold to the public) and, due to ridiculous ETF weightings and an unprecedented rush to list, we are just two weeks away from EVERYONE’s 401K and IRA and all those index fund (QQQ, etc.) holders being FORCED to buy about $20Bn worth of SpaceX stock – that would be the outright purchase of 133M shares and yesterday’s ENTIRE volume was 165M shares – that’s buyers AND sellers – imagine what 133M forced buyers will do to the price!
In our June Portfolio Review, last week, I said about Micron:
-
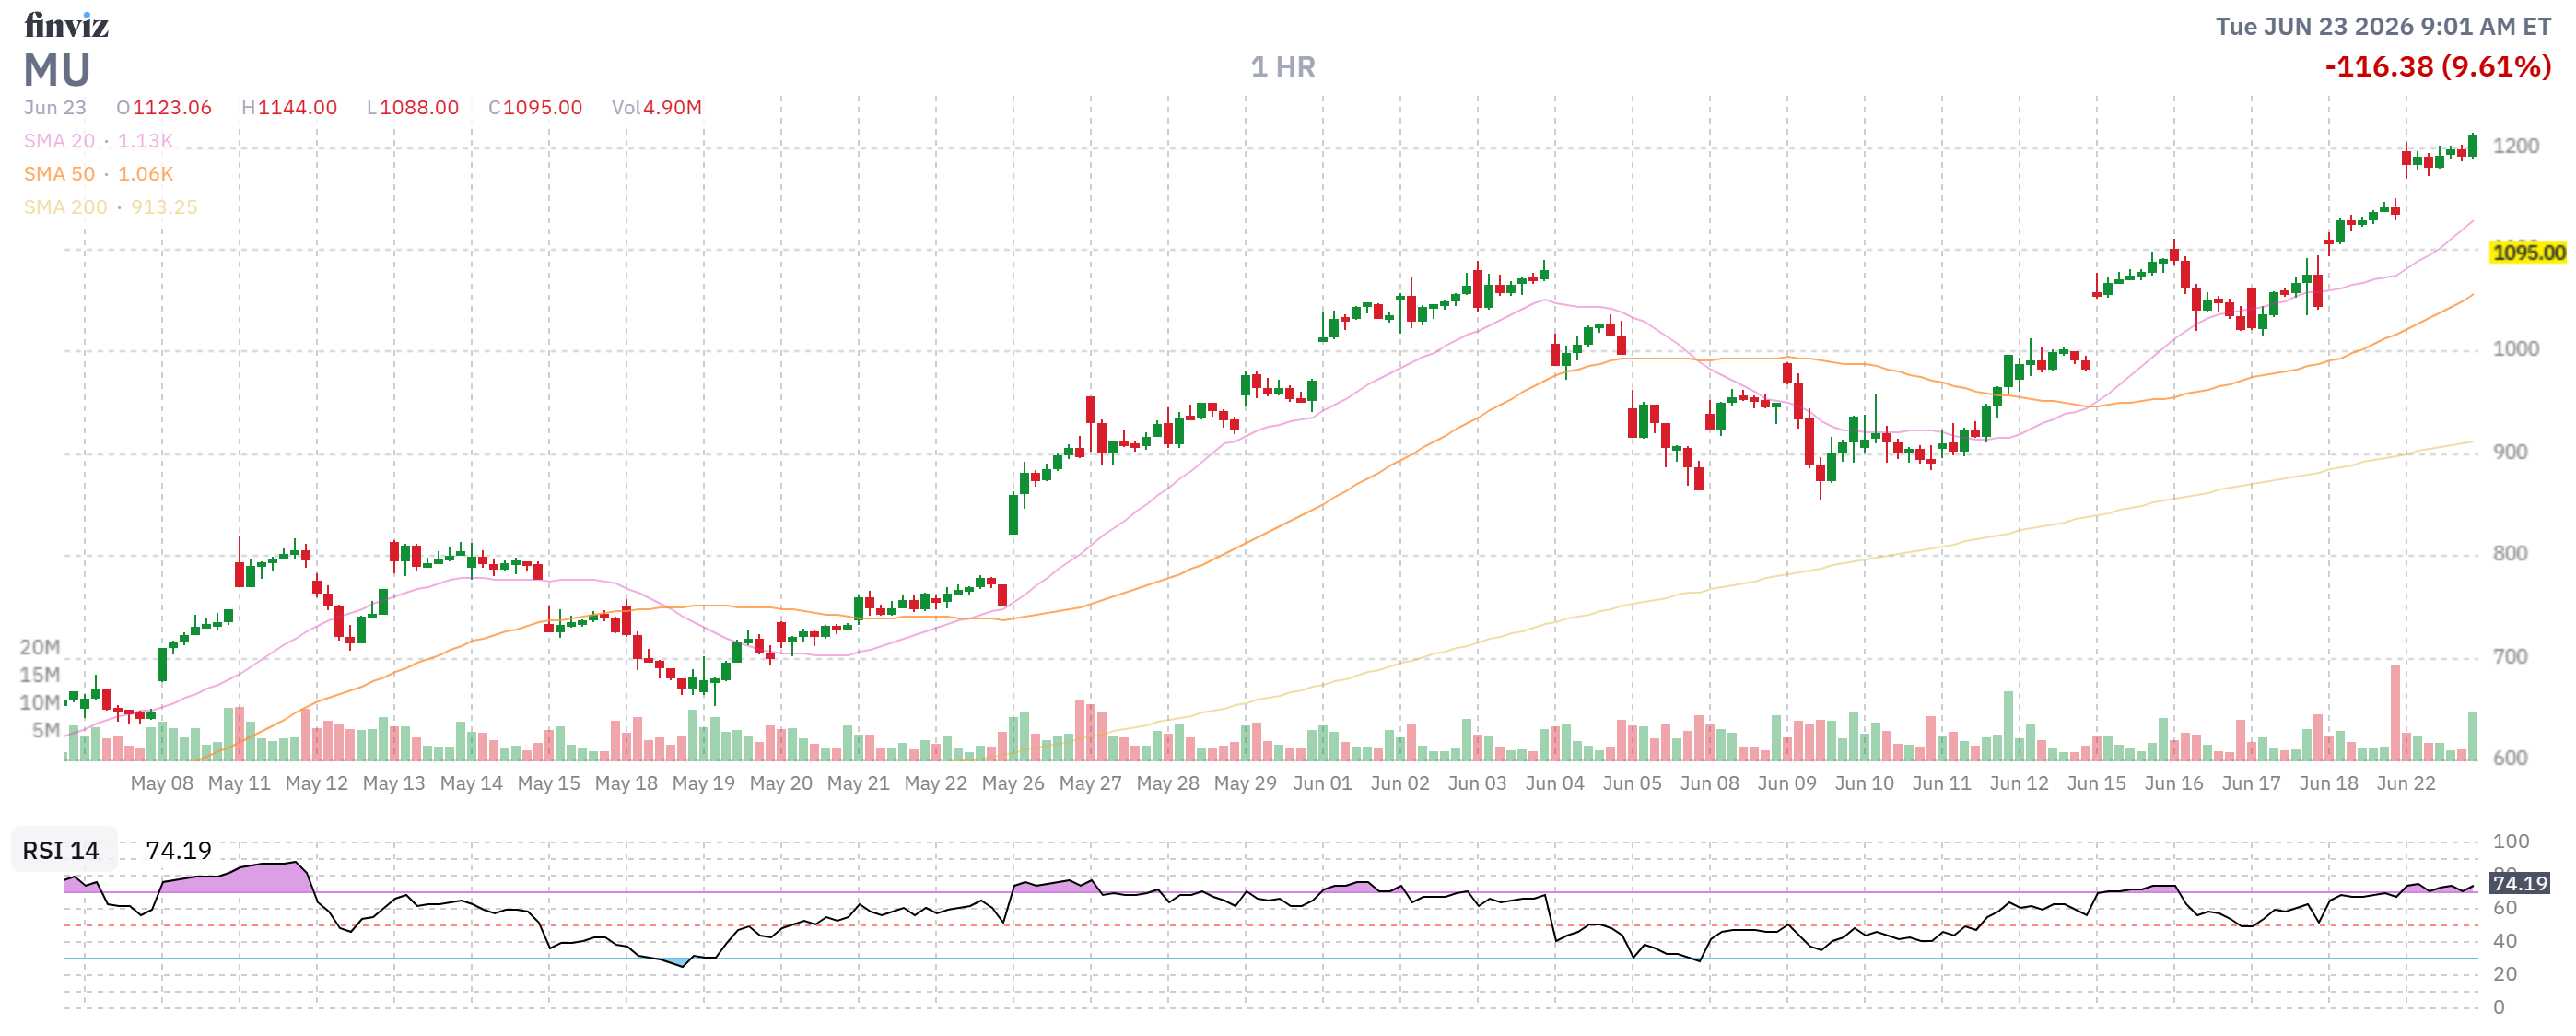
- MU – INSANITY! Fortunately, we added the Dec $700s but the short $1,000 calls should be Dec 2028, not June! Hopefully we can fix this when 2029s come out but not if they are going to gain $100 day!!!
- Notice the Dec 2028 $700/1,000 bull call spreads are only net $93 so, if MU keeps going up, we just buy 30 more of those for $276,750 and that gives us $623,000 more upside at $1,000. As long as we can keep covering with a 3x payoff spread – we’ll be fine.
As I often say to our Members, “What can easily be done can just as easily be undone” and that’s why we held our position. Not because I hate fun, but because I love physics. TA traders (90% of the market, sadly) can draw all the lines they want on charts but the universe those charts live in is still bound by basic constraints – including the financial kind.
Take MU: a $200 run over $1,000 added roughly $250Bn of market cap in a week. That same week about 25M shares traded – call it $25Bn of actual money changing hands, buyers and sellers COMBINED. In other words, a relatively small amount of Capital and sentiment stretched the “bubble” thin enough to mark up the entire company by a Quarter‑Trillion Dollars!
Picture a soap bubble: you blow a little air in and the surface area expands dramatically. The more it expands, the thinner the film gets until you hit a point where the material can’t support the pressure anymore and it snaps back. Markets do the same thing. A limited amount of real money (the “air”) is used to bid up a price that gets applied to every share (the “surface area”) and, beyond a certain point, there just isn’t enough new money or new believers to keep that surface from tearing itself apart.
That’s why bubbles pop – and they always pop – because physics demands it. You can stretch sentiment, leverage and narratives a long way, but you can’t repeal the basic math that says $25Bn of trading shouldn’t be able to permanently support $250Bn of market cap mark‑up unless there’s a lot more real capital ready to step in at those prices.
And God forbid someone has the gall to try to actually sell – which is what is happening now in pre-market trading – there simply aren’t enough net buyers who want to buy MU for $1,200, $1,150 or even $1,100 to support the PRICE (not to be confused with VALUE) of MU stock.
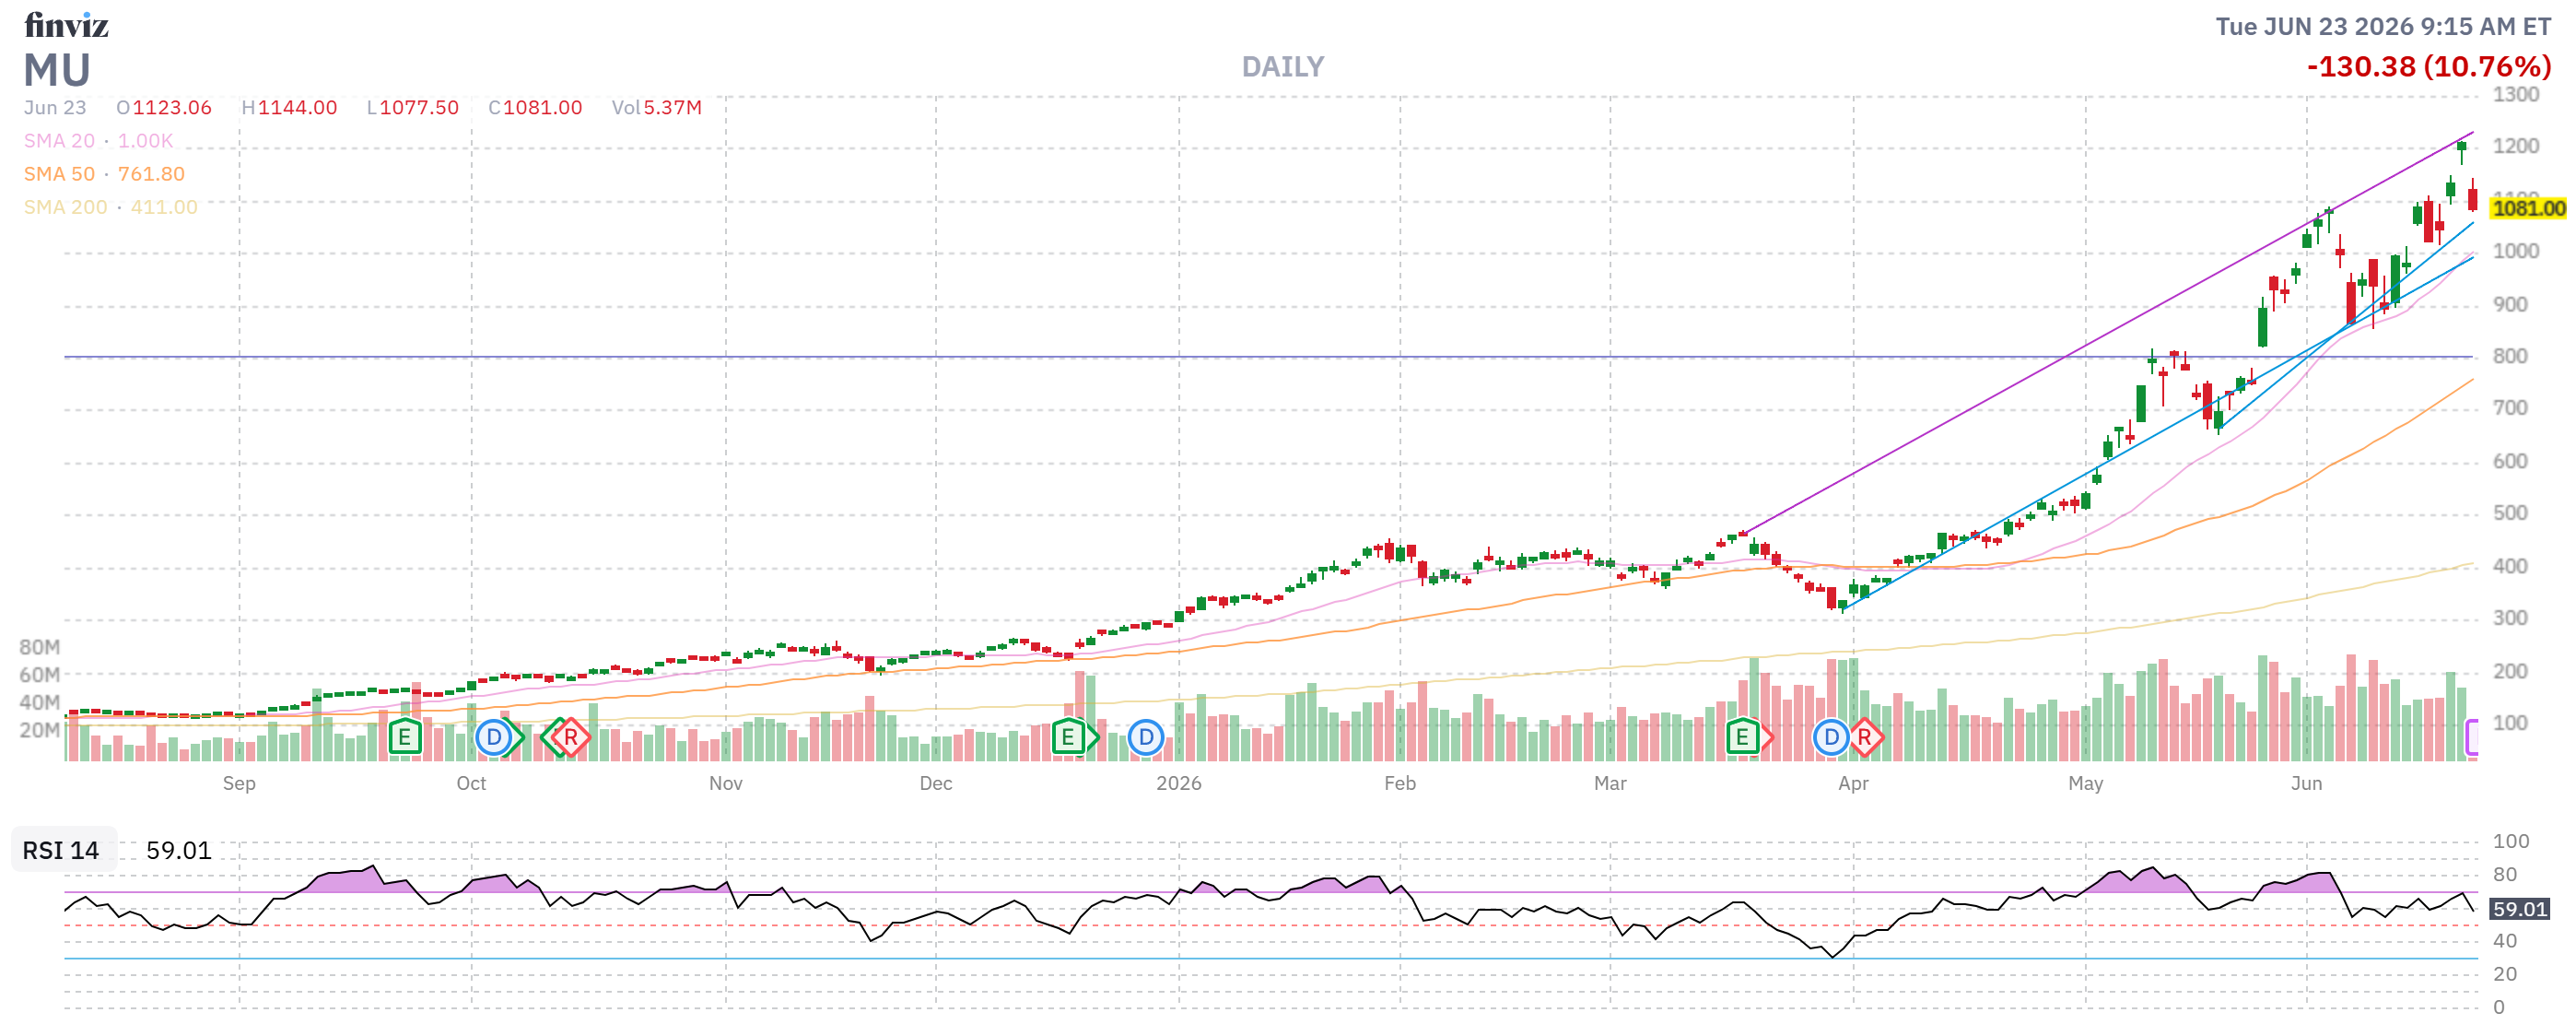
Between April ($300) and May ($800) there were about 2Bn shares traded at a $550 average and those people THINK they have a double at $1,100 but yesterday they were up 120% and today they are “only” up 100% and what if it drops to 80%? At what point do those people try to take “it” off the table?
But there is no “it” the net inflows into MU that raised the stock from $400Bn in April to $1,320Bn as of yesterday were about $70Bn, possibly far less. But if those 2Bn shareholders (MU only has 1.1Bn shares so lots of turnover) all want to cash out at $1,000 before they dip below 80% – what happens to the stock price when they DEMAND their $2Tn from a $1.2Tn company?
That is what we call “Price Discovery” and that is what collapsed the ENTIRE market in 2008 – turned out all those Bank profits and Mortgage Company profits and Real Estate profits were all the same BS circle-jerk nonsense that we have today – with EVERYTHING depending on everyone else being the greater fool – forever and ever, Hallelujah!
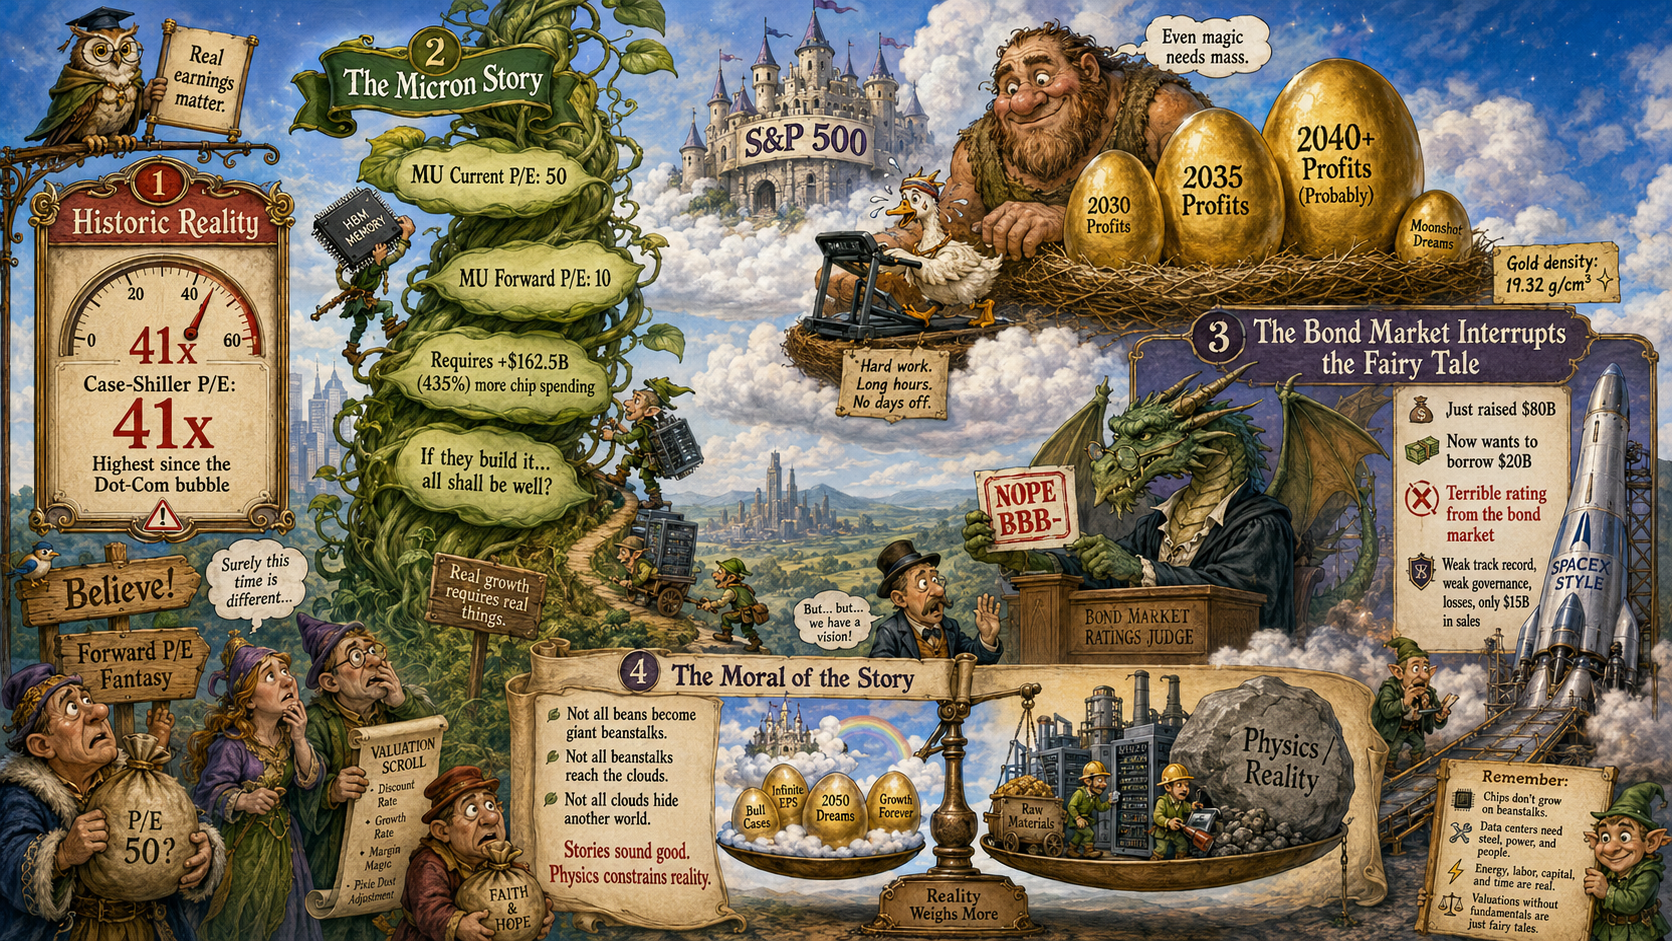
That’s right, you’ve got to be a Believer to keep putting money into this market at these valuations. Case-Shiller’s p/e ratio, which looks at real, historic earnings has the S&P trading at 41 times earnings – the most since the Dot Com bubble and MU is a good example as it’s CURRENT p/e is 50 but it’s FORWARD p/e is 10 because, if they build this thing and raise their prices and their customers have $162.5 (435%) BILLION MORE money to spend on chips than they had last year – then all shall be well, right???
That’s why people panic when SpaceX, who JUST raised $80Bn a week ago, goes to borrow $20Bn and gets a TERRIBLE rating from the bond market (because they have little track record, awful governance, are losing money and only have $15Bn in sales) – because it undercuts the infinite money fantasy that Micron’s growth is based on – and EVERYONE’s optimistic forward p/e’s are based on.
So, in closing (not because I’m done but because it’s 9:30 so I’ll see you in the Live Member Chat Room) – let’s be careful out there. Not all beans become giant beanstalks and not all beanstalks defy physics and grow to the clouds and not all clouds are really the floor of another World and not all those Worlds have Giants and not all those Giants have golden geese that lay golden eggs which have an average density of 1g/cubic centimeter (what, you didn’t know that?) while Gold is 19.32g/C3 – so the goose would have to eat for weeks to build up enough mass to produce just a single egg in the same way Micron has to build data centers and hire engineers and source materials, etc. to produce their projected profits…
Anyway, what I’m saying is the story might SOUND good – but the physics can constrain the reality in the end. That’s all we’re watching out for – REALITY!