


What if the point of quantitative market analysis for retail investors isn’t to predict the next move, but to make better decisions when the signals disagree? A rising inflation reading, a cooling labor market, and a shifting interest-rate outlook can tell different parts of the story. That’s not a flaw in the data. It’s a reminder to look beyond any single indicator.
If market numbers feel overwhelming or seem to change meaning from one day to the next, you’re not alone. The challenge is separating evidence from noise without turning a chart into a crystal ball. A reported U.S. inflation rate of 3.7%, for example, offers context about the broader economy, not a guaranteed signal about what happens next. The same applies to company results and price movements: each is one piece of evidence, not a complete explanation.
This article will show you how to evaluate market evidence systematically, build a repeatable process, and account for uncertainty before acting. We’ll break down what quantitative analysis means in an investing context, how to weigh indicators together, and how disciplined market commentary can help put the numbers in perspective. The goal isn’t perfect foresight. It’s a clearer, more consistent way to decide.
Key Takeaways
- See how quantitative market analysis for retail investors differs from consumer research, and what measurable market evidence can reveal.
- Explore ways to summarize price, volume, company fundamentals, and economic data without confusing patterns with causes.
- Learn to assess signals in context by considering data quality, sample size, time period, and changing market conditions.
- Use a repeatable workflow to define an investing question, select relevant evidence, record your interpretation, and review it over time.
- Discover how Phil Stock World’s market charts, education, commentary, virtual portfolio, top trades, and webinars can help put market evidence in perspective.
What quantitative market analysis means for retail investors
Quantitative market analysis for retail investors is the systematic use of numerical financial and economic data to examine market behavior, test an investing idea, and support decisions. It looks for measurable patterns and relationships across evidence such as prices, trading volume, company results, and economic indicators. Unlike consumer market research, which often studies what customers prefer, financial-market analysis asks what market data may indicate about securities and their investing context. It can sharpen a decision process, but it can’t guarantee where prices will go or what an investment will return.
The distinction matters because the same word, “market,” can point to two different questions. In a business study, a market might mean a group of customers. In investing, it usually refers to the environment in which securities trade, including company performance, investor activity, and broader economic conditions. Quantitative analysis in finance applies mathematical and statistical methods to financial markets and investment management; a retail investor can use its basic logic without building a complex model.
Think of the process as a way to organize a crowded dashboard. A number on its own is only a reading. Its meaning depends on what it measures, the period it covers, and the other evidence around it. A change in trading volume, for example, is an observation. Deciding that the change confirms an investing thesis requires further context, such as price behavior or company news.
How financial market analysis differs from consumer research
Consumer research may use surveys, interviews, or customer measurements to understand preferences, awareness, or purchasing behavior. Securities analysis instead examines financial-market evidence, including historical prices, trading activity, company disclosures, and economic releases. The first asks what customers think or do; the second asks how markets and investments behave in context. A survey about a product’s popularity, by itself, doesn’t establish how a company’s shares will perform.
What retail investors can learn from numerical evidence
Consistent measurements help investors compare like with like. You might track a company’s revenue across reporting periods, then consider whether its share-price movement and trading activity tell a compatible story. That comparison can help you test a thesis, spot a mismatch, or identify what you still need to understand. It doesn’t prove that one factor caused another, and a pattern from one period may not persist under different conditions.
Keep the distinction clear: an observation describes the evidence; a conclusion interprets it; an investment decision weighs that interpretation alongside uncertainty and personal circumstances. Quantitative analysis organizes evidence, not certainty.
- Observation: A company reports higher revenue than in an earlier period.
- Question: Does that change align with other relevant evidence, and what context might affect the comparison?
- Conclusion: Decide whether the evidence supports, weakens, or leaves the thesis unresolved.
That last possibility is useful, too. A disciplined analysis doesn’t force every data point into a confident story. It makes the reasoning visible, so you can revisit it as new information arrives rather than mistaking a tidy chart for a dependable forecast.
Which market data and quantitative methods can retail investors use?
Start with the question, not a favorite indicator. Quantitative market analysis for retail investors can draw on several kinds of evidence, but each answers a different question. Price and volume history show how a security has traded. Company fundamentals, such as revenue, earnings, and debt, help describe business performance. Economic data, including inflation, employment, and interest rates, offers a wider view of the conditions markets are responding to.
These categories can complement one another, but they aren’t interchangeable. A price chart can show a move without explaining why it happened. A company’s reported results can describe its financial performance without establishing how investors will value it. And an economic release may affect different companies or sectors in different ways.
- Price and volume: Track the security’s trading history and the level of market activity alongside its price changes.
- Company fundamentals: Examine reported business measures to understand performance and financial condition.
- Economic data: Consider broader indicators to frame the environment in which securities are trading.
Descriptive, comparative, and trend analysis
Descriptive analysis summarizes what the data shows. For example, it might record that a stock’s closing prices varied over a chosen period, without claiming what caused those movements. Comparative analysis places evidence side by side, such as comparing a company’s results across reporting periods or examining its price movement alongside a relevant market index. The comparison can supply context that a single reading lacks.
Trend analysis looks at how a measure changes over time. An investor might examine whether a company’s revenue has generally risen or fallen across several reports, or whether a security’s price has moved within a broader pattern. That pattern is a description of past data, not a promise about what comes next.
Keep the distinction sharp: observing that two measures move together is not the same as proving that one caused the other. Other influences may be involved, and the relationship may change. Research from Harvard Business School on the impact of Robinhood traders on the US equity market offers a research-based example of studying retail trading activity in relation to market behavior. It’s a reminder that market questions can be examined with data, while interpretation still depends on the evidence and scope of the analysis.
Choosing relevant evidence for a market question
Make the question specific before pulling up indicators. If you’re examining a company’s business performance, reported fundamentals may be more relevant than a short-term price pattern. If you’re studying recent trading behavior, price and volume history may be central. Match the dataset to the asset, the claim you’re evaluating, and the time horizon; a measure that helps describe a short-term move may not answer a question about longer-term performance.
Charts can make price and volume patterns easier to inspect, but their context matters. Understanding how to read market charts can help you interpret what a visual pattern shows without treating it as a standalone verdict. For more perspective alongside your own analysis, explore Phil Stock World’s market charts and analysis.
How to judge a quantitative market signal without mistaking it for certainty
A signal is a clue, not a verdict. A single indicator might suggest that a stock is gaining momentum, but it can’t show by itself whether the move reflects company-specific news, broader market activity, or a temporary burst of trading. A stronger interpretation checks whether other relevant evidence supports the same reading, while recognizing that agreement still doesn’t make an outcome certain.
For quantitative market analysis for retail investors, the aim is not to stack up indicators until a conclusion looks convincing. It’s to judge whether the evidence is relevant to the question, measured consistently, and broad enough to support a cautious interpretation. Three indicators that all reflect recent price movement, for instance, may offer less independent confirmation than price data considered alongside company fundamentals or a relevant economic factor.
What makes a market signal more or less informative?
Begin with the data itself. Is it measuring the factor you’re investigating? Were the measurements gathered consistently, and does the sample cover enough observations to make the apparent pattern worth examining? A handful of data points can produce a striking-looking result, but offer limited context. There’s no universal sample-size threshold that makes a signal dependable; adequacy depends on the question and the data.
Time period matters, too. A price pattern may look strong over a short window and less persuasive across a longer one. Different windows don’t necessarily invalidate one another. They may reveal that the interpretation depends on the period selected, or that market conditions changed. Ask whether the chosen span fits the claim you’re assessing, and whether key information is missing or recorded inconsistently.
Testing an idea against historical data can help reveal how it would have behaved in the past. But markets evolve, and a pattern that fit one stretch of history may not hold under different conditions. A past result is evidence about that historical sample, not a promise about future performance.
How quantitative analysis can mislead
The danger often hides in the choices around the analysis. Cherry-picking means selecting a convenient period that supports a preferred story while ignoring other windows. Overfitting happens when an idea is tailored so closely to past data that it describes that sample beautifully but may have little practical value elsewhere. Selective indicators create a similar trap: highlighting the measures that agree and overlooking those that don’t.
Correlation needs careful handling. If a stock rises while a sector index rises, the two movements are related in the observed period, but that alone doesn’t prove the index caused the stock’s move. Coincidence is also possible, and other factors may influence both. A relationship in market data shows what moved together; it doesn’t, on its own, establish why.
- Correlation: Two measures change in related ways.
- Causation: Evidence supports that a change in one factor produced a change in another.
- Coincidence: Measures appear connected, but the observed overlap may not reflect a meaningful relationship.
Even a rigorous-looking signal can’t remove uncertainty. Treat it as one input, check whether independent evidence adds context, and stay open to interpretations that don’t confirm your first read. No indicator works in every market condition.
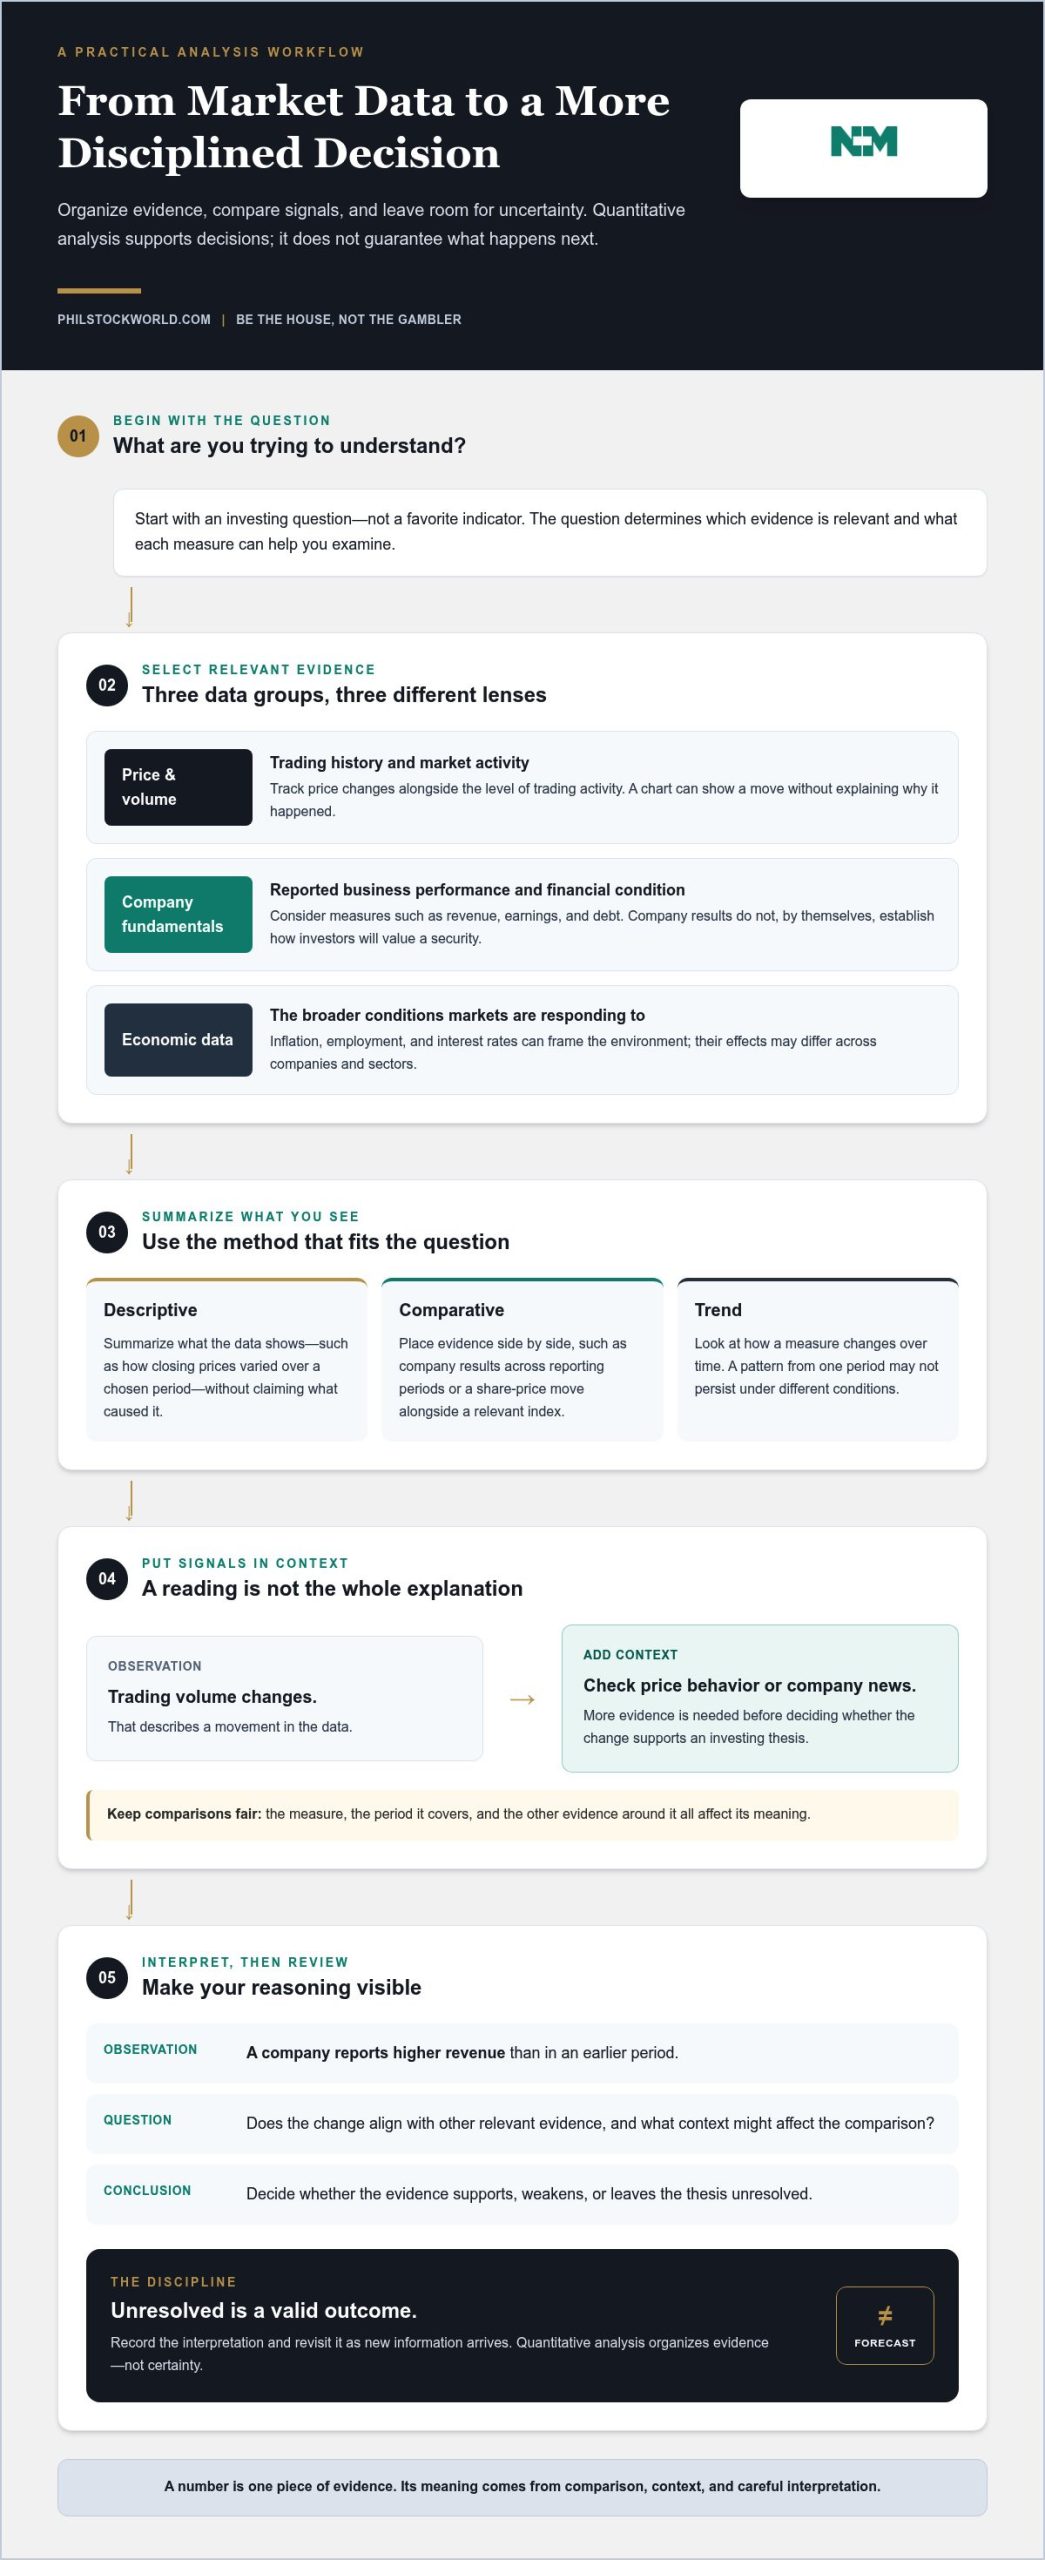
A practical retail-investor workflow for analyzing market data
A repeatable process makes quantitative market analysis for retail investors less about chasing a signal and more about showing your work. The steps below help turn a broad market view into a question you can investigate, while keeping evidence, assumptions, and uncertainty in separate lanes. This is an educational framework, not an instruction to buy, sell, or change an investment allocation.
Turn a broad market view into a testable question
Replace a prediction such as “this company is about to take off” with a neutral question: “What do the company’s reported results and price history show over the period I’m examining?” Name the asset, evidence, and time horizon. Before reviewing results, record assumptions that could shape your interpretation. That small pause helps guard against rewriting your original thesis to fit what happened.
- Define the question. State what you want to understand and why. Keep it focused enough that evidence could support, challenge, or leave it unresolved.
- Select relevant evidence. Choose data that matches the question, such as company fundamentals for a business-performance question or price and volume history for a trading-pattern question. Note where each measure comes from.
- Assess the context. Check the measurement period, data quality, and relevant market or economic conditions. Ask whether another explanation could account for the pattern.
- Document your interpretation. Separate what the data directly shows from what you infer. Write down assumptions and uncertainty, including evidence that would weaken your initial view.
- Review the thesis. Revisit your notes when relevant information arrives or conditions change. Record what changed and why, rather than silently shifting the original criteria.
Document findings and revisit the thesis
A useful record is brief, but specific enough to revisit later. Keep the question, evidence, assumptions, uncertainty, and a review trigger together. For instance, a trigger might be the next relevant company report or a change in the conditions your thesis depends on. The point is to define what could prompt a fresh look, not to set an automatic trading instruction.
Quick analysis worksheet
- Question: What am I trying to understand?
- Evidence: Which data is relevant, and what does it show?
- Assumptions: What am I taking as given?
- Uncertainty: What is missing, ambiguous, or could challenge my interpretation?
- Review trigger: What new information or changed condition would make me reassess?
For a broader view, consider how an idea fits alongside the rest of a portfolio, rather than judging one holding in isolation. A virtual portfolio review can offer a portfolio-level lens for examining assumptions and strategy. To keep building your process, explore Phil Stock World’s market charts and analysis as another source of context, not a substitute for your own judgment.
How Phil Stock World helps retail investors put market analysis in context
Numbers are useful, but they don’t tell the whole market story on their own. A price move, company report, or economic release can look different when viewed alongside broader market conditions. Phil Stock World’s daily market commentary, charts, and educational resources help readers consider that wider context while keeping their own judgment in the driver’s seat. Commentary and trade ideas are inputs for personal research, not instructions or promises of results.
Use commentary and education to broaden the analysis
Market activity doesn’t happen in a vacuum. A company’s share price may be responding to its own results, sector developments, or a shift in the economic backdrop. Commentary can help connect these threads and prompt useful follow-up questions: Is this move specific to one company, or part of a wider pattern? What context might the numbers leave out? Those questions help frame analysis without turning an interpretation into a certainty.
Phil Stock World brings together market charts and analysis, trading education, top trades, a virtual portfolio, and live trading webinars. Each can offer a different lens: charts help readers examine market behavior, while educational material can help clarify concepts and trading ideas. Use those perspectives to inform your own research, not as a substitute for assessing evidence, uncertainty, and your circumstances.
Readers looking to deepen their understanding of options can explore advanced option trading strategies. Educational resources can add useful context, but no strategy or commentary can guarantee an investment outcome.
Explore Phil Stock World’s interactive resources
The Interactive Trading Room Membership offers access to interactive trading-room content, creating an educational next step for investors who want to engage with market analysis. Alongside it, Phil Stock World’s virtual portfolio, top trades, trading education, and live trading webinars provide additional ways to follow market ideas and consider how they fit into a broader picture.
That range can be especially useful when you want to move beyond a single chart or headline and see how market perspectives are discussed together. Treat each resource as a prompt to think critically: What evidence supports the idea? What assumptions does it rely on? What could change the interpretation? The goal is a better-informed process, not a borrowed conclusion.
If you’re ready to keep learning and explore ongoing market discussion, take a look at the Interactive Trading Room Membership. Use the insights as context for your own research and decisions.
Make your next market question more deliberate
The next time a market move catches your attention, pause before turning it into a prediction. Ask what you want to understand, which evidence could challenge your first impression, and what might change your view. That habit is the practical edge of quantitative market analysis for retail investors: not certainty, but a clearer basis for independent judgment.
You don’t need to make every decision alone with a spreadsheet. Phil Stock World’s homepage brings together daily market commentary and charts with trading education, a virtual portfolio, top trades, and live trading webinars. These resources can add perspective as you continue learning, while your own research remains central.
Explore Phil Stock World’s Interactive Trading Room Membership for ongoing market discussion and resources to inform your research.
Frequently Asked Questions
What is quantitative market analysis for retail investors?
Quantitative market analysis for retail investors uses measurable financial and economic evidence to structure research about securities. It differs from consumer market research, which typically studies customer preferences, purchasing behavior, or responses to products. An investor might examine how reported company performance relates to a share’s market history, then consider what else could explain the pattern. The analysis can clarify a decision, but it can’t guarantee a stock’s direction or investment outcome.
How can retail investors use quantitative analysis?
Retail investors can turn a hunch into a question that can be examined, such as whether a company’s operating results align with its market performance. Identify relevant records, note the period and any gaps, then consider sector or economic context before interpreting them. Write down your assumptions and what might change your view. This creates a traceable research note, not a prescribed buy, sell, or portfolio decision.
Is quantitative analysis useful for individual investors?
Yes, it can help individual investors organize scattered evidence and apply consistent questions across different research situations. For example, comparing a company’s operating disclosures with its market history may show where further investigation is needed. Its usefulness depends on whether the data is trustworthy, the question is well framed, and the method fits the decision context. It supports judgment, but it doesn’t replace it or eliminate uncertainty.
What data do retail investors use for quantitative market analysis?
Retail investors commonly examine price and volume history, company fundamentals, and economic data. Price and volume records describe trading activity; company reports provide information about business performance; economic releases help frame broader conditions. The right source depends on the question. If you’re examining a company-specific claim, broad economic data alone may not resolve it. Keep the asset, the claim, and the data category aligned before drawing an interpretation.
Can quantitative market analysis predict stock prices?
It can help identify historical patterns or relationships, but it can’t reliably guarantee a stock’s future direction. A pattern visible in past trading may fade as company circumstances, investor behavior, or wider market conditions change. Even a well-tested idea remains an interpretation of evidence, not a promise. Treat historical performance as something to investigate, and consider what could make the next period different before relying on a past pattern.
What is the difference between quantitative and qualitative market analysis?
Quantitative analysis focuses on measurable evidence, such as reported financial results or trading records. Qualitative analysis considers descriptive context, including management commentary, competitive developments, or how a news event may affect a company. Used together, the numbers can show what changed while qualitative research can help explore possible explanations. Neither approach guarantees an accurate forecast, and qualitative context should be weighed critically rather than treated as proof.
How do you avoid misleading conclusions from market data?
Check whether the data actually fits your question, whether it’s reliable and consistently measured, and whether the selected time period changes the apparent story. Record assumptions and consider alternative explanations before settling on an interpretation. Watch for cherry-picking a period that supports your view or overfitting an idea to past data. If several indicators reflect the same underlying information, their agreement may offer less independent support than it first appears.