


High volume can make a volatile market harder to trade, not easier. Trading strategies for volatile markets work best when risk comes before the potential payoff: limit the amount at risk on each trade to 1-2% of trading capital, and use stop-losses while remembering that fast moves or price gaps can lead to execution far from the stop price. A plan matters most when quotes and prices are moving quickly.
It’s natural to focus on opportunity when prices swing sharply. But the same movement that creates profit potential can magnify losses, widen the gap between an expected price and the actual fill, and invite snap decisions. This guide to trading strategies for volatile markets explains how to weigh risk against reward, diversify across assets, trade range breakouts, and use volume to judge whether a move has conviction. You’ll also learn why heavy trading can complicate execution and how a clear plan can keep decisions grounded.
Key Takeaways
- Compare a trade’s potential gain with its breakeven point and downside before entering, especially when volatility can widen the gap between quoted and executed prices.
- Spread exposure across asset types and sectors, then revisit your allocation when your goals or investment reasons change.
- Wait for trading volume to help confirm a move beyond support or resistance before treating a range breakout as meaningful.
- Read heavy volume alongside fast price changes and possible order imbalances; the VIX tracks the S&P 500’s implied volatility over 30 days.
1. Breakeven points, profit potential, and risk
Volatility describes how widely a security’s or market index’s returns vary. Standard deviation and variance measure that spread. Standard deviation tracks variation around average returns and captures absolute, rather than market-relative, volatility. A drawdown measures a peak-to-trough decline. Together, these concepts help you assess price movement, portfolio damage, and whether a trade’s potential return justifies its risk.
Average True Range (ATR) tracks recent price movement, helping traders judge whether typical swings have widened and adjust stop placement. Bollinger Bands widen as price variation rises and narrow as it eases. A touch of a band alone doesn’t confirm a reversal or breakout. Compare the signal with price action and trading volume before changing your plan.
When volatility increases, traders may use smaller positions and wider stops while keeping overall exposure similar. One approach is to cap risk at 1-2% of trading capital per trade, then size the position around the stop distance. Stop-losses help manage short-term risk, but a fast move or gap can produce an actual execution price far from the stop. Match risk to your tolerance, objectives, and asset allocation, not just the chart.
Options can express a view on movement, but breakeven levels matter more than a dramatic price swing. A long straddle or strangle may benefit from a sufficiently large move, while the premium paid and expiration shape the outcome. As discussed in Phil Stock World analyses, a typical short-straddle example might feature breakeven prices of $66.55 and $113.45 at June option expiry. Options also involve commissions, margin, and interest costs.
News and government economic data releases can trigger rapid repricing as traders react to results that differ from expectations. Before a scheduled release, define your entry, exit, and maximum risk. Don’t treat an anticipated move as a confirmed signal. Uncertainty can widen price swings and make planned trade levels harder to execute.
Leverage magnifies exposure, so sharp moves can deepen losses and create margin pressure. According to the Board of Governors of the Federal Reserve System, highly leveraged firms may need to sell assets during periods of stress to meet margin calls or reduce risk. Limit orders set the price you’re willing to accept, but execution isn’t guaranteed. Review the trade’s breakeven points and potential loss before investing.
2. Asset allocation and diversification
Asset allocation determines how much of a portfolio is held in stocks, bonds, and cash. Set the mix according to your objectives, time horizon, liquidity needs, and tolerance for losses. If stocks dominate, an equity selloff can pull the whole portfolio lower. Bonds and cash may behave differently, but neither removes investment risk.
Diversification can span asset classes, sectors, and individual holdings. A portfolio spread across companies in one sector may still be concentrated if those businesses respond similarly to interest rates or economic news. Broad exposure can reduce reliance on one holding or industry, but it doesn’t guarantee profit or prevent losses in a declining market. Think of diversification as distributing risk, not eliminating it.
Choose your mix by considering how much you could tolerate losing without abandoning your plan. Then review each position’s size, sector weight, and response to market stress. Dividends can contribute to total return, but they don’t offset a falling share price or make a concentrated position diversified. Set points for reviewing your allocation, and revisit it as your circumstances change.
U.S. stocks have historically experienced 1 correction of 10% per year, data as of December 31, 2025. That pattern can frame drawdown expectations, but it can’t determine the timing or depth of the next decline. Avoid changing a long-term mix solely because volatility has made headlines. A portfolio’s role matters more than the latest market mood.
If your investing reasons remain intact and your portfolio is diversified across stocks, bonds, and cash investments, doing nothing is usually best. Review your choices periodically against your objectives, then rebalance if allocation shifts change the portfolio’s risk profile. Use sector and asset-class charts to compare exposures and spot holdings that may share the same risk drivers.
3. Buying breakouts from support and resistance ranges
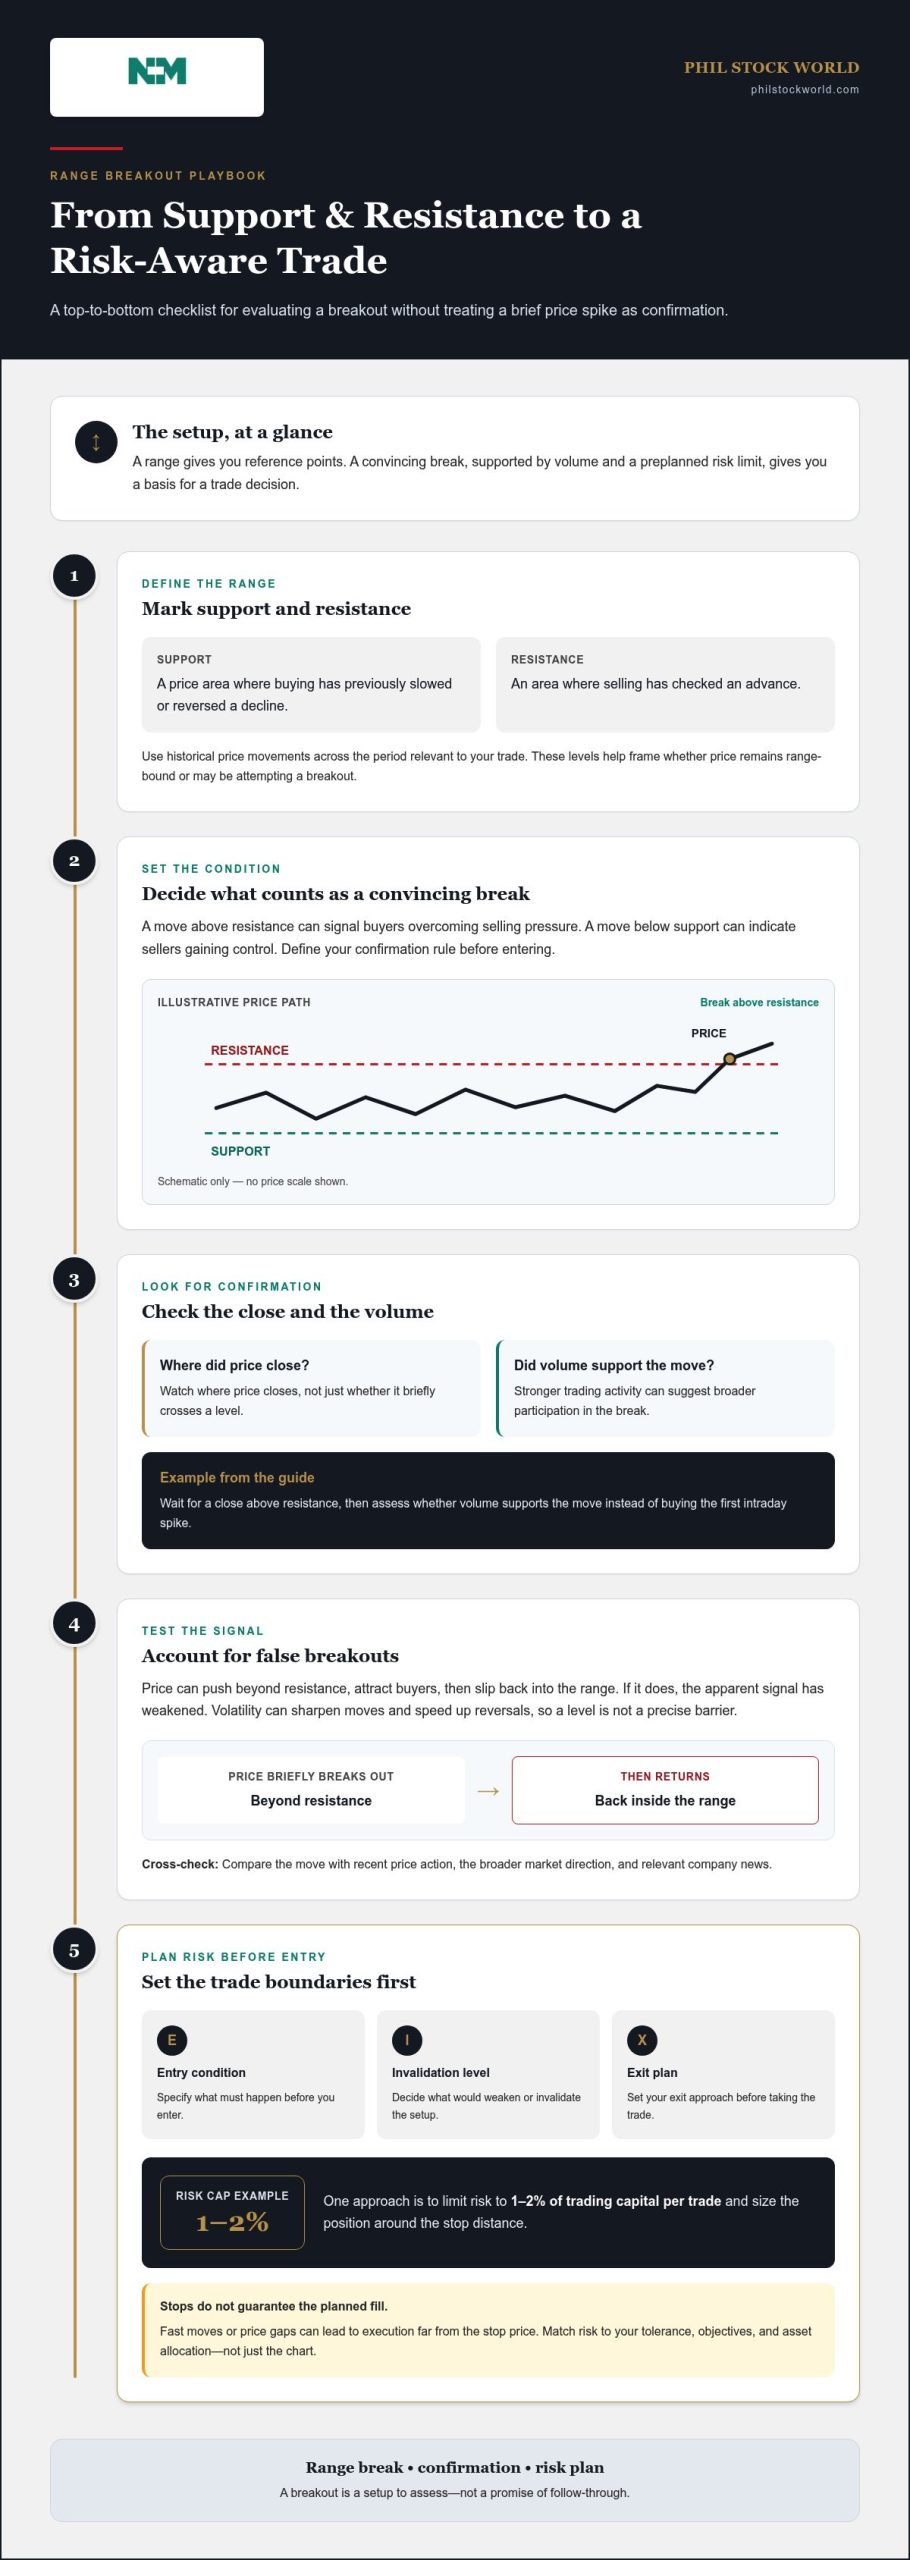
Support marks a price area where buying has previously slowed or reversed a decline. Resistance marks an area where selling has checked an advance. Together, they frame a range for a stock, index, or corporation’s shares. Use historical price movements to identify these levels across the period relevant to your trade. The advantage is a clear reference for judging whether price remains range-bound or is attempting a breakout.
Before entering a trade, mark support and resistance on a chart and define what would count as a convincing break. A move above resistance can signal that buyers have overcome selling pressure; a move below support can indicate that sellers are gaining control. Check trading volume, since stronger activity can suggest broader participation. Watch where the price closes, not just whether it briefly crosses a line.
False breakouts are part of the setup. Price may push beyond resistance, attract buyers, then slip back into the range. If so, the apparent signal has weakened. Set an entry condition, an invalidation level, and an exit plan before trading. For example, you could wait for a close above resistance, then assess whether volume supports the move instead of buying the first intraday spike.
Volatility can sharpen moves and speed up reversals, so don’t treat a single level as a precise barrier. Compare a breakout with recent price action, the broader market direction, and relevant company news. Decide how much of your portfolio the position should occupy, and keep its potential loss within your overall risk limits. A breakout strategy is a decision framework, not a reason to chase a rapidly moving price. Practice your entry and exit rules with paper trades before committing capital.
4. High trading volumes and volatile markets
Volatile markets often bring high trading volumes, rapid price changes, and order imbalances. These conditions can create opportunities, but they also make execution less predictable. Real-time quotes can lag behind market movements, so the displayed price may differ from the price available when an order reaches the market. Use volume as context for a move, not as a stand-alone signal.
The Cboe Volatility Index, or VIX, measures the S&P 500’s implied, forward-looking volatility over 30 days. It gives traders a market-wide measure of expected movement, while volume shows how actively securities are trading. Neither provides a guarantee of direction. Compare both with the price action of the security you’re considering, since its movements can differ from the broader index.
Read volume alongside a key price level. If a stock moves above resistance on stronger trading activity, that may suggest broader participation. If volume fades as price advances, the move may have less support. Assess whether buying or selling appears dominant, then consult your entry and exit rules before acting. Heavy activity can make electronic order placement difficult, and rapid conditions can complicate phone access to an investment professional.
Trend-following and mean-reversion strategies respond differently to volatile conditions. Trend-following looks for continued movement, using tools such as the 9 EMA and 21 EMA crossover to help identify direction. Mean reversion expects prices to move back toward a relevant average, so a trader might look for stretched conditions rather than chase a surge. An RSI above 70 is described as overbought, and below 30 as oversold, but neither reading alone settles the trade.
Large price swings can also force highly leveraged firms to sell assets to meet margin calls or reduce portfolio risk during market stress, according to the Board of Governors of the Federal Reserve System. That pressure can add to one-sided order flow. Use volume charts to compare trading activity with price movements before deciding whether a signal fits your plan.
Phil Stock World: Premium Membership
Phil Stock World’s Premium Membership provides access to exclusive market commentary, trading ideas, charts, and sector-specific insights. These resources can help you compare a potential setup with your own risk rules instead of reacting to each sharp move in isolation.
A Virtual Portfolio Review offers a way to examine your positions and strategy choices. Educational Webinars can build your understanding of market approaches, while Market Charts and Analysis help you follow price action and trading activity. These resources support your decision-making; they don’t manage assets or place trades for you.
If you’d like to explore these resources, visit Phil Stock World.
Turn Your Market Plan Into a Repeatable Practice
Volatility will keep testing your decisions, but each trading session can help you prepare for the next. Treat your plan as a working process: record why you entered, what would invalidate the idea, and whether your execution followed your rules. Over time, that record can reveal how hesitation, overconfidence, or rushed responses affect your judgment.
Trading strategies for volatile markets are most useful when they fit your objectives and the amount of risk you can accept. If you want a clearer framework for reviewing your approach, Phil Stock World’s Virtual Portfolio Review and Educational Webinars can support your learning. They don’t replace your own decisions, but they can provide useful material as you refine them.
Ready to discuss your trading approach? Contact Phil Stock World and take the next step with a steadier plan.
Frequently Asked Questions
Why does volatility demand a strategy?
Trading strategies for volatile markets matter because rapid price swings can turn hesitation into an unplanned trade. A written plan helps you decide in advance when to enter, wait, or walk away. For example, if an earnings announcement is approaching, decide whether you’ll hold through the release or stay out until prices settle. It’s easier to make that choice calmly than during a sudden surge in activity.
Which trading strategies work best in highly volatile markets?
Effective trading strategies for volatile markets depend on whether prices are trending or moving within a range. Trend-following suits traders looking for continuation, while mean-reversion strategies look for a return toward an average. Breakout entries may fit a clear move beyond a watched level, particularly when volume supports it. Compare the setup with your timeframe and test your rules through paper trades before risking capital.
What are the risks of trading breakouts during high volatility?
A breakout can reverse quickly, leaving an entry above resistance or below support poorly timed. A brief price spike may trigger an order without showing sustained demand or selling pressure. Fast moves can also create slippage, while a limit order may not execute. Decide in advance what price action invalidates the setup, and avoid chasing a move that has already stretched.
What risk management rules help limit losses during periods of extreme volatility?
Set a maximum acceptable loss before entering, size the position to fit that limit, and define an exit condition. Record each trade’s rationale and outcome; patterns in your journal can reveal whether losses follow rule changes or impulsive entries. Avoid adding to a losing position just to improve its average price. If market conditions make your plan difficult to follow, sitting out is a valid decision.