
 What a disaster!
Not only are our students failing to keep up with the rest of the World but America is close to getting a failing grade in Infrastructure. That’s right, what was once the World’s mightiest and proudest economy, this once great nation of builders has been given an overall grade of D in the American Society of Civil Engineers report on our Infrastructure.
The 2009 Grades include: Aviation (D), Bridges (C), Dams (D), Drinking Water (D-), Energy (D+), Hazardous Waste (D), Inland Waterways (D-), Levees (D-), Public Parks and Recreation (C-), Rail (C-), Roads (D-), Schools (D), Solid Waste (C+), Transit (D), and Wastewater (D-). Awful? Shameful? How about DANGEROUS? Deadly even…
For one thing, The number of high hazard dams—dams that, should they fail, pose a significant risk to human life—has increased by more than 3,000 just since 2007, when there were "just" 1,000 dams at risk and 3,000 to pro actively maintain but the administration refused to fund the project, now the costs have tripled as the situation deteriorates but that’s nothing compared to what happens if just a few of them break completely. 1,819 dams are now in the "high hazard" category and, with the current budget, for every one damn that is reparied, two more become an emergency.
 In urban areas, roadway congestion tops 40 percent. According to the report, decades of underfunding and inattention have jeopardized the ability of our nation’s infrastructure to support our economy and facilitate our way of life. At risk of catastrophic failure besides the dams (including levees) are things like our drinking water, sewage systems, bridges, waterways, rail lines, airports, roadways (especially elevated ones) and, of course, our entire electrical grid. Additionally, 7 Billion gallons of clean drinking water is lost every day through leaking pipes – that’s 23 gallons per citizen per day WASTED for want of $11Bn in repairs – don’t bother worrying about it, the last Administration wouldn’t fund it in 2001 or 2006 so why bother now – 10 Trillion gallons later?
The ASCE calculates a 5-year $2.2Tn investment is needed to address the situation, that’s $500Bn (25%) more than it was 5-years ago, when they released their last report and nothing was done by the previous administration. So, rather than having invested in America, putting people to work and improving EVERYONE’s way of life, we spent over $1Tn fighting a war, another $600Bn a year on our regular military operations and gave over $1Tn worth of taxe breaks to just 1% of the people who are able to fly over the decaying infrastructure in their private jets. No wonder Obama is angry!
You should be angry too. Americans are spending 4.2 BILLION hours a year stuck in traffic, 1 Million people’s ENTIRE YEAR! That costs the economy $78.2Bn a year or an average of $710 per driver – that’s the hidden tax we pay for NOT fixing just the roads. Lack of uniform systems and regulations have led to high concentrations of hazardous materials and heavy metals in our nation’s landfills, which poses a significan threat to public safety. One out of 4 of our nation’s bridges are either structurally deficient or functionally obsolete and the current budget of $10.5Bn is only half of what is needed just to maintain these disastrous conditions. Travel by freight train is three times more fuel efficient than a truck but we are going to be taking tracks out of service if $10Bn a year isn’t dedicated to a $200Bn repair fund between now and 2035.
 Why is there no money to fix our infrastructure? Possibly because the top 1%, who used to earn $1Tn a year (inflation adjusted) and paid 60% income tax in 1979 ($600Bn), now earn $2Tn a year (20% of all US income) and paid an average of 17% in income tax for 2009 ($340Bn) and that is nothing compared to the grotesque levels of tax evasion practiced by America’s corporations, who earned $6Tn and paid JUST $138Bn in taxes last year (2.3%), leaving the rest of the government’s $3.5Tn budget to be paid by everyone else in the bottom 99% – SUCKERS! By the way. a lot of people will claim corporations earn less but that’s because they count the losses claimed by some corporations (AIG, FRE, FNM, GM, most airlines…) against the profits of other corporations and you KNOW that’s not the right way to look at it!
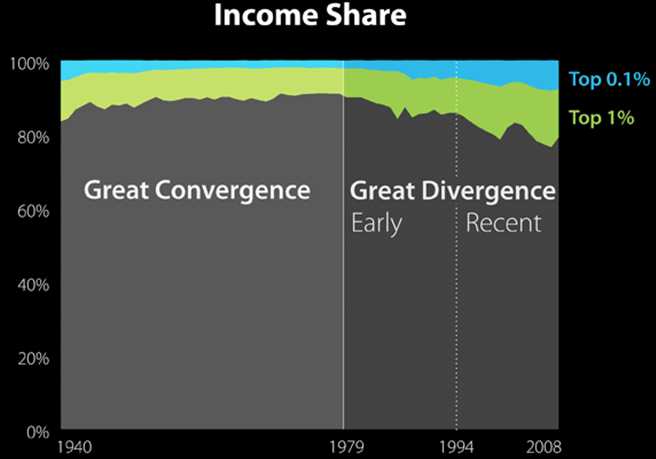
The top 1% and the multi-Billion Dollar Corporations use our roads, they drink our water, they flush their waste which needs to be cleaned. They dump their trash in our landfills and they pollute our air much more so than the average citizen in the bottom 99% yet they are not paying their share to support the system that makes them average salaries of over $1M per year (and that’s $17M a year for the top 0.01%). Come on America – this is ridiculous! I wrote about this in "Who Rules America" as well as "The Crisis of Middle-Class America" and you can click on the Income Share chart above to get to Slate Magazine’s excellent "Visual Guide to Income Inequality" so we can move on to other topics now…
 New jobless claims actually fell by 27,000 last week to "just" 451,000 and it is JUST because, as I began to point out two weeks ago, there are 140M people working and 451,000/143M = 0.33% or 1 in 300 so your odds of getting laid off in any given 52-week year is about 1 in 6, which means the average employee KEEPS their job for 6 years. It is difficult to maintain an environment of economic terror when, two years into the double-secret ultra high-stress red economic terror alert level, 90% of the people still have the same job they had in 2008. I’m not trying to trivialize unemployment – I just want to keep it in perspective. Meanwhile, we have 3M unemployed construction workers and $3.7Tn worth of infrastructure repairs that need to be done, that’s $1.2M worth of work that needs to be done FOR THE GOOD OF OUR SOCIETY in the EXACT skill set of 1/3 of our unemployed labor force. Hmm, I don’t know what it is but it seems like there might be some sort of solution here…
On the whole, we were pleased with yesterday’s Beige Book – not "thrilled" but pleased and we not only maintained our bullish posture but we added a dozen bullish trade ideas in Member Chat. In addition to XLF and UNG, which I mentioned in yesteray’s morning post, we took advantage of yesterday’s weakness to pick up 11 bullish plays on AAPL, HOV, TBT (bearish TLT), INTC, HRB, BSX, IRM, AMD, MDT, EOG and NSM. Just ahead of the BBook, we took bearish covers with USO and the Qs, both of which made small profits before stopping us out ahead of the close so, all in all – a very good day (assuming the market agrees with me and moves past this jobs data). Some of my comments on the Beige Book for Members were:
- Same issues as last time, residential and commercial real estate are sucking up the joint but, we did not have this much green last time either.
- Good demand for educated, skilled professionals (top 10%) egg sucking for the masses.
- This (poor spending on big-ticket items in Philadelphia, Richmond and Dallas) portends a bad Durable Goods report for August so let’s keep alert for that! Auto dealers are "optimistic"???? When’s the last time that happened?
- "Substantial gains"??? Has the World gone mad? What kind of language is this in relation to the economy? This is unheard of – somebody better spin this negative quickly or people might get excited…
- "Existing HIGH levels"??? Are these cities in Asia??? "Healthy conditions"??? Whuck? That’s not what it says in the Journal! Is the Fed lying or are things perhaps not as bad as they seem?
So we move into the day cautiously optimistic. Asia was mixed with the Shanghai dropping 1.4% but the Hang Seng was up 0.4% and the Nikkei was actually green for the second day in a row, up 0.8% and the BSE was it’s usual green, up 0.7% on the day. Europe, on the other hand, is very excited, up about 1.25% and all indexes there well above our midpoints and testing their own 2.5% levels, which we can expect to see tested today in the US. Those levels are: Dow 10,455, S&P 1,100, Nas 2,255, NYSE 7,000 and Russell 650. Of course the Russell is our laggard but as long as they can hold our mid-point at 635 – we’ll call that progress.
Until we get green on 3 of 5 of our levels though, we remain very cautiously bullish and, keep in mind – the best time to initiate disaster hedges is when the market is going up, not down so any failure at our resistance points today is going to lead us to up our covers. We get both oil inventories and natural gas inventories at 10:30 and the expectations are that we will see our first net drawdown in over 2 months as the tankers finally stop dumping crude (as I mentioned on Tuesday). We’ve been long USO since last week’s dip but we’ll have no tolerance for another dip below $75 (our target is our sweet spot at $77.50).


