
ECRI Leading Indicators Dip Again; Is a Double-Dip Recession Coming?
Courtesy of Mish
Inquiring minds are investigating leading indicators of the Economic Cycle Research Institute (ECRI). Here are a couple of charts.
Weekly Indexes

Monthly Indicators

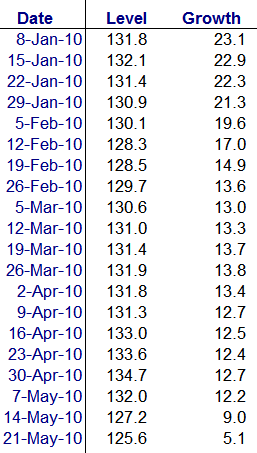
Recent Trend in WLI
Please click on the first link for WLI spreadsheet data all the way back to 1967 and other interesting charts.
My friend "BC" writes …
The WLI is again below the 126 level where it was all the way back to spring ’98, the point at which the growth of industrial production and private employment peaked.
The 126 level is below zero on a post-’00 trend rate basis as occurred when it dipped below zero in Apr.-Sept. ’00 and July ’08.
If the trend rate since Q3-Q4 ’09 persists, the WLI growth rate could fall below zero and reach the negative 5-6% by as soon as July-Oct. This is an area consistent with ECRI "forecasting" a recession.
At present, the ECRI gang are talking just deceleration of "growth". But I suspect that by no later than mid-summer they will shift to urging more Keynesian stimulus to "avoid a double-dip recession" when a deceleration to 0% and imminent contraction will likely already be underway.
Then, in hindsight, the ECRI will "forecast" a recession after it had already started, attributing the "unexpected" contraction to "policy missteps", "exogenous shocks", or some such silliness.
Makeup of the WLI
I do not have the exact percentage makeup of the WLI but reportedly it includes the Mortgage Bankers Association’s home purchase index, money supply, stock prices, initial jobless claims, corporate yield spreads (inverted), and corporate bond quality spreads.
It is debatable if any of those are signaling anything good. In fact, I suggest none of them are.
Moreover, it is also debatable if the stock market is a leading indicator. I suggest the stock market is a coincident indicator (if indeed it indicates anything at all).
The treasury yield curve is a leading indicator and the recent bullish flattening (long dated yields dropping) is certainly not a signal of economic recovery. Housing starts are also a leading indicator, and while "recovering" percentagewise, in absolute terms the number of housing starts is pathetic.
Housing Starts

Yield Curve March 2008 Through May 2010

click on chart for sharper image
Note: The above yield curve is from May 25. Yields have pushed back up slightly with the 10-year yield now at 3.29.
ECRI Track Record
Inquiring minds might be interested in A Look at ECRI’s Recession Predicting Track Record.
The ECRI did not predict the last recession until it had already started and I highly doubt they predict the next one either. A double-dip recession is on the way, assuming of course you believe we still aren’t in one.