
Mish takes on James Altucher’s wacko theory that the V in V-shaped recovery is a checkmark. The problem: focusing on a large percentage improvement from a low number to another low number takes the data out of the context. As an analogy, if you’re given three days to live and manage to live nine days, you didn’t recover. – Ilene
Disputing the Alleged "Checkmark Recovery"
Courtesy of Mish
One of the silliest cases I have seen to date regarding the alleged recovery comes from James Altucher, president of Formula Capital.
Altucher Says It’s Not a ‘V’, It’s Even Better, Look for New Highs by 2012
Partial Transcript
Aaron Task: Joining me now is James Altucher who says, not only is the recovery not over, and not only is it a "V Shaped Revovery, it’s checkmark shaped recovery. James you are wildly optimistic on the US economy right now?
James Altucher: I don’t want to say "wildly" because that sounds almost insane, and everyone is going to comment on these message boards that I’m completely whacko. At the same time if you look at all the data, go to the federal reserve website and look at every single chart of economic data, nonfarm payrolls, retail sales, inventories, it’s all a "V" or a checkmark. … The Debate is over. It’s already been a "V" the question is "Does it continue?" I think it does.
Completely Whacko
Yes James, you are completely whacko. I did go to the Fed website as you suggested and here are some charts to consider.
Civilian Unemployment

In terms of civilian employment there was a fast checkmark in the 70’s 80’s and 90’s but there is no sign of a "V" now, let alone a checkmark.
Auto Sales

Auto sales are now back to where they were in early 1980. This is the most miserable auto sector recovery ever in terms of actual numbers. Moreover, the data worse than it looks if one factors in population growth.
Looking for a checkmark? If you hold up the chart and look in a mirror you might see a nice one now, but the real one from 1980 vanishes.
Total Consumer Credit
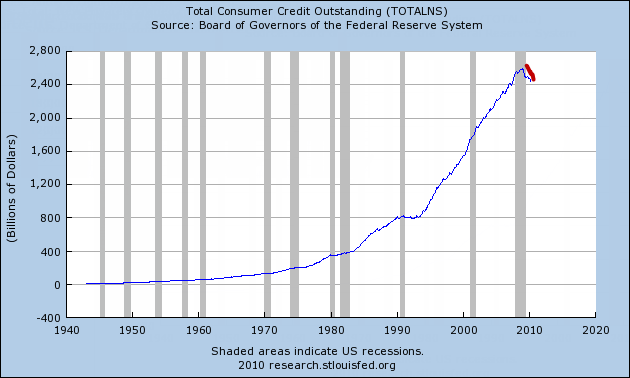
With consumer credit, there is no "V" nor checkmark, nor any recognizable improvement, rather an unprecedented plunge dating all the way back to 1940.
Total Bank Credit

Total bank credit has had a recovery of sorts off an unprecedented plunge. However it is not anything one should properly call a "V".
Housing Starts

Housing starts is one of the few genuinely leading indicators. 1990 and 2000 certainly had "V" shaped recoveries. However the chart clearly shows it it preposterous to call the current blip a "V" shaped recovery. Housing starts are still below every trough all the way back to 1960.
Moreover, it has taken repeat $8,000 tax credits to even get that little blip.
As with auto sales, the proper way of viewing this is on a population adjusted basis (not shown), which would make that miserable chart look far worse.
Sick Mortgage Market
Finally, Fannie, Freddie, and the FHA now account for 90% of mortgage market. Please see FHA Volume is Sign of ‘Very Sick System’ for details.
Recovery? Please be serious. We have had a recovery in financial assets reflecting a $trillion thrown at anything that would move, and those anemic charts are all we have to show for it.
So where does Altucher get his checkmark theory?
This chart will show how.
Housing Starts Percent Change From Year Ago

There’s your checkmark. Please compare to the previous chart.
If you believe that constitutes a checkmark recovery (or even a "V" shaped recovery), then you are only fooling yourself.