
Courtesy of Jean-Luc Saillard.
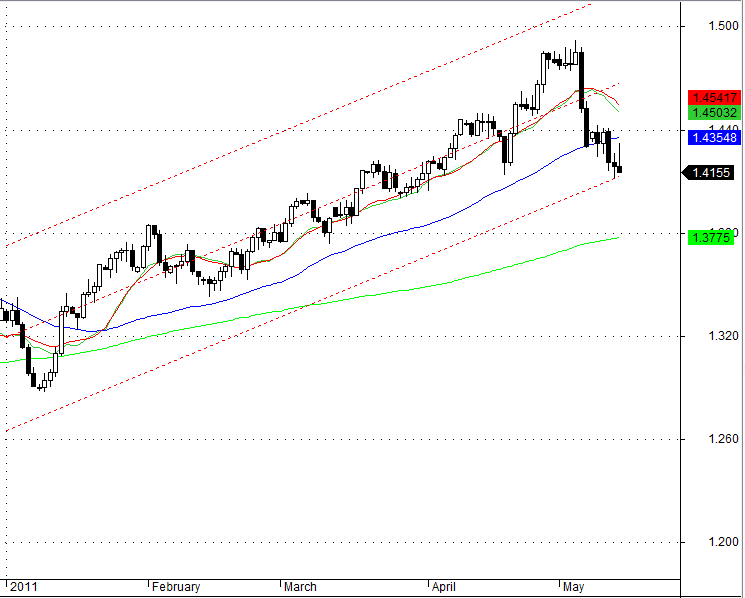
Some euro charts to put the latest moves in perspective.
First a regression channel for 2011. We are now at the bottom of the channel which should provide some support.
And now for some Fibonacci lines – using the 2001 low and highs as anchors. As with the regression channel, 1.41 seems to be a good support level. At least temporarily.

And finally, a Fibonacci regression using the previous highs of last October and the lows of January as anchors. Once again, the 1.41 line is significant.
