

By VisualCapitalist. Originally published at ValueWalk.
In January of 2019, Apple Inc (NASDAQ:AAPL)’s market capitalization stood at $700 billion.
Q4 2021 hedge fund letters, conferences and more
While this was perceived as a colossal figure at the time, when we fast forward to today, that valuation seems a lot more modest. Since then, Apple has surged to touch a $3 trillion valuation on January 3rd, 2022.
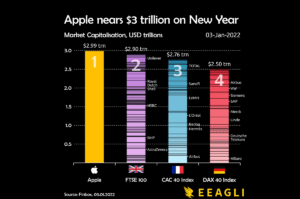
To gauge just how monstrous of a figure this is, consider that Apple is no longer comparable to just companies, but to countries and even entire stock indexes. This animation from James Eagle ranks the growth in Apple’s market cap alongside top indexes from the UK, France, and Germany.
Let’s take a closer look.
Apple Takes On Europe
The three indexes Apple is compared to are heavyweights in their own right.
The FTSE 100 consists of giants like HSBC and vaccine producer AstraZeneca, while the CAC 40 Index is home to LVMH, which made Bernard Arnault the richest man in the world for a period of time last year.
Nonetheless, Apple’s market cap exceeds that of the 100 companies in the FTSE, as well as the 40 in each of the CAC and DAX indexes.
| Stock/Index | Market Cap ($T) | Country of Origin |
| Apple | $3.00T | |
| FTSE 100 | $2.90T | |
| CAC 40 Index | $2.76T | |
| DAX 40 (Dax 30) Index* | $2.50T |
*Germany’s flagship DAX Index expanded from 30 to 40 constituents in September 2021.
It’s important to note, that while Apple’s growth is stellar, European companies have simultaneously seen a decline in their share of the overall global stock market, which helps make these comparisons even more eye-catching.
For example, before 2005, publicly-traded European companies represented almost 30% of global stock market capitalization, but those figures have been cut in half to just 15% today.
Here are some other approaches to measure Apple’s dominance.
Apple’s Revenue Per Minute vs Other Tech Giants
Stepping away from market capitalization, another unique way to measure Apple’s success is in how much sales they generate on a per minute basis. In doing so, we see that they generate a massive $848,090 per minute.
Here’s how Apple revenue per minute compares to other Big Tech giants:
| Company | Revenue Per Minute |
| Amazon | $955,517 |
| Apple | $848,090 |
| Alphabet (Google) | $433,014 |
| Microsoft | $327,823 |
| $213,628 | |
| Tesla | $81,766 |
| Netflix | $50,566 |
Furthermore, Apple’s profits aren’t too shabby either: their $20.5 billion in net income last quarter equates to $156,000 in profits per minute.
How Apple Compares To Countries
Lastly, we can compare Apple’s market cap to the GDP of countries.
| Country (excluding Apple) | Total Value ($T) |
| Apple | $3.0T |
| Italy | $2.0T |
| Brazil | $1.8T |
| Canada | $1.7T |
| Russia | $1.7T |
| South Korea | $1.6T |
| Australia | $1.4T |
| Spain | $1.4T |
| Mexico | $1.3T |
| Indonesia | $1.1T |
What might be most impressive here is that Apple’s market cap eclipses the GDP of major developed economies, such as Canada and Australia. That means the company is more valuable than the entire economic production of these countries in a calendar year.
That’s some serious scale.
Article by Visual Capitalist
Updated on
Sign up for ValueWalk’s free newsletter here.