

Before we begin, check out yesterday’s Podcast:
Deep Dive: Hardware Bottlenecks Shatter Deceptive Market Highs
-
[00:00 – 05:57] The Illusion of Calm & The $350B Liquidity Drain: The Dow breaking 53,000 is a mirage built on dead volume (sub-200M SPY shares). A massive $350 billion liquidity vacuum is actively forming as the Fed’s Reverse Repo Facility runs dry, meaning capital will be pulled directly out of commercial bank reserves to absorb new government debt.
-
[05:57 – 10:44] The Death of Forward Guidance & Market Concentration: New Fed Chair Kevin Warsh has officially killed the “dot plot.” The market is flying blind into sticky wage inflation (3.5%) and weak job growth, relying entirely on algorithmic flows blindly funneling capital into just 7 tech giants that carry a third of all US corporate earnings.
-
[10:44 – 16:15] The 2028 AI Hardware Brick Wall: The entire $1.3 trillion AI CapEx narrative just hit a physical limit. Nvidia’s next-gen “Kyber” server racks are severely delayed to 2028 due to physical manufacturing bottlenecks (specifically cooling and circuit board midplanes). The digital dream is colliding with the reality of physics.
-
[16:15 – 21:09] The Institutional “Hard Asset” Land Grab: While retail traders pile margin debt into semiconductor software, the “smart money” is hoarding physical infrastructure. We track massive physical capitulations: TerraWulf locking Anthropic into a 20-year data center lease, Broadcom securing a 5-year Apple ASIC deal, and Lockheed snapping up advanced sonar monopolies.
-
[21:09 – 36:25] The Consumer Squeeze & Market Absurdity: We break down the “Export Valve Tax” driving up local gas prices, the corporate theater of “Trump accounts” enriching legacy asset managers, and the comedy of Strategy Inc. dumping Bitcoin to pay fiat dividends. Plus, a look at the “Ozempic effect” permanently crushing alcohol stocks (STZ) and a fully automated AI bot-war ravaging Reddit.
-
[36:25 – 42:18] The H2 2026 Defensive Playbook: How to pivot from digital hope to physical reality. We outline the strict stress-test targets for the bottom 450 companies of the S&P: massive cash-flowing physical operators trading at 4x to 12x multiples, including Stellantis (STLA), Barrick Gold, Copper Miners (CUPX/CUPP), and Greenbrier Companies (GBX).
-
[42:18 – End] Tactical Moves & Options Masterclass: Actionable steps for tomorrow’s opening bell. We cover the U.S. Bancorp (USB) catalyst upgrade, the sovereign risk warning to avoid Zim Integrated Shipping, and a masterclass breakdown of why the Long-Term Portfolio (LTP) achieved a sub-zero net basis on its 2028 Nike (NKE) structure by relentlessly selling premium, compared to a retail trader just “hoping” the stock goes up.
It’s good to have a background for our portfolio discussion as we move into the 2nd half of 2026.
It’s been a great month for our $700/Month Portfolio, which is at $136,461, which is up $11,088 since our June 2nd Review but only up $3,616 since our June 16th Review and that’s a slowing pace we should be very concerned about although, overall, we predicted we’d make $2,326/week and that should be $11,630 in 5 weeks – so we’re actually performing almost EXACTLY as expected or, as I said in the June 16th Review:
“Everything is proceeding as I have foreseen… muhahahaha!!!“
I also said: “See, you don’t have to be the Dark Lord of the Sith to do this – it’s just math…” and it still is! If you CONTROL your portfolio and analyze each position and you KNOW how they should perform in a flat market or an up 20% or down 20% market – then you are not very likely to be surprised by the results, right?
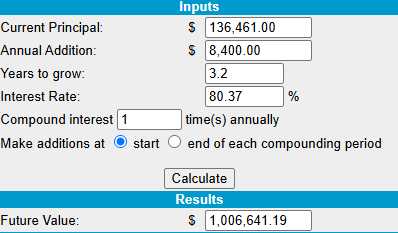 At the moment, we’re a month away from year 4 of this project and, at this pace, we have a 314.8% gain divided by 47 months is 6.69% per month x 12 months is an annual 80.37% return (simple), which means we will be turning this $136,461 into $1M in just 3.2 years. That’s IF we can keep up this pace – which is unlikely, but I’ve been saying it’s unlikely for the last 4 years and the market, with it’s non-stop rally, keeps proving me wrong!
We are now 38 months away from hitting our $1M target (at this pace), which would be September of 2029 and, since our original goal was to hit $1M in 30 years (8/25/52) – I’m pretty happy with how far ahead of schedule we are!
To be clear to our new Members – this portfolio is on track to turn $136,461 into $1,006,641 in 3.2 years – so you haven’t missed much as we still have $863,539 (632%) left to gain!
This is just the mathematical grind of our “Be the House – NOT the Gambler!” strategy playing out in a small (not so small anymore), no-margin portfolio. For those who are new – here’s me discussing the strategy with Forbes.
We began back on August 25th or 2022 with $700 and each month we add $700 and, of course, reinvest our profits. We are doing this using NO MARGIN rules and we are continuing to do so – even though we now have over $100,000 and do qualify for Portfolio Margin accounts but the assumption is this is IRA/401K money.
Despite the huge gains, this is a VERY CONSERVATIVE portfolio as our goal here is to teach our Members that you don’t need a lot of money and you DON’T need to swing for the fences to make very good money making a series of small, conservative bets using our VALUE INVESTING STRATEGIES. In the past year, our 12 prior Portfolio Reviews were:
-
- How to Become a Millionaire by Investing $700 per Month – Part 46/360
- How to Become a Millionaire by Investing $700 per Month – Part 45/360
-
How to Become a Millionaire by Investing $700 per Month – Part 44/360
-
How to Become a Millionaire by Investing $700 per Month – Part 43/360
-
How to Become a Millionaire by Investing $700 per Month – Part 42/360
- How to Become a Millionaire by Investing $700 per Month – Part 41/360
- How to Become a Millionaire by Investing $700 per Month – Part 40/360
- How to Become a Millionaire by Investing $700 per Month – Part 39/360
- How to Become a Millionaire by Investing $700 per Month – Part 38/360
-
How to Become a Millionaire by Investing $700 per Month – Part 37/360 – Year 4 Begins!
-
How to Become a Millionaire by Investing $700 per Month – Part 36/360 – 3 Years In!
- How to Become a Millionaire by Investing $700 per Month – Part 35/360
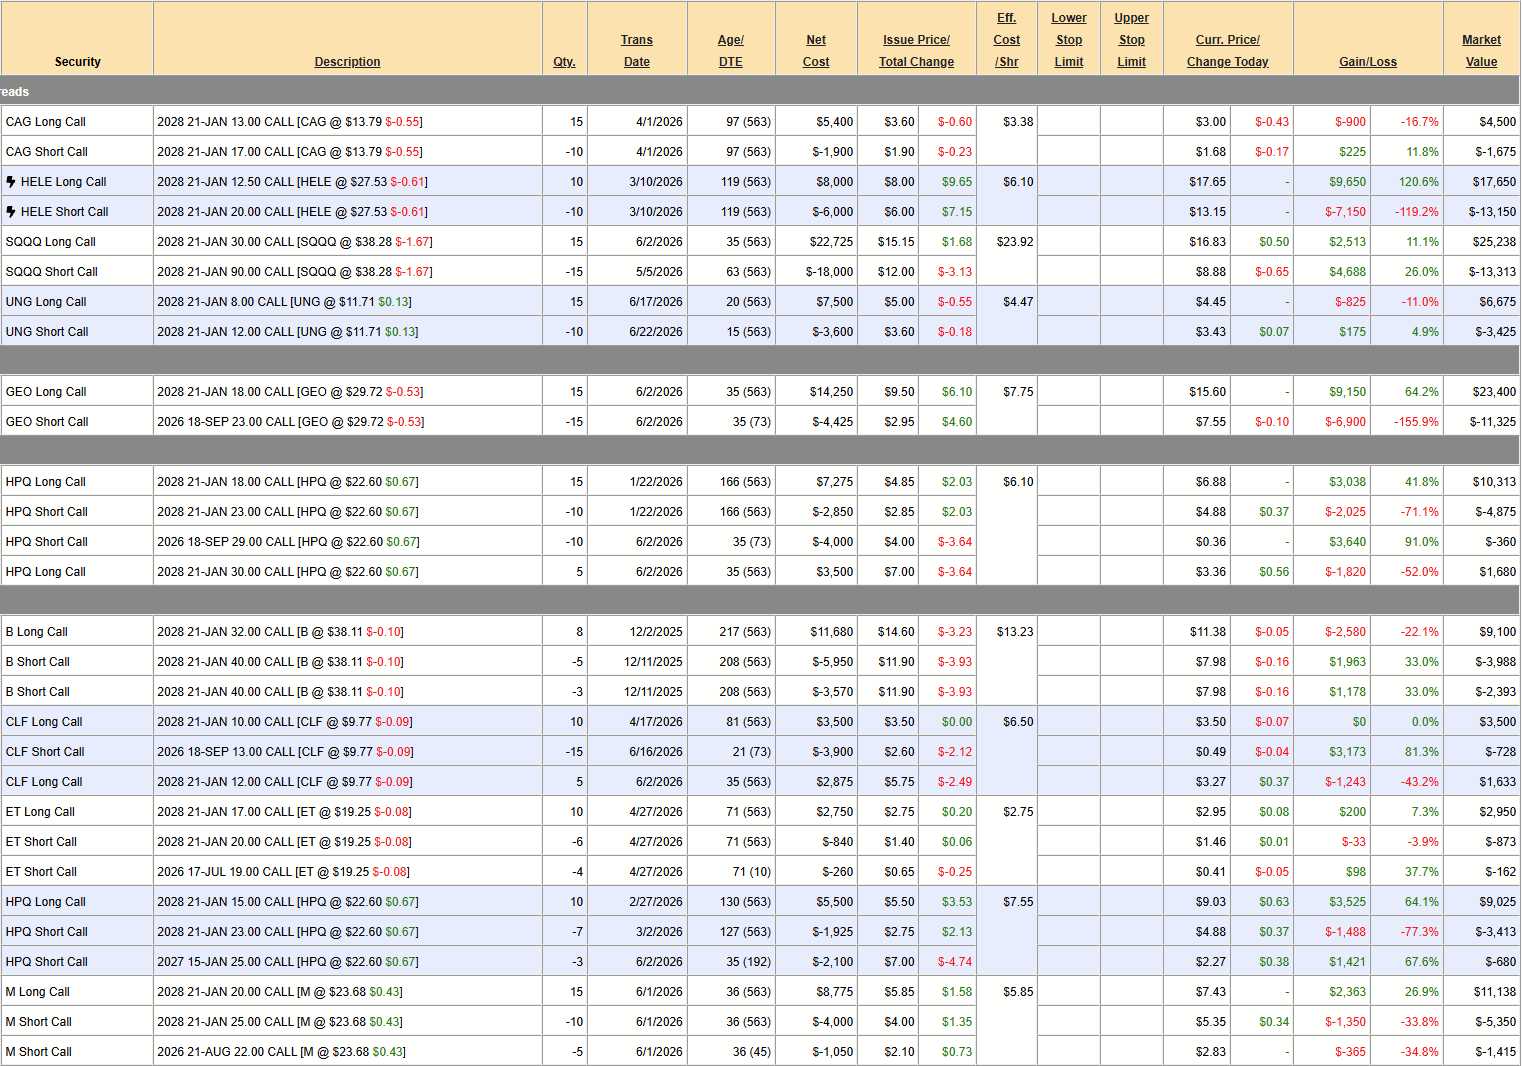
We spent A LOT of money in the past month and we’re down to just $18,583 (13.6%) in CASH!!! and I’m not happy about that AT ALL – so I’m going into this review LOOKING to cash out anything that I don’t ABSOLUTELY want to own for the next 30 days:
-
- CAG – Although it’s down, this is the kind of trade we want to rotate into – no out of! If we sell 5 Jan $14 calls for $1.40, that’s $700 and the net of the spread is $2,825, so we’re collecting 24.7% for 6 months while we wait to see if things pick up (earnings are next week (15th).
- This is, overall, a potentially $6,000 spread so we have $3,875 (182%) upside potential PLUS two more sales of $700 ($1,400) for another potential 65.8% in premium sales. Good for a New Trade, of course.
- You can see how we get to 80% a year, right?!?
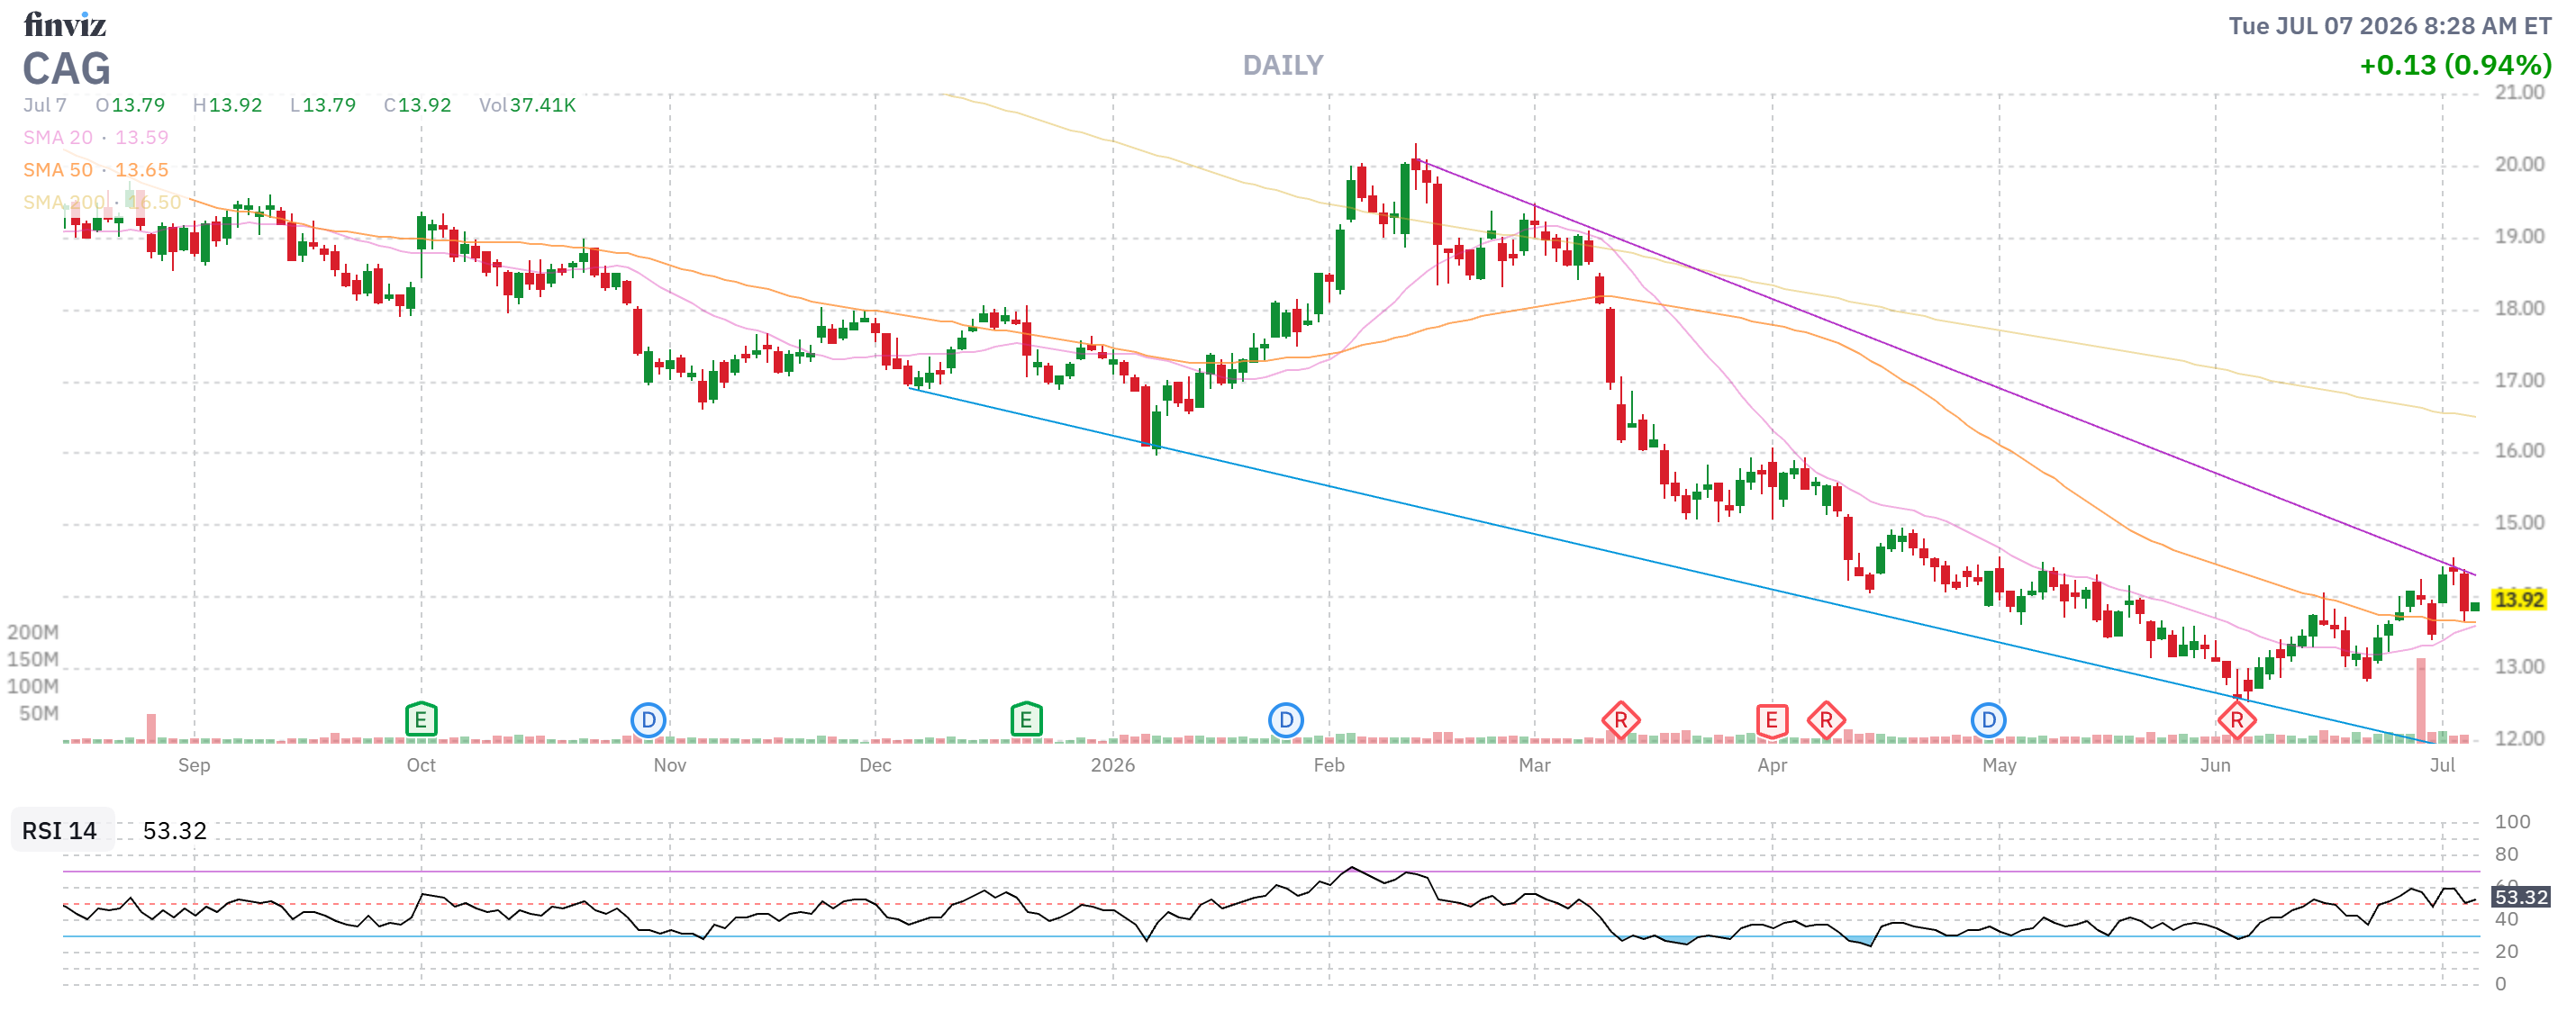 So our goal, to clarify, is to raise CASH!!! – It doesn’t HAVE to be through closing positions, does it?
-
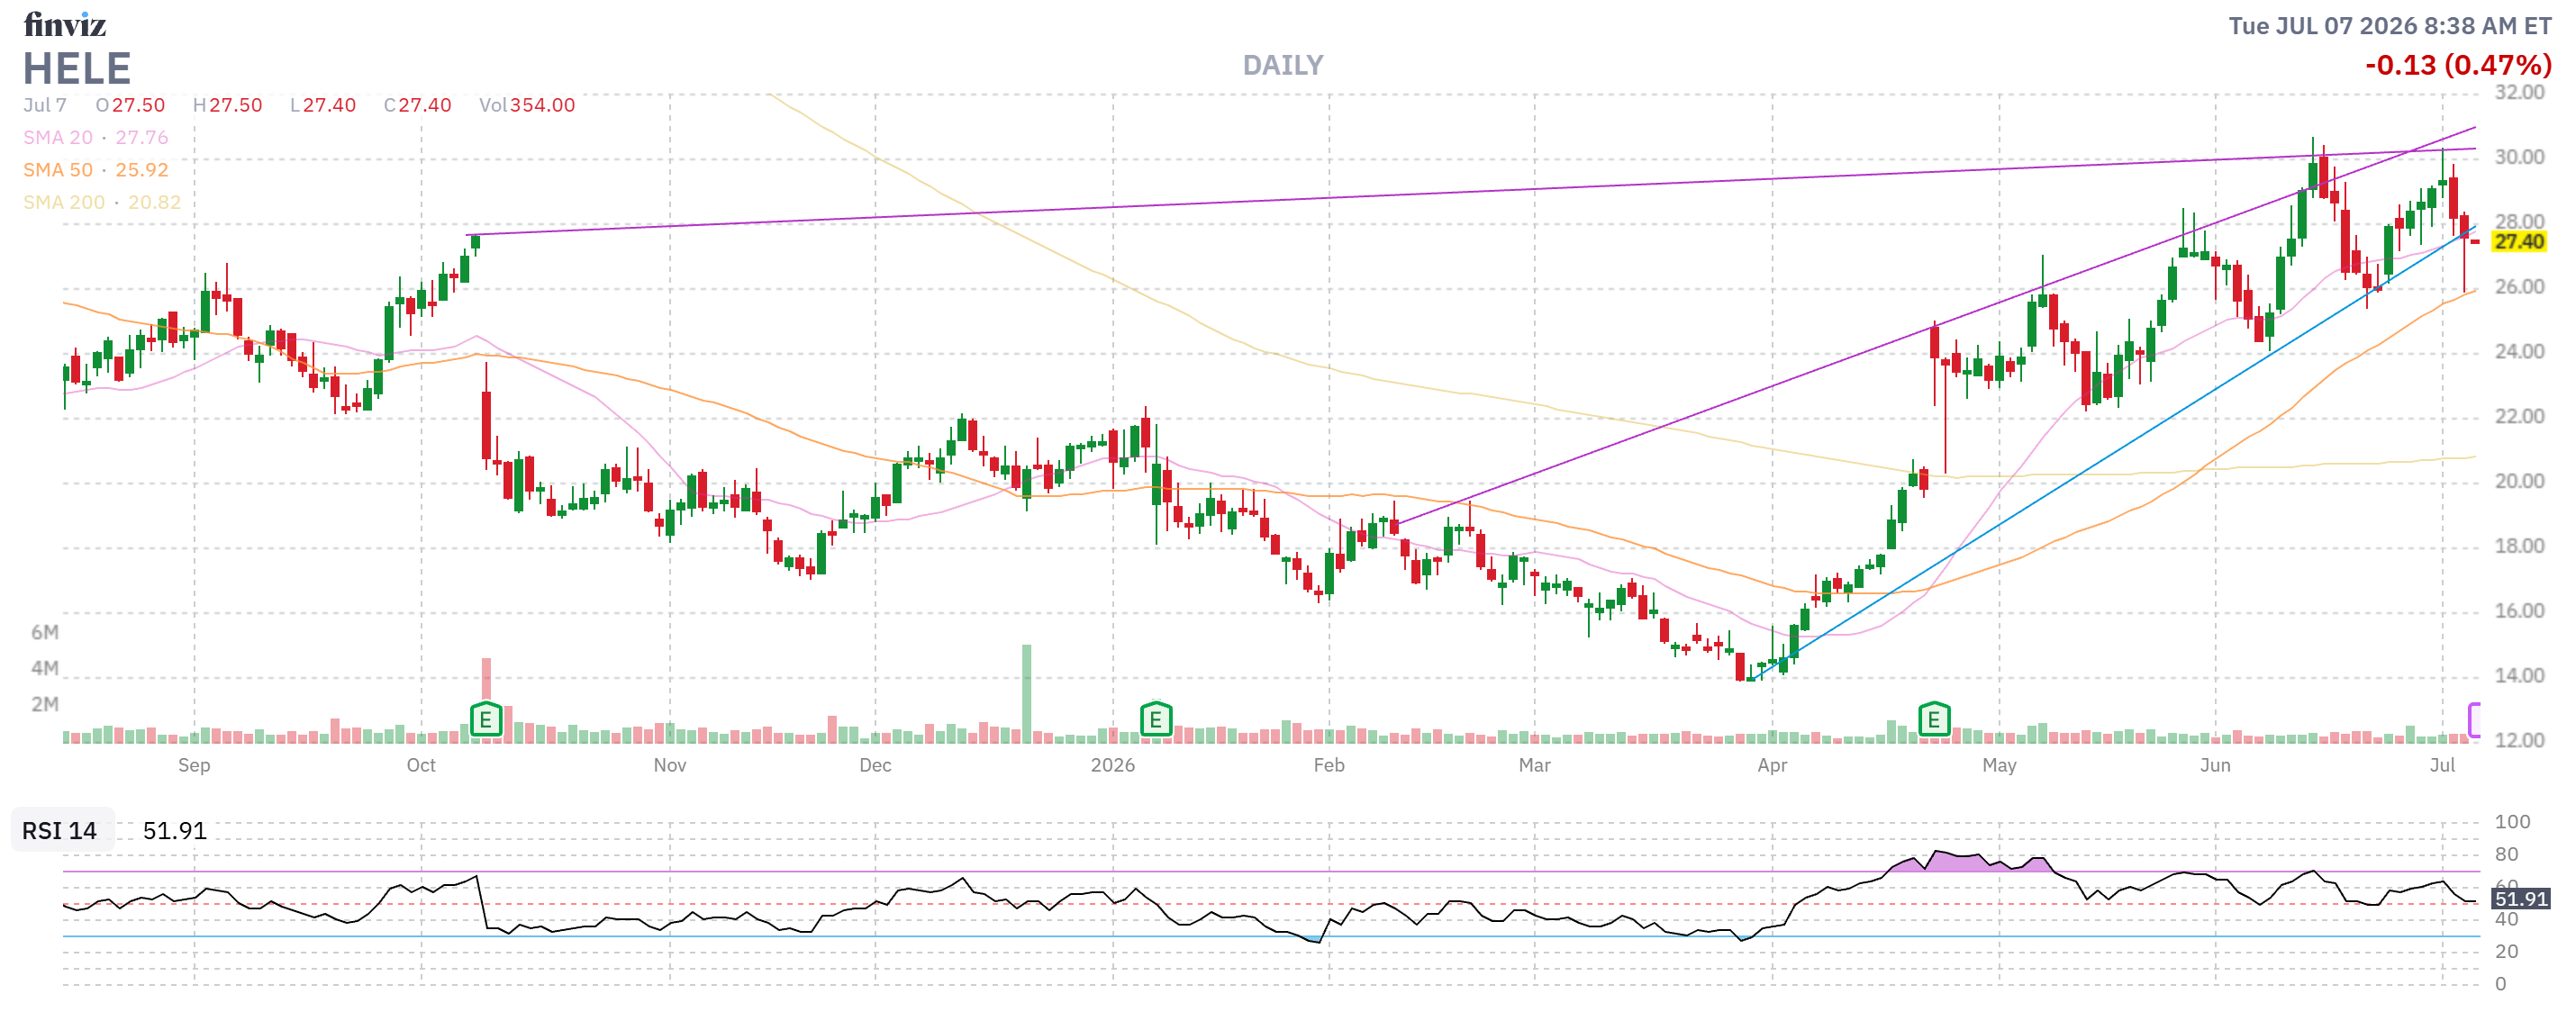
- HELE – Miles over our goal at net $4,500 on the $7,500 spread so we still have $3,000 (66.6%) upside potential and I don’t have any reason to doubt we’ll stay over $20 and we can even spend $2.50 ($2,500) to roll the spread $5 ($5,000) wider – so I don’t have a good reason to cash this in and it’s even Good for a New Trade – if 66.6% in 18 months isn’t too boring for you…
-
- SQQQ – This is tricky as we’re up on both ends due to volatility/sentiment quirks and it’s net $11,925 and that’s probably the worst case if we cash it out. Meanwhile, it’s a $45,000 spread so it’s offering our portfolio $33,075 of downside protection but I don’t intend to leave anything that needs protecting so we’re going to CASH IT OUT and I’ll decide at the end if we want to put something back.
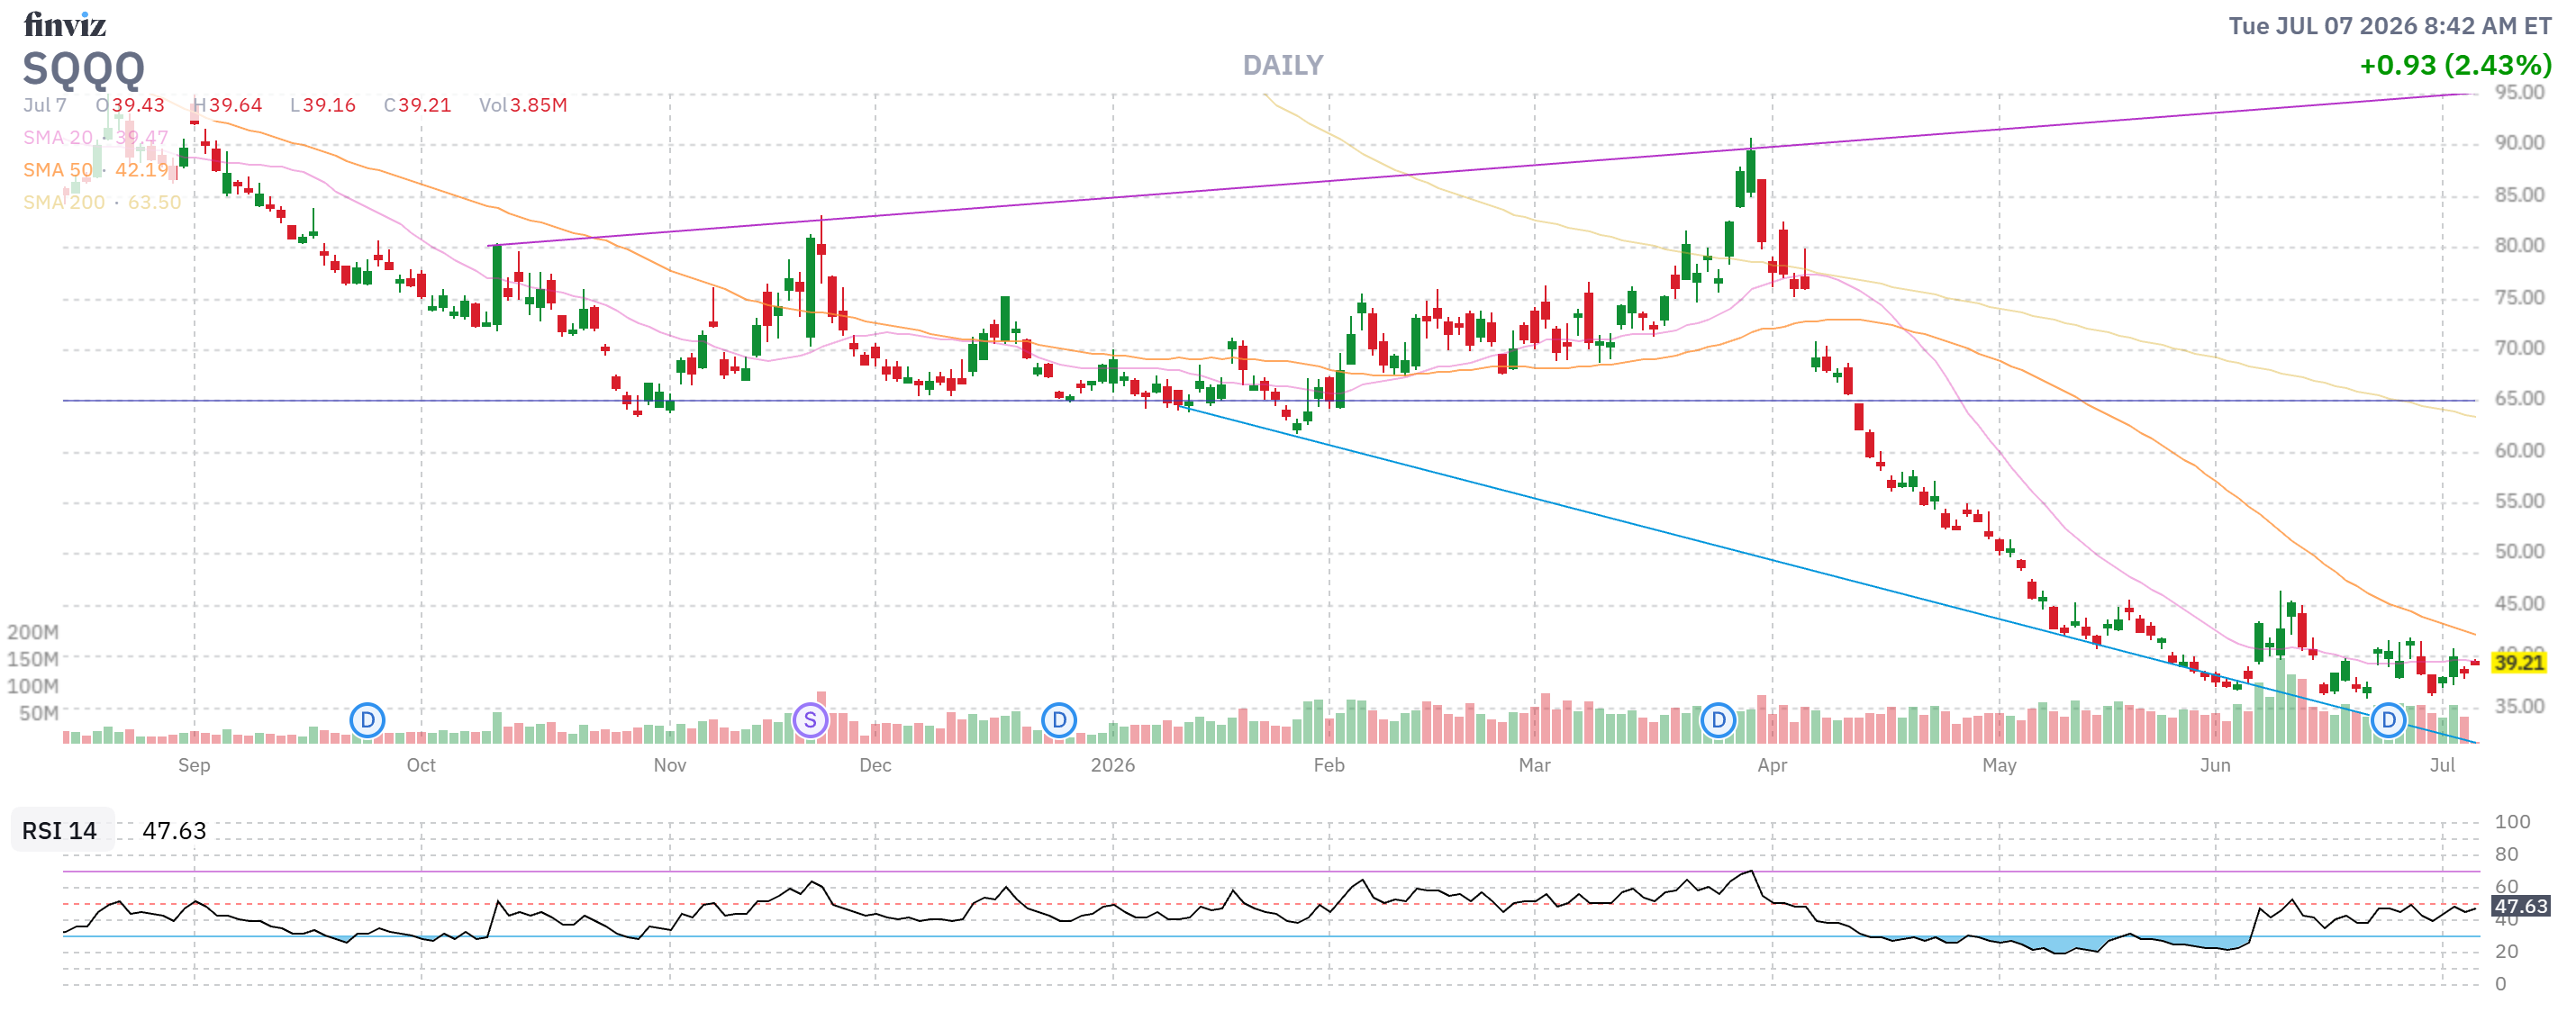
Now we’re performing without a net – that raises the stakes on whether or not we keep the rest, doesn’t it?
-
- UNG – At our goal and it’s El Nino (hurricanes) so I like this trade but it’s not liking us so far at net $3,250 on the $6,000 spread but, as I said, it’s at our goal so I have great faith in our $2,750 (84.6%) of upside potential but that does NOT excuse us from selling 5 Sept $12 calls for 0.75 ($375) to raise a bit more cash.
- So now our net is $2,875 with $3,125 (108%) upside potential PLUS 5 more quarterly sales is another potential $1,875 (65.2%) in premium sales. And now it is Good for a New Trade!
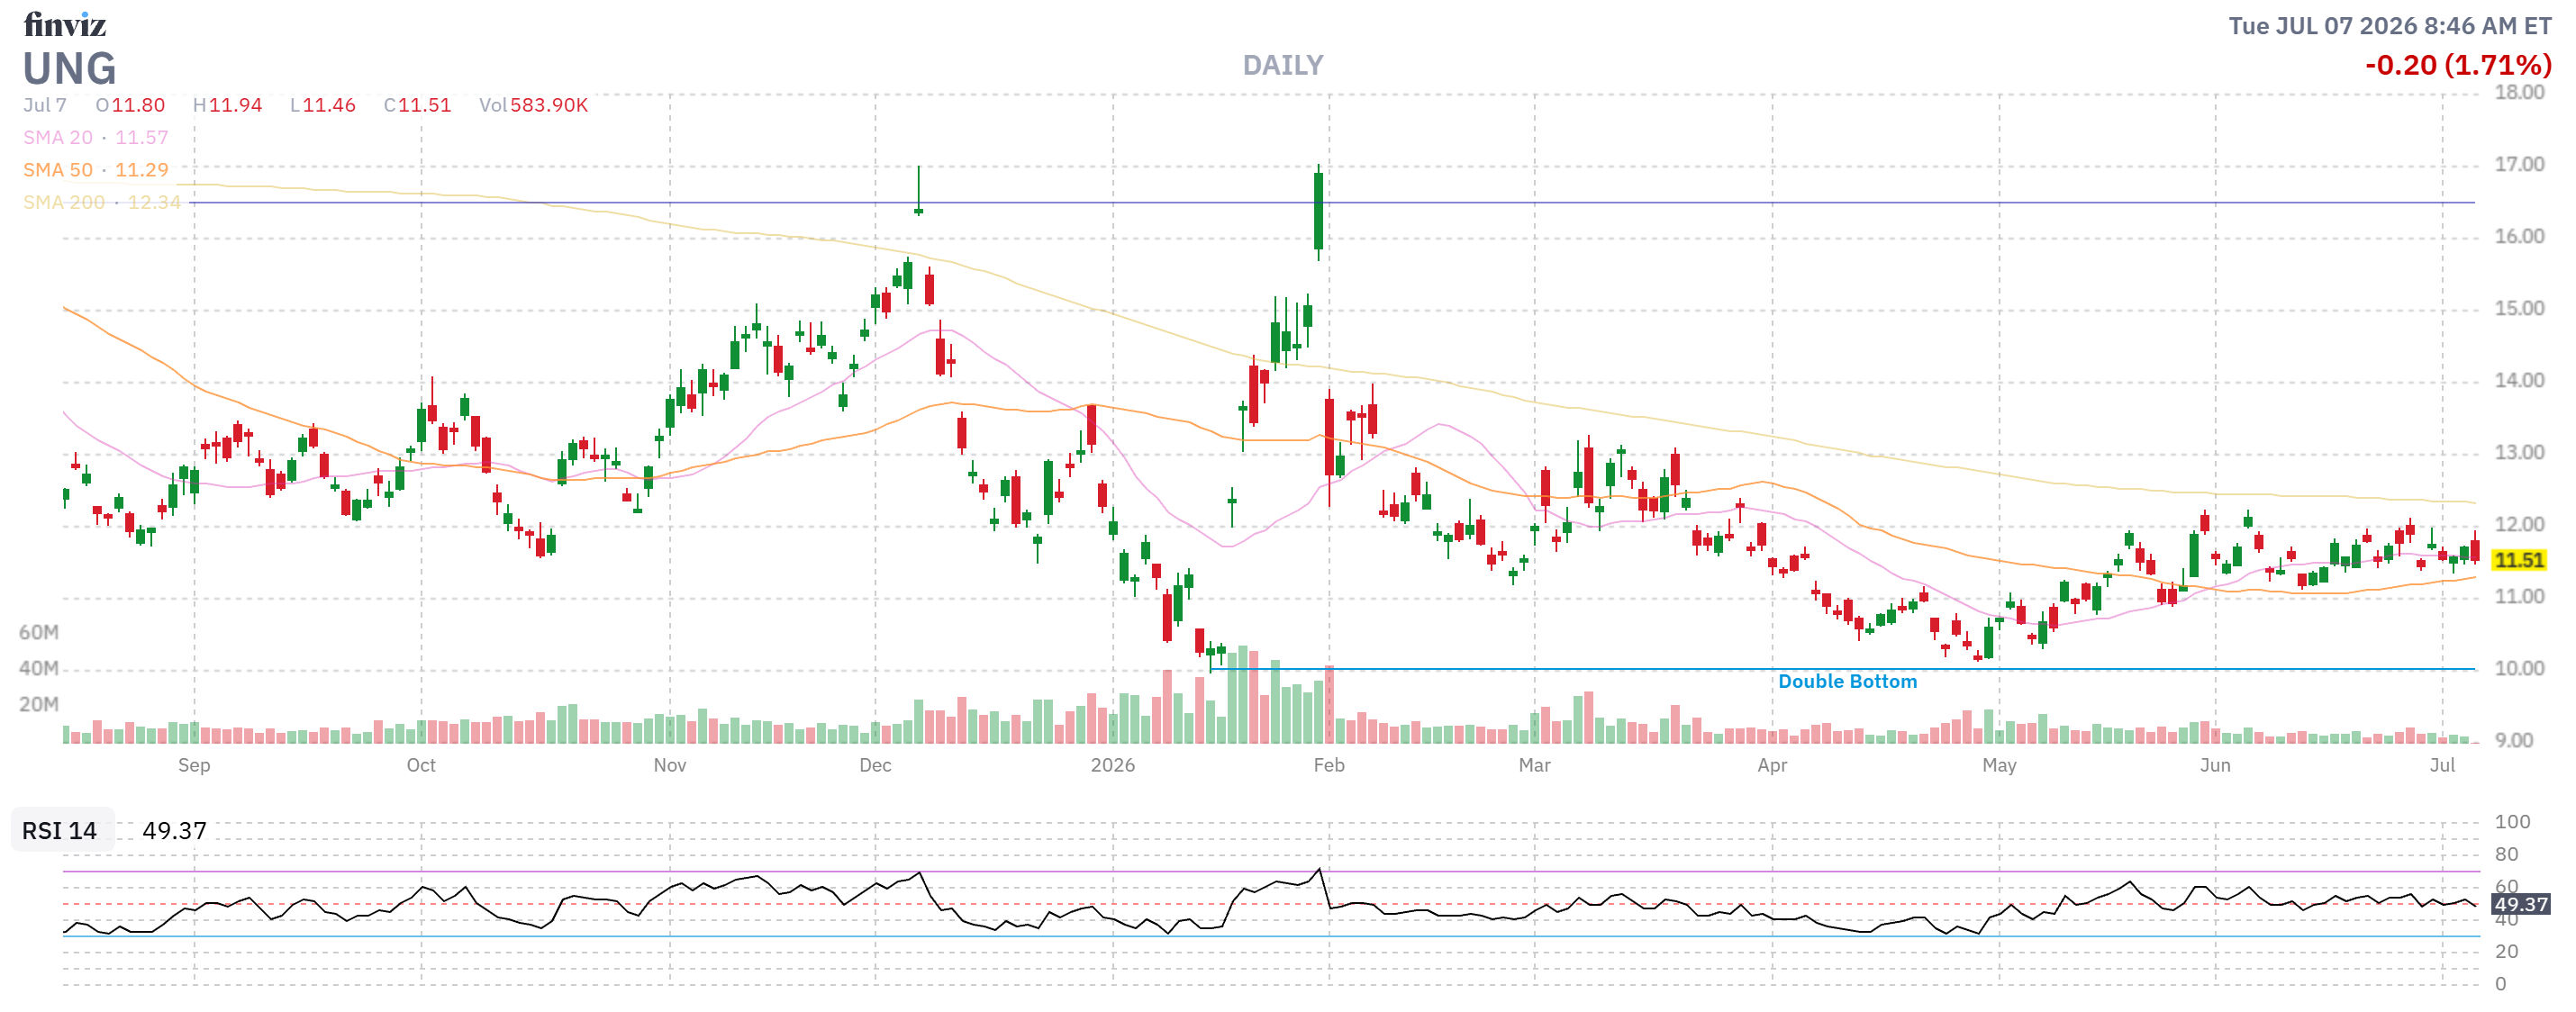
This goes back to what we discussed yesterday, in chat, with Swampfox’s Nike trade. Look at the DRASTIC difference selling just $375 worth of short calls makes to this trade! We went from boring 84.6% upside potential and we lowered the basis (by collecting $375) and now plan to turn it into an income spread (as it’s at our goal so we won’t be greedy) and NOW we have 173.2% upside potential – 100% MORE and, more importantly, MORE THAN OUR AVERAGE ANNUAL RETURN.
THAT is the difference between collecting premiums and NOT collecting premiums – even without using any margin at all!
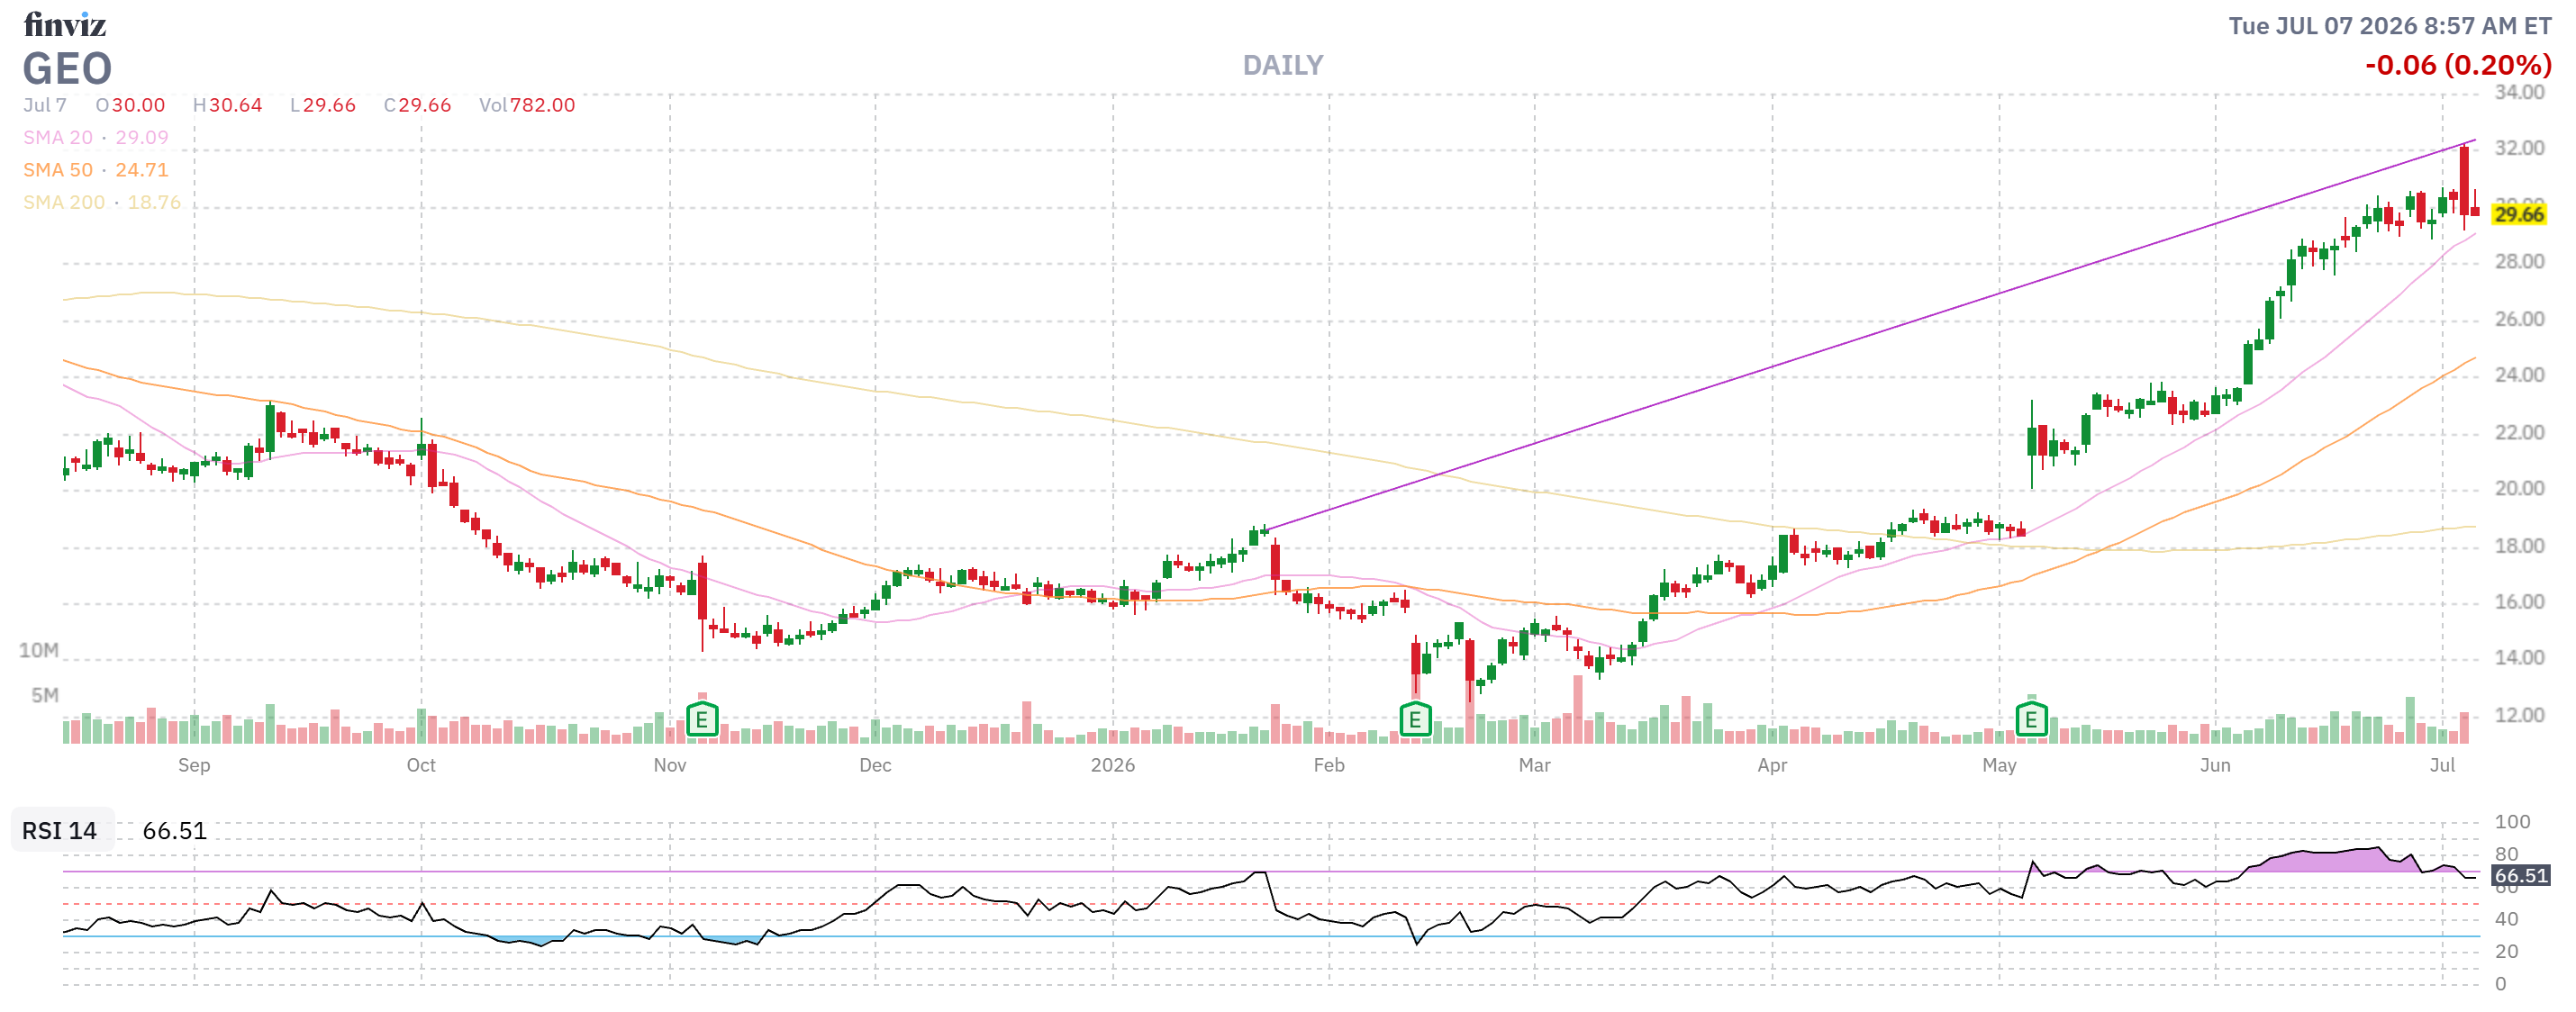
GEO – Remember we had that funny premise that Trump was going to round up all the immigrants and he had to put them somewhere? JACKPOT!!! Yes, investing in GEO is like investing in Hitler’s favorite oven company but we are investors, not moral philosophers. If it in any way benefitted GEO that we buy and sell options contracts on their stock – I wouldn’t do it – but it doesn’t – so grow up!
Anyway, as it stands, we have lovely blood-stained profits of $2,250 so far and the spread is net $12,075 out of a possible (assuming we roll to the 2028 $35s, which are $8) $25,500 so, unless Trump is impeached or the Supreme Court tells him no (fat chance!) – I don’t see the point in cashing these in and it’s too soon to roll so we’ll call it $13,425 (111%) upside potential and that too, is Good for a New Trade.
-
- HPQ – We were getting blown out and, rather than panic and buy back the short calls – we bought 5 more longs to cover. Now we are back to $22.62 is on track – so weird! It’s net $6,758 on the $18,000 spread (at $30 with rolls) and we can buy back the short Sept $29s for $360 and sell 10 Sept $24 calls for $1.50 ($1,500) to get the income train rolling and now that’s $12,382 (220%) upside potential on the 2028 spread PLUS 5 more chances to sell $1,500 is another potential $6,000 (106%) and NOW it’s Good for a New Trade. See the difference?
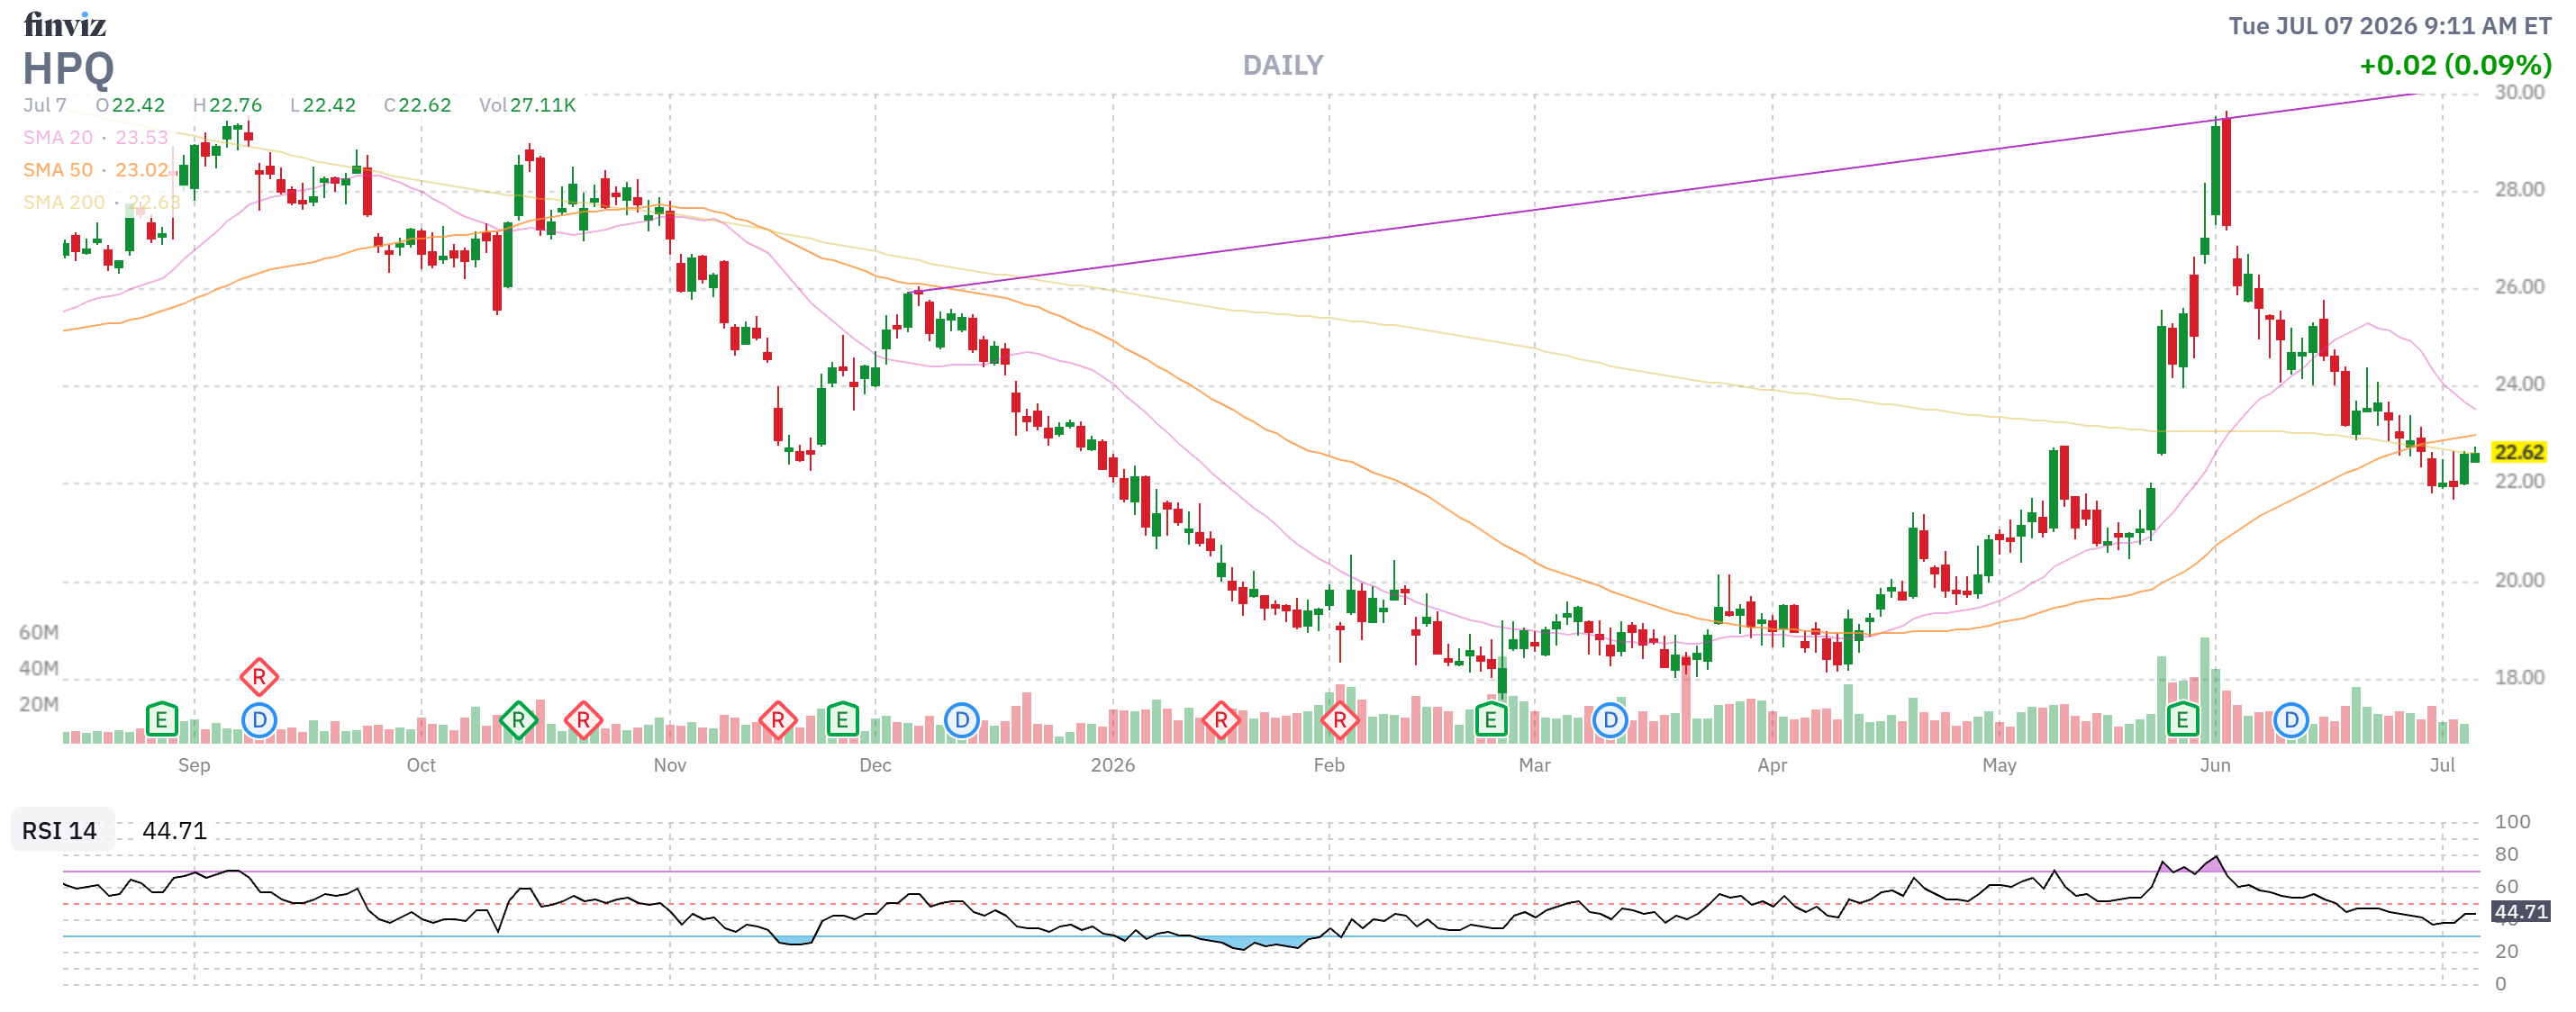
Important point: Selling 10 Sept $24 calls for $1.50 does not cap our gains at $24 because the 2028 $30 calls are $3.36 – TWICE as much as the Sept $24s and the 2028 $30s have a Delta of 0.42 while the Sept $24s have a Delta of 0.43 and the Theta Decay for the September is WAY HIGHER so we can certainly roll the September short calls to the 2028 short calls at will – which means our cap is $30, not $24!
-
- B – I should clean that up but here’s an example where we were forced to roll our short calls out of trouble. Still pretty much at goal at net $2,719 on the $6,400 spread with $3,681 (135%) upside potential – so that’s a keeper and it’s Good for a New Trade.
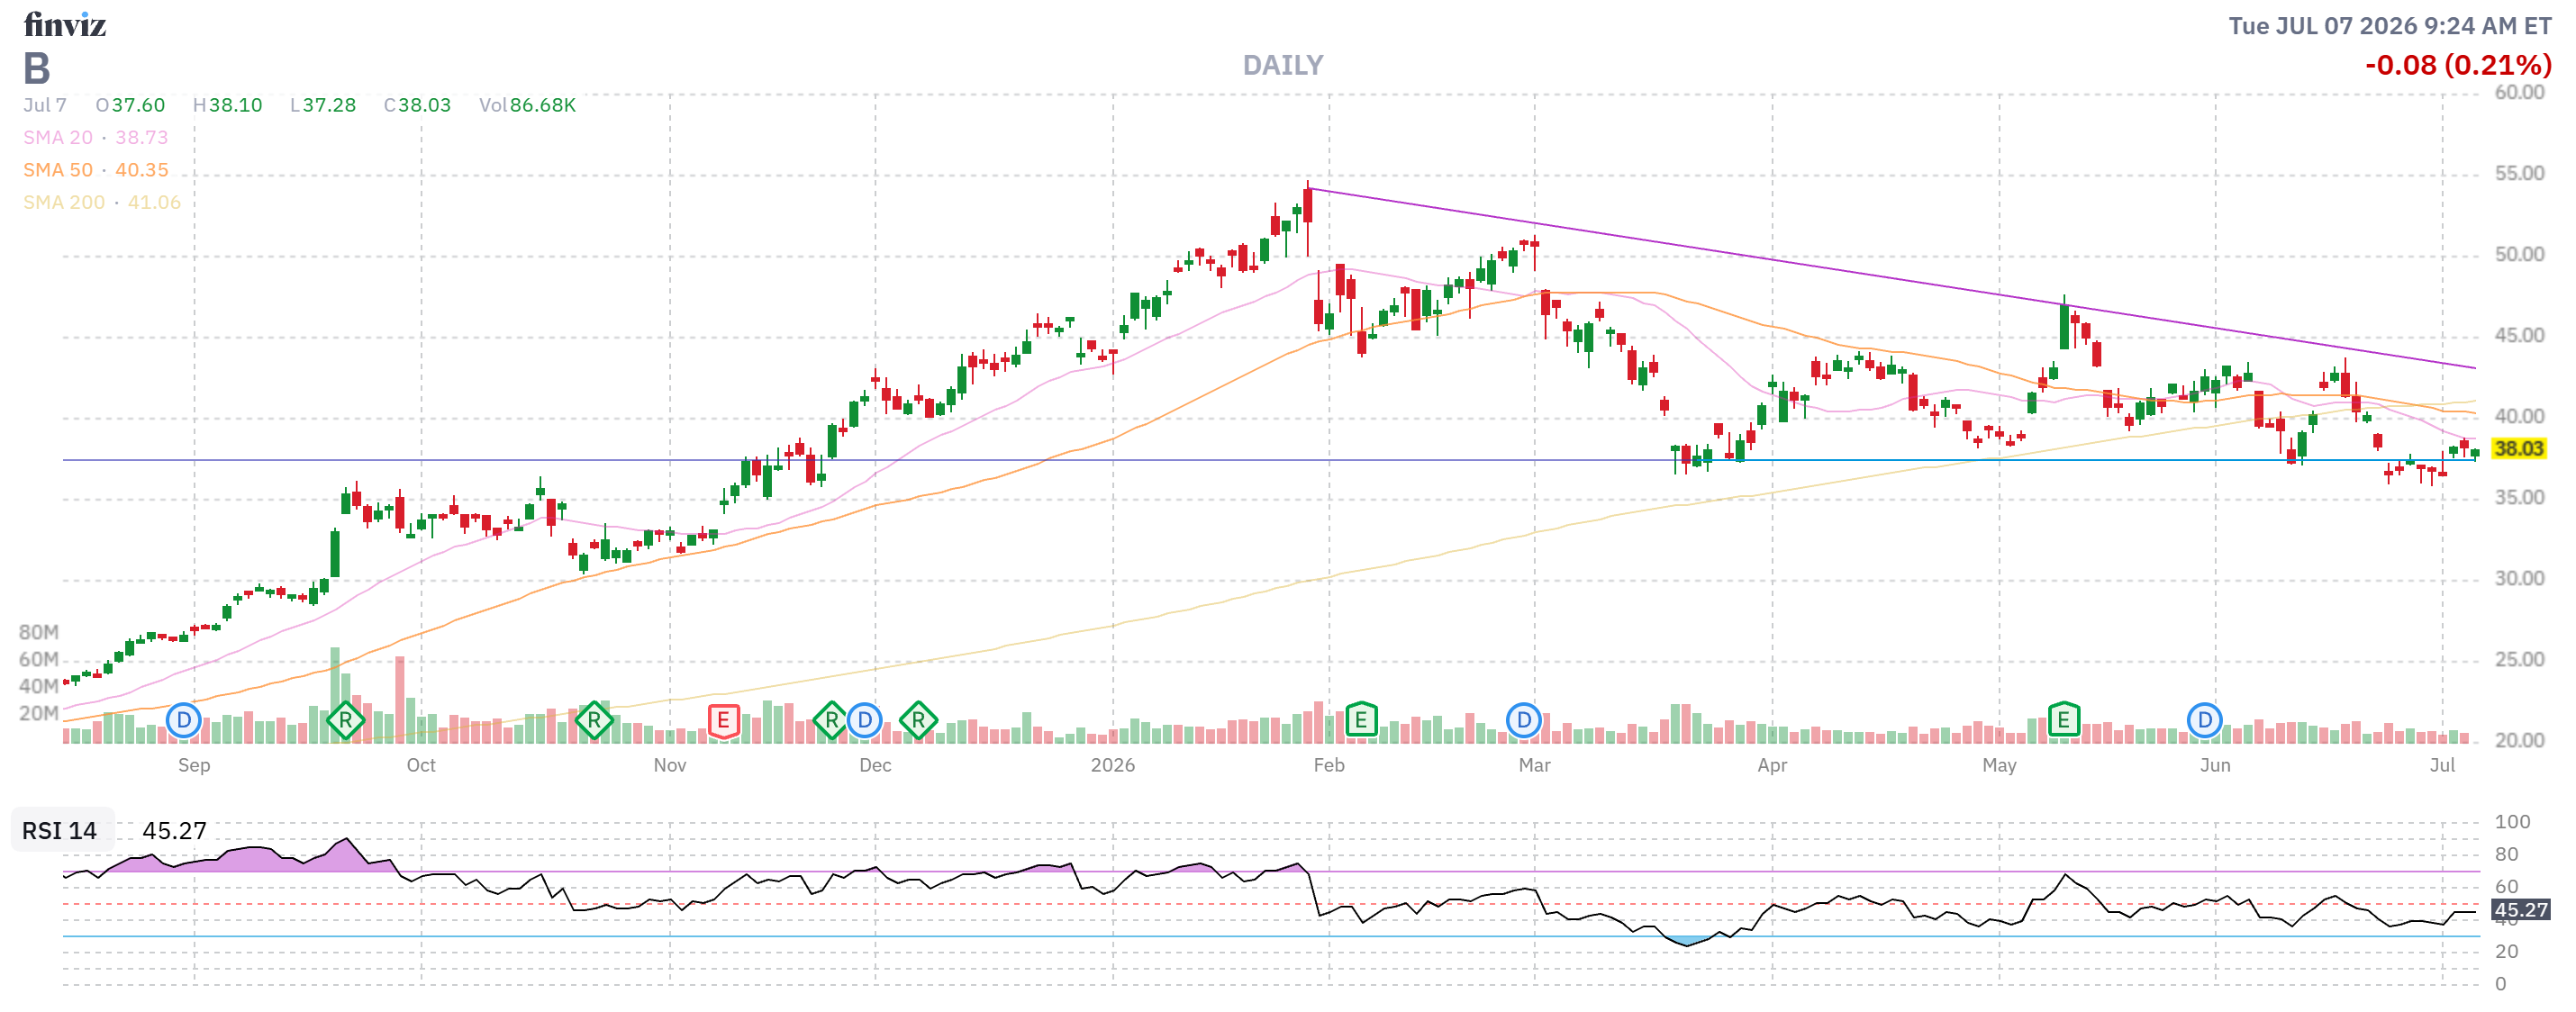
And, by the way, it’s not a keeper just because it has 135% upside potential (a bit over our 18-month average) almost without going any higher but because of the CERTAINTY we feel about that happening. There has to be a healthy combination of the two.
-
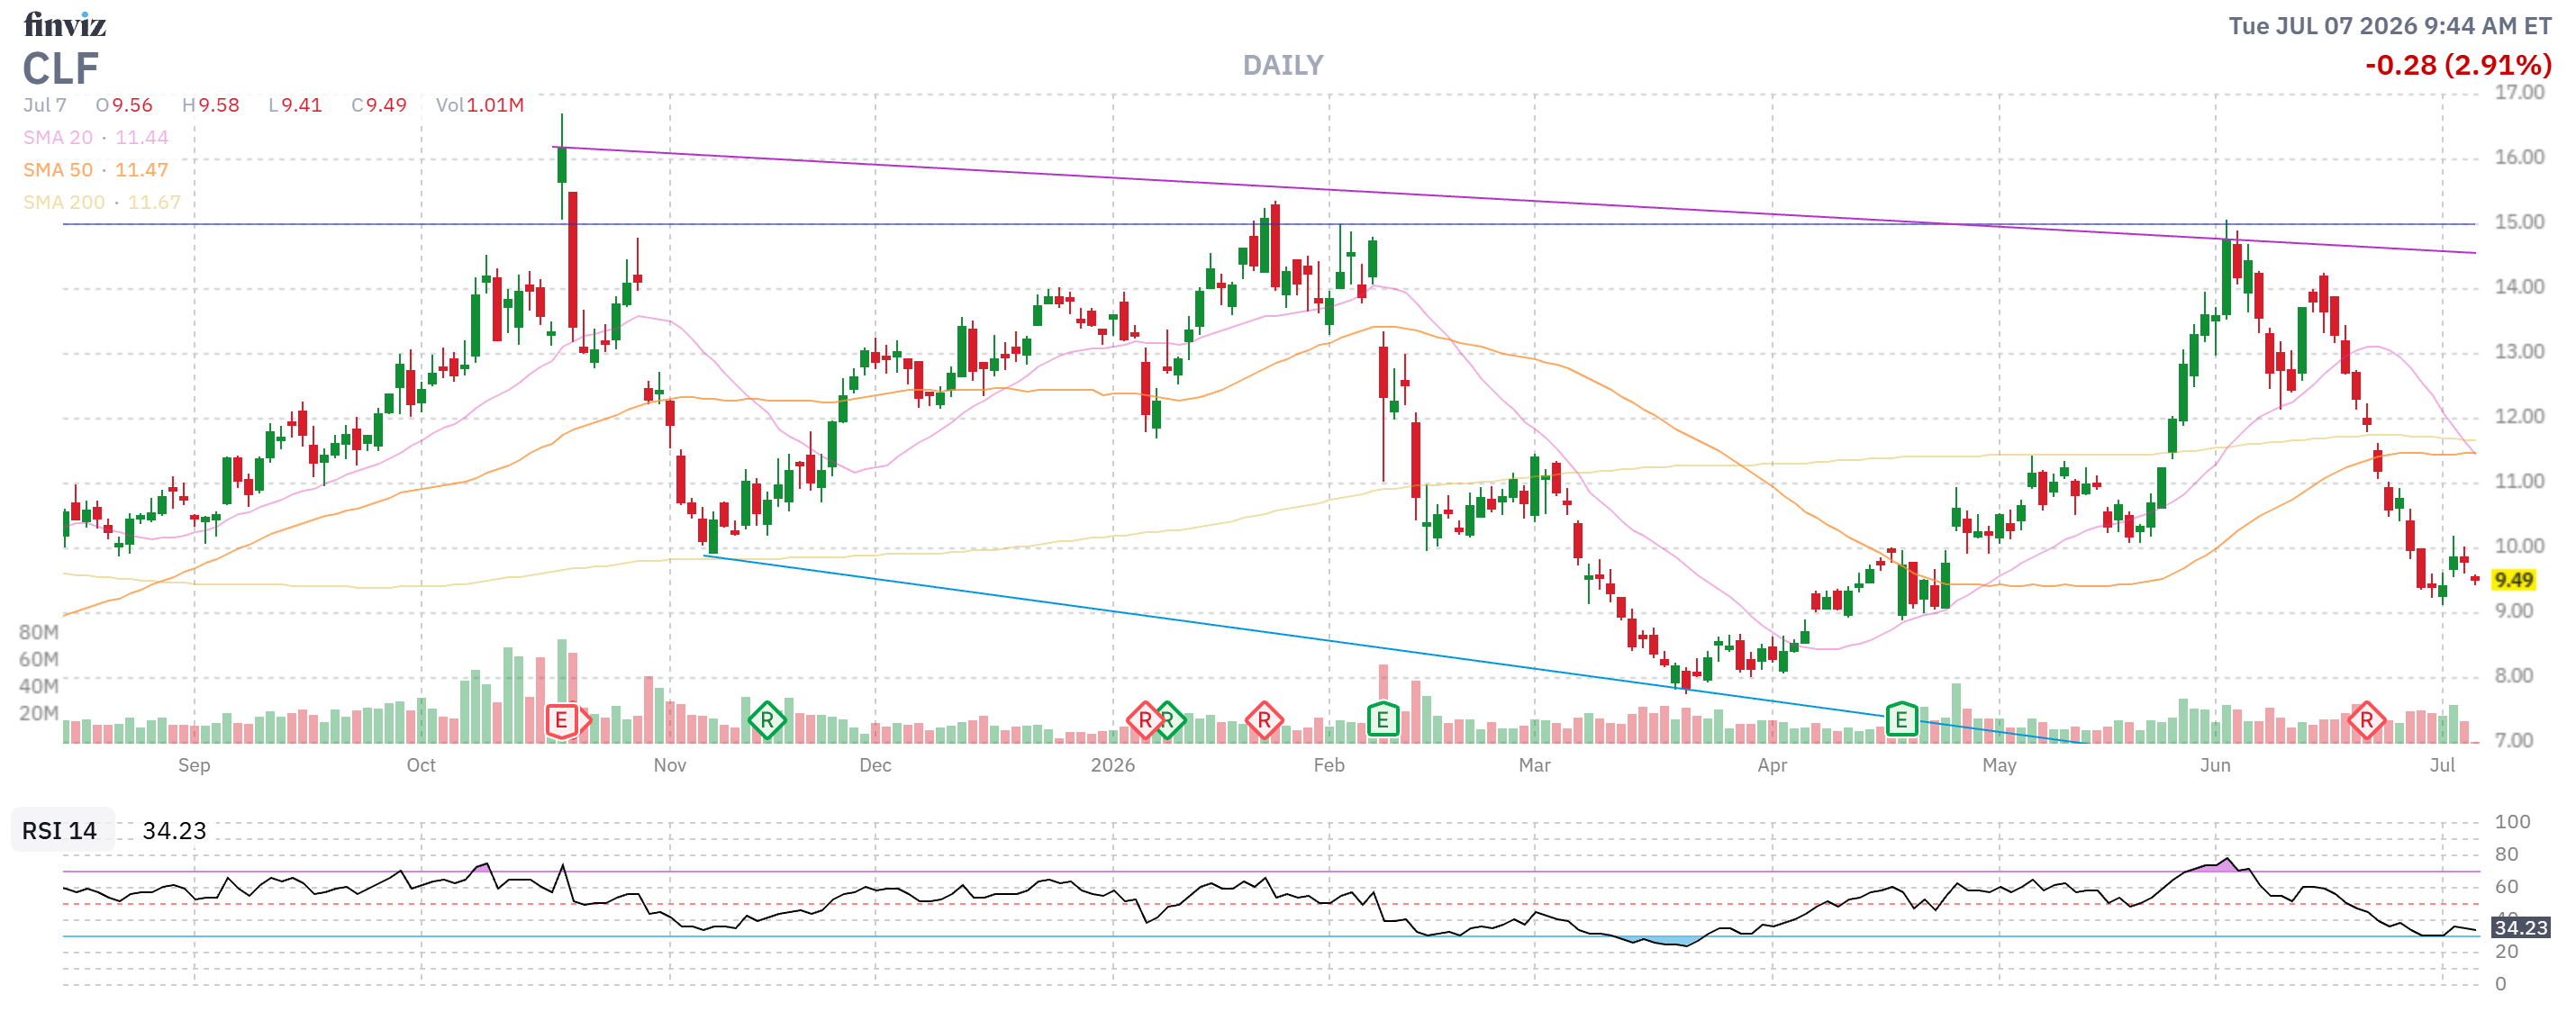
- CLF – Baffling that they should be this low given the tariff situation and the infrastructure demands. We’re off track now at net $4,405 on the let’s say $6,500 spread at $15 with $2,095 upside potential PLUS 5 more chances to sell $3,900 in premium is what crushes it with a potential $19,500 (442%) in premium sales and THAT makes it Good for a New Trade!
-
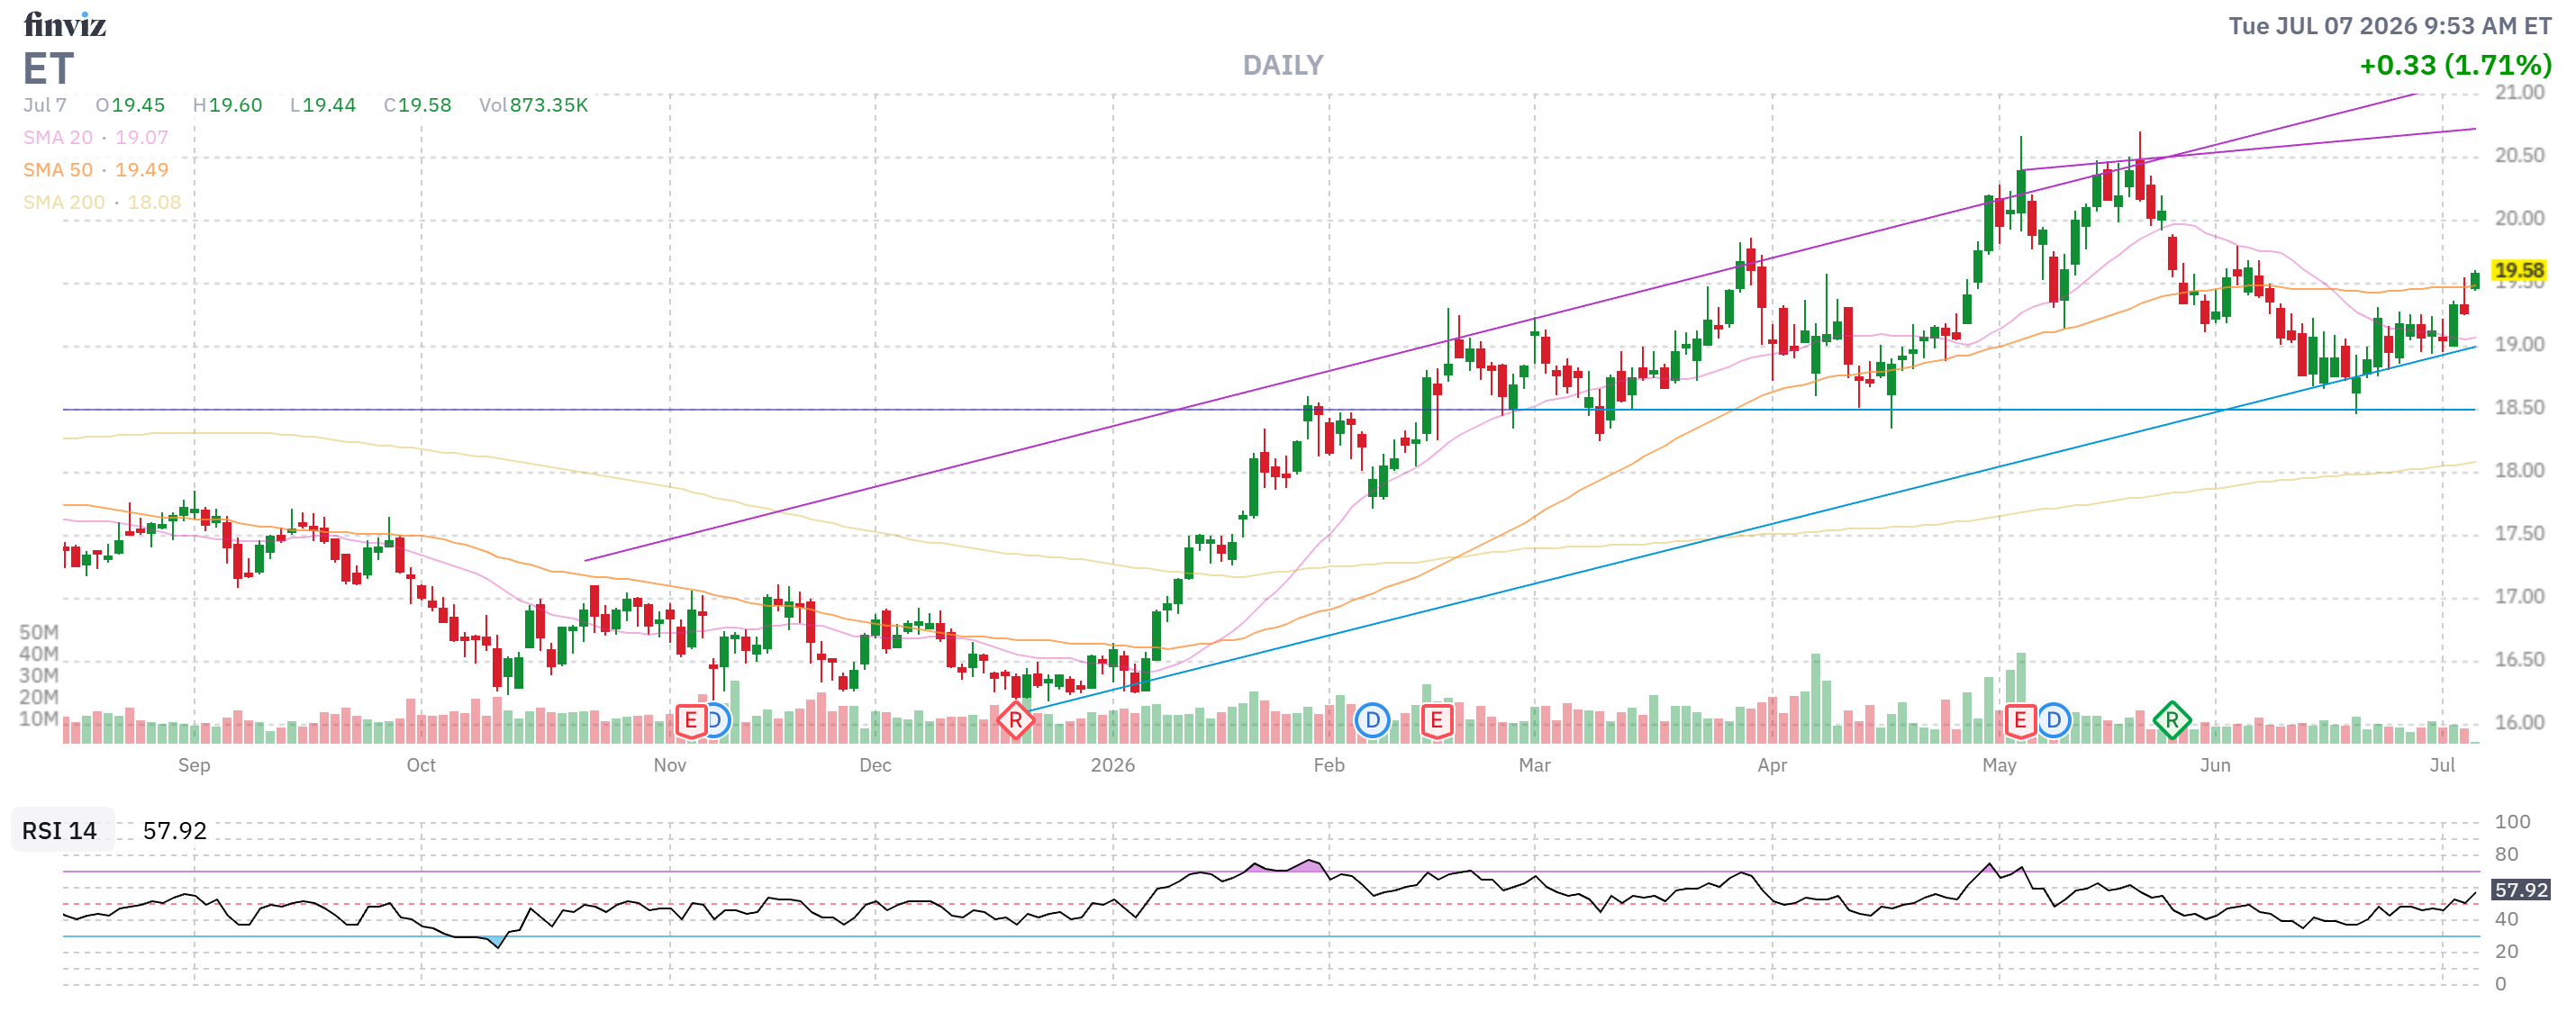
- ET – Net $1,915 on the $3,000 spread with $1,085 (56.6%) upside potential and we made just $98 (5.1%) since April on the short calls but still, we’ll say potentially another 5 x $260 = $1,300 (67.8%) and that’s our 120% goal for an 18-month position with a high degree of certainty so, UNBELIEVABLY DULL and Good for a New Trade!
So this is taking me about 3 hours this morning (I’m also checking every position’s news, macros, fundamentals, etc) but isn’t that worth your time, once a month – to KNOW how your portfolio is doing on a position by position basis? This is how we KNOW what to expect and we KNOW whether we are on or off track at any given moment.
-
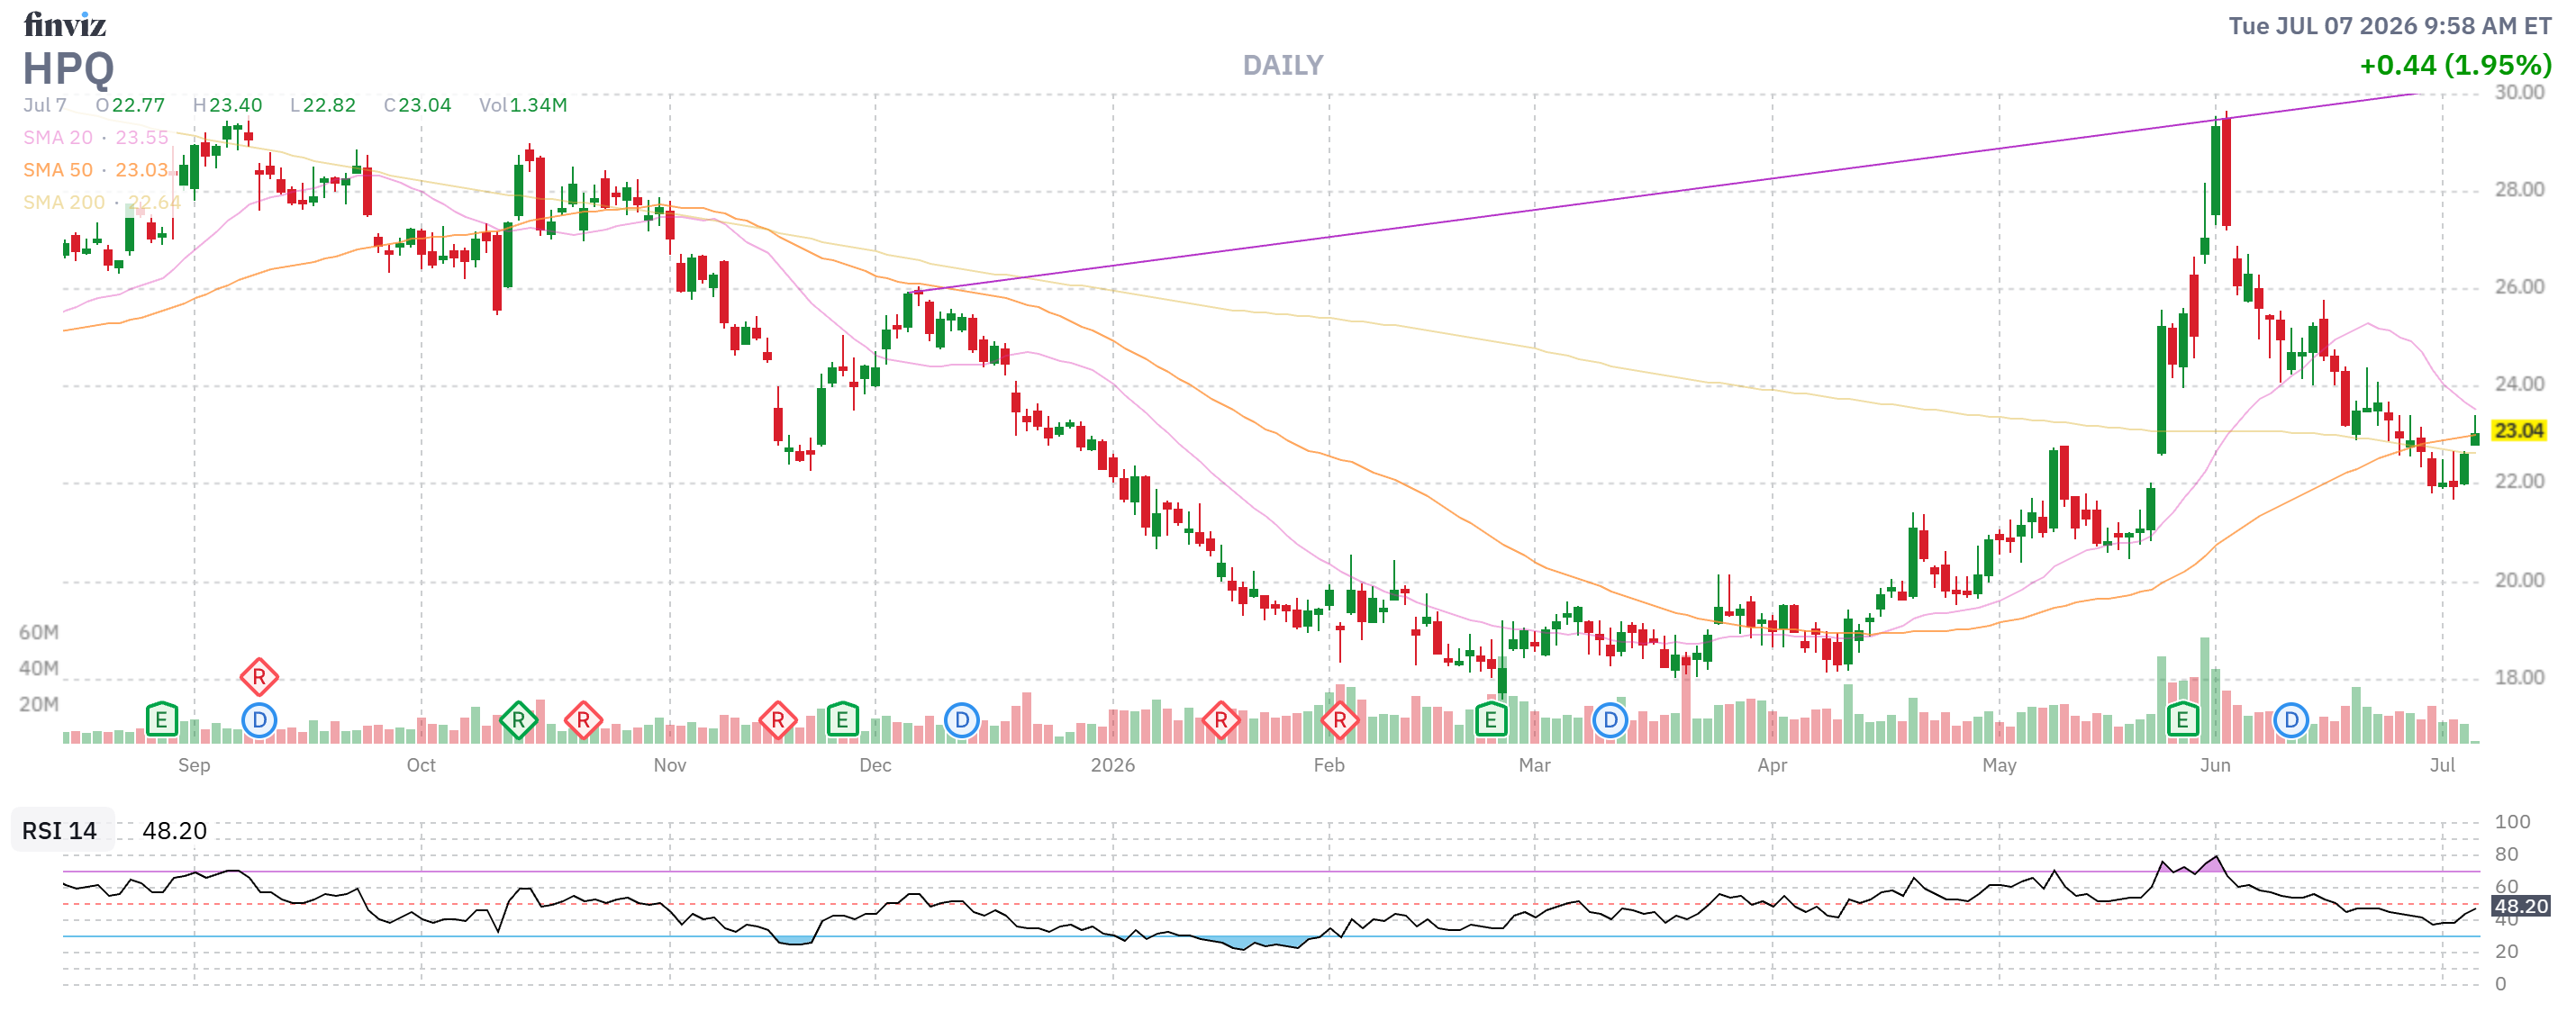
- HPQ (again) – Boy we love these guys! It’s a $10,000 spread (we’ll roll) at net $4,932 with another $2,100 worth of premium to sell so the net becomes $2,832 by Jan and the upside potential is $7,168 (252%) so huge margin of error, great stock, almost at goal so – Good for a New Trade.
-
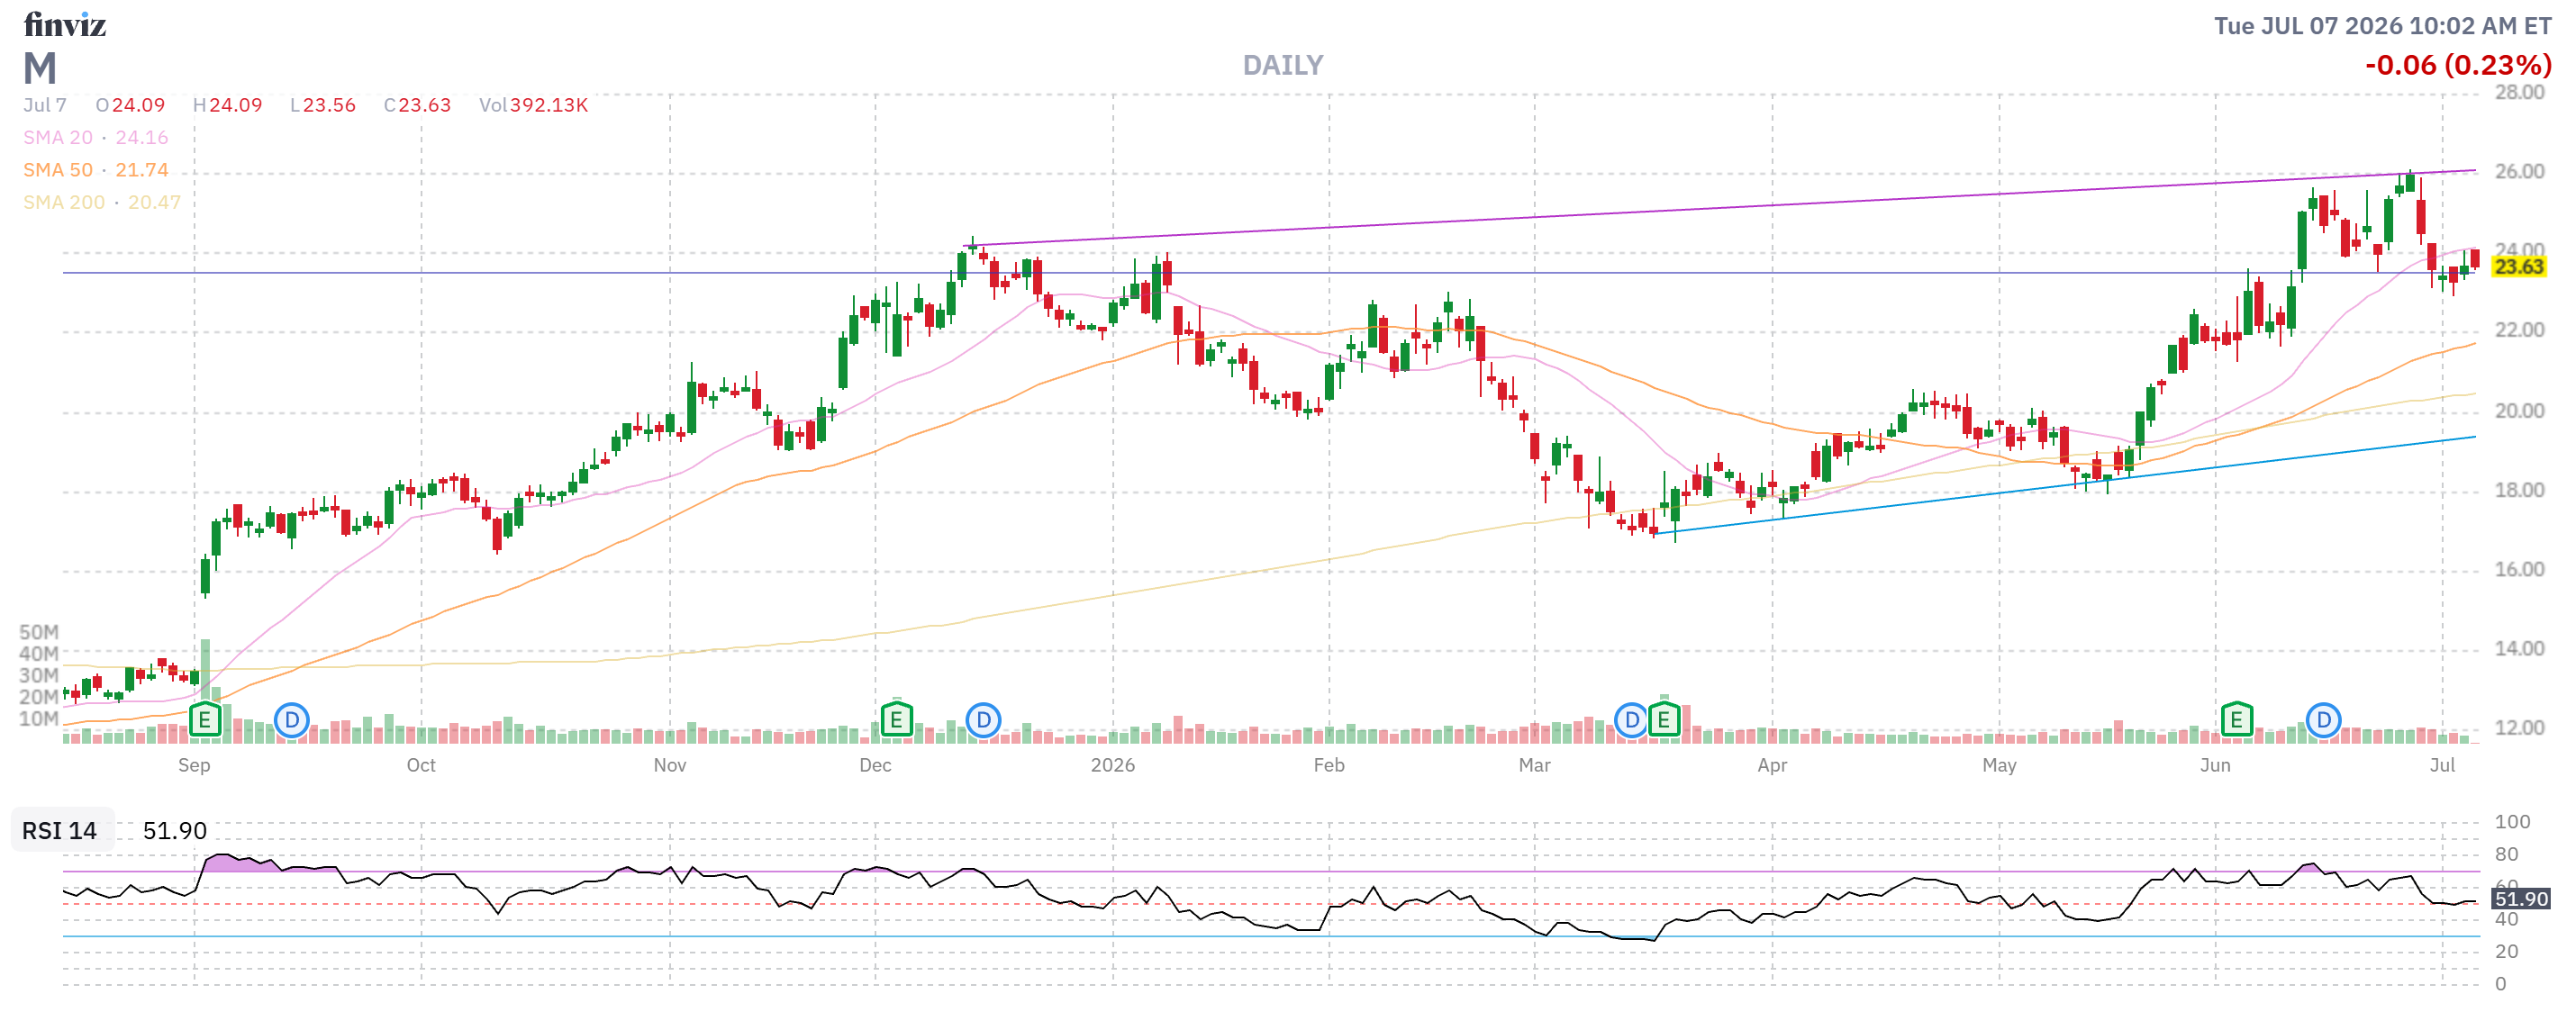
- M – Net $4,373 on the $7,500 spread with $3,127 (71.5%) upside potential on a brand new trade that’s already up $648 (14.8%) for the month. Let’s call it 5 more sales of $1,050 = $5,250 (120%) of potential premium sales – and that’s being conservative as we only sold 2 months initially so, of course, Good for a New Trade.
What was our Round Table analysis for the 2nd half of 2026? There are 50 stocks with 30+x p/es earning 2/3 of the income in the S&P 500 but there are 450 stocks with p/es that are averaging LOW enough to drag the overall index back to 20x. So our VERY SIMPLE PLAN is to own THOSE stocks (these stocks!) – NOT the overbought high-flyers.
By using our Be the House – NOT the Gambler options strategies – we don’t need our “boring” stocks to make huge gains – we just need them NOT to be much lower – and we’ll make our 120% goals for the next 18 months. How simple is that? I could not write a book that lays it out better than this ACTUAL portfolio!
-
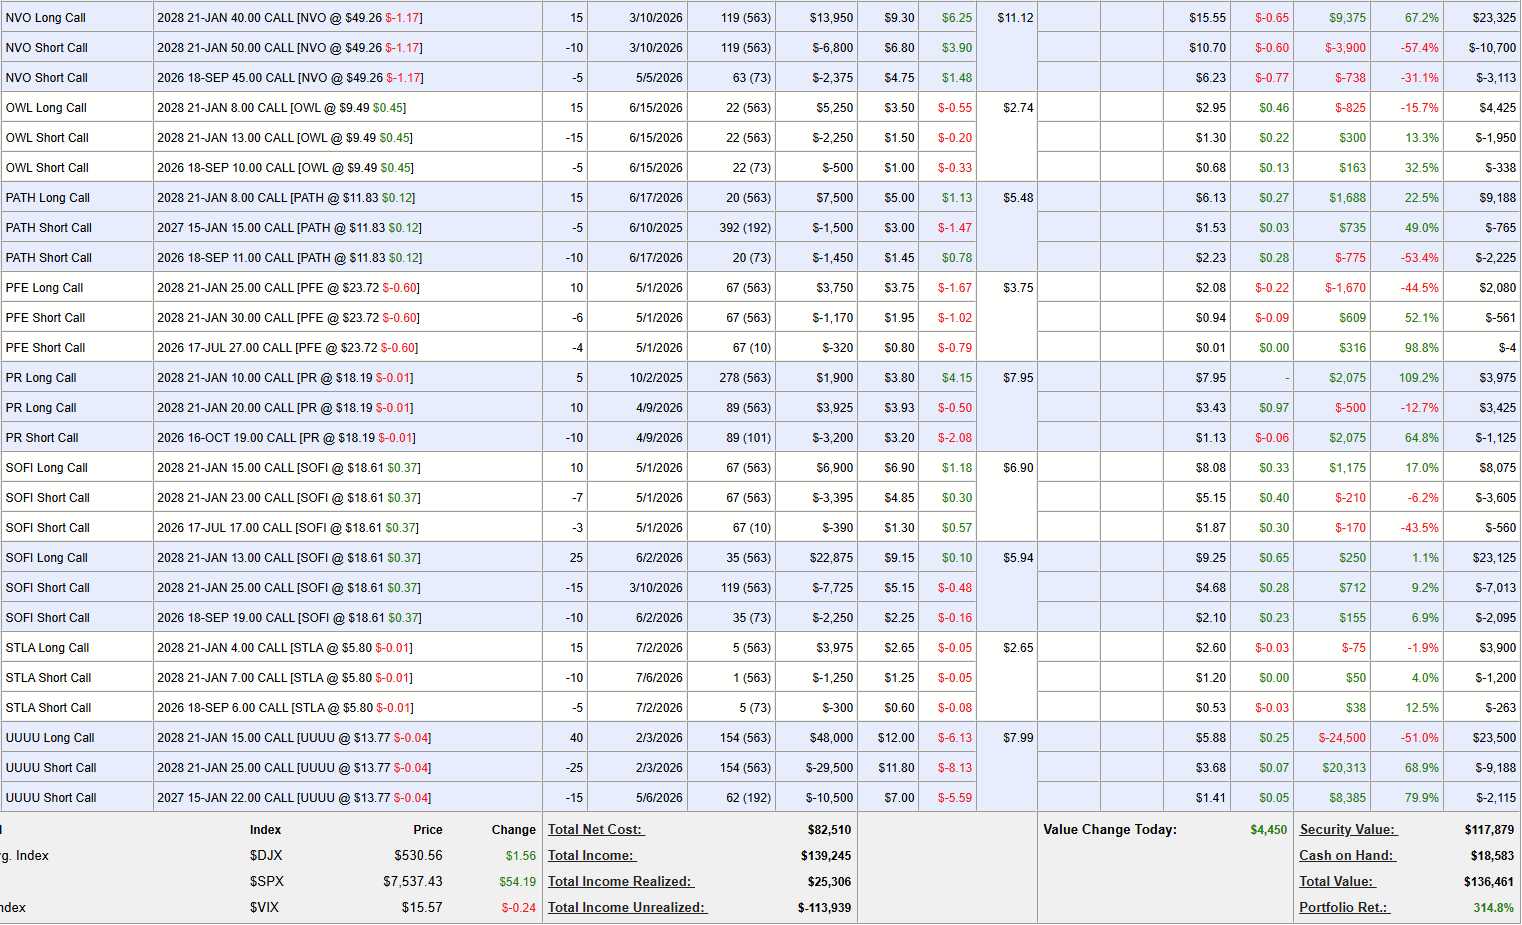
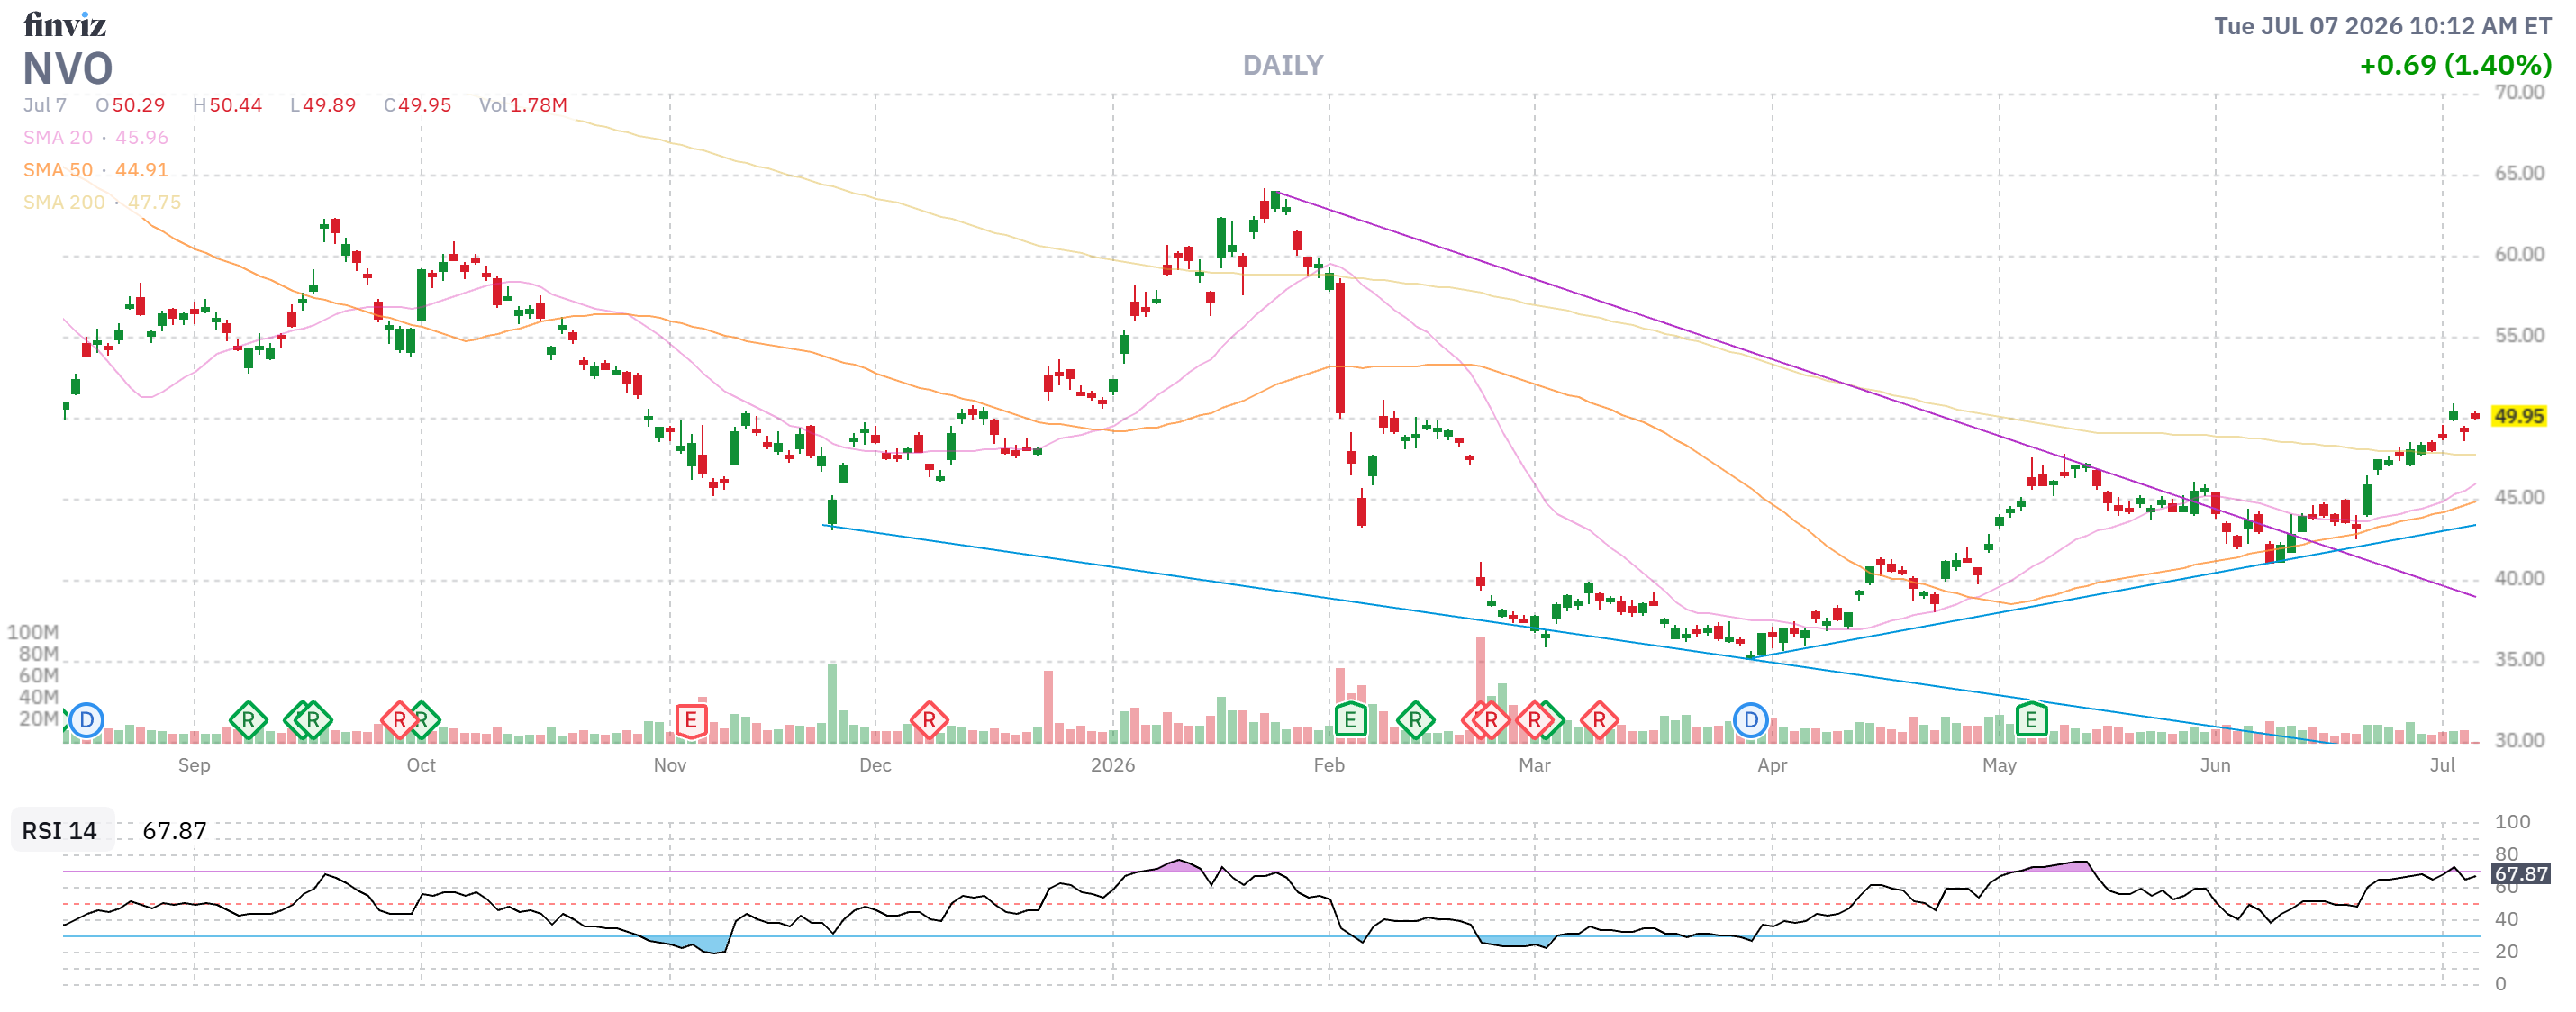
- NVO – I kept being surprised that we still had them but that was because, every time I ran the numbers and checked the Fundamentals – I could never find a reason to sell them. Now they have finally taken off so no need to check and our trade is at the money at net $9,512 on the $15,000 spread with $5,488 (57.6%) upside potential PLUS 4 more sales of $2,375 (because this one is blown) is another potential $9,500 (99.8%) and we may as well roll the 5 short Sept $45s ($3,113) to 5 short Jan $50s at $6.25 ($3,125) even.
-
- OWL – “We’re on the road to nowhere…” Net $2,137 on the $7,500 spread but hitting $13 is a bit iffy at the moment but $12 would be net $6,000 with $3,863 (180%) upside potential PLUS the tie-breaker is 5 more chances to sell $500 is another potential $2,500 (116%) in premium sales. NOT good for a new trade as it’s riskier than we thought but worth the risk in context.
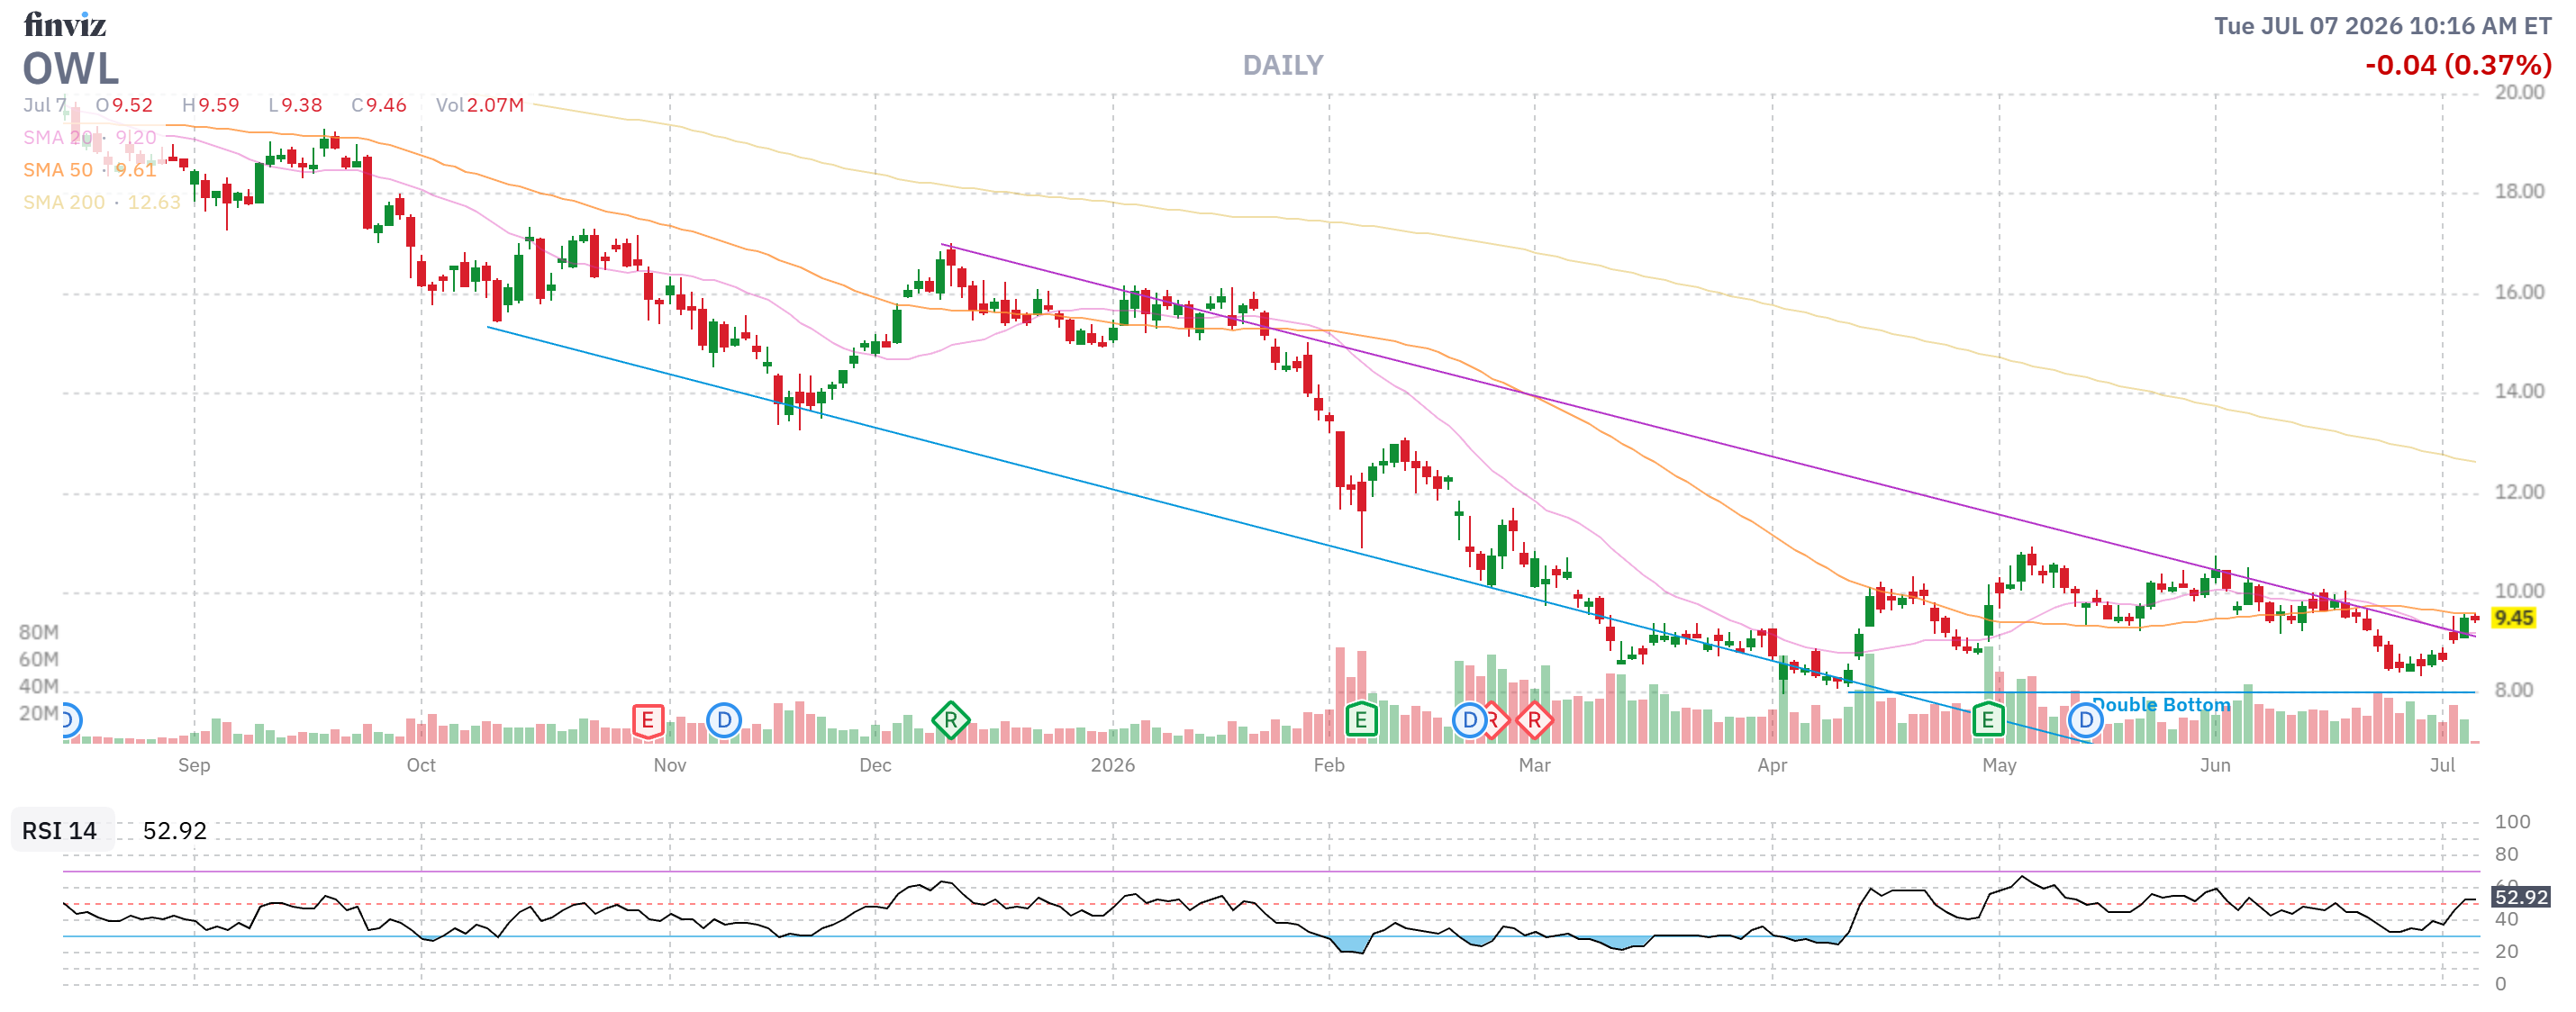
Good note on this one. We are $1.50 ($2,250) in the money and showing a loss at net $2,137 and our $2,500 worth of premium sales are on track. NEVER let a broker’s shitty presentation of your balances chase you out of a position – DO THE MATH YOURSELF!!!
-
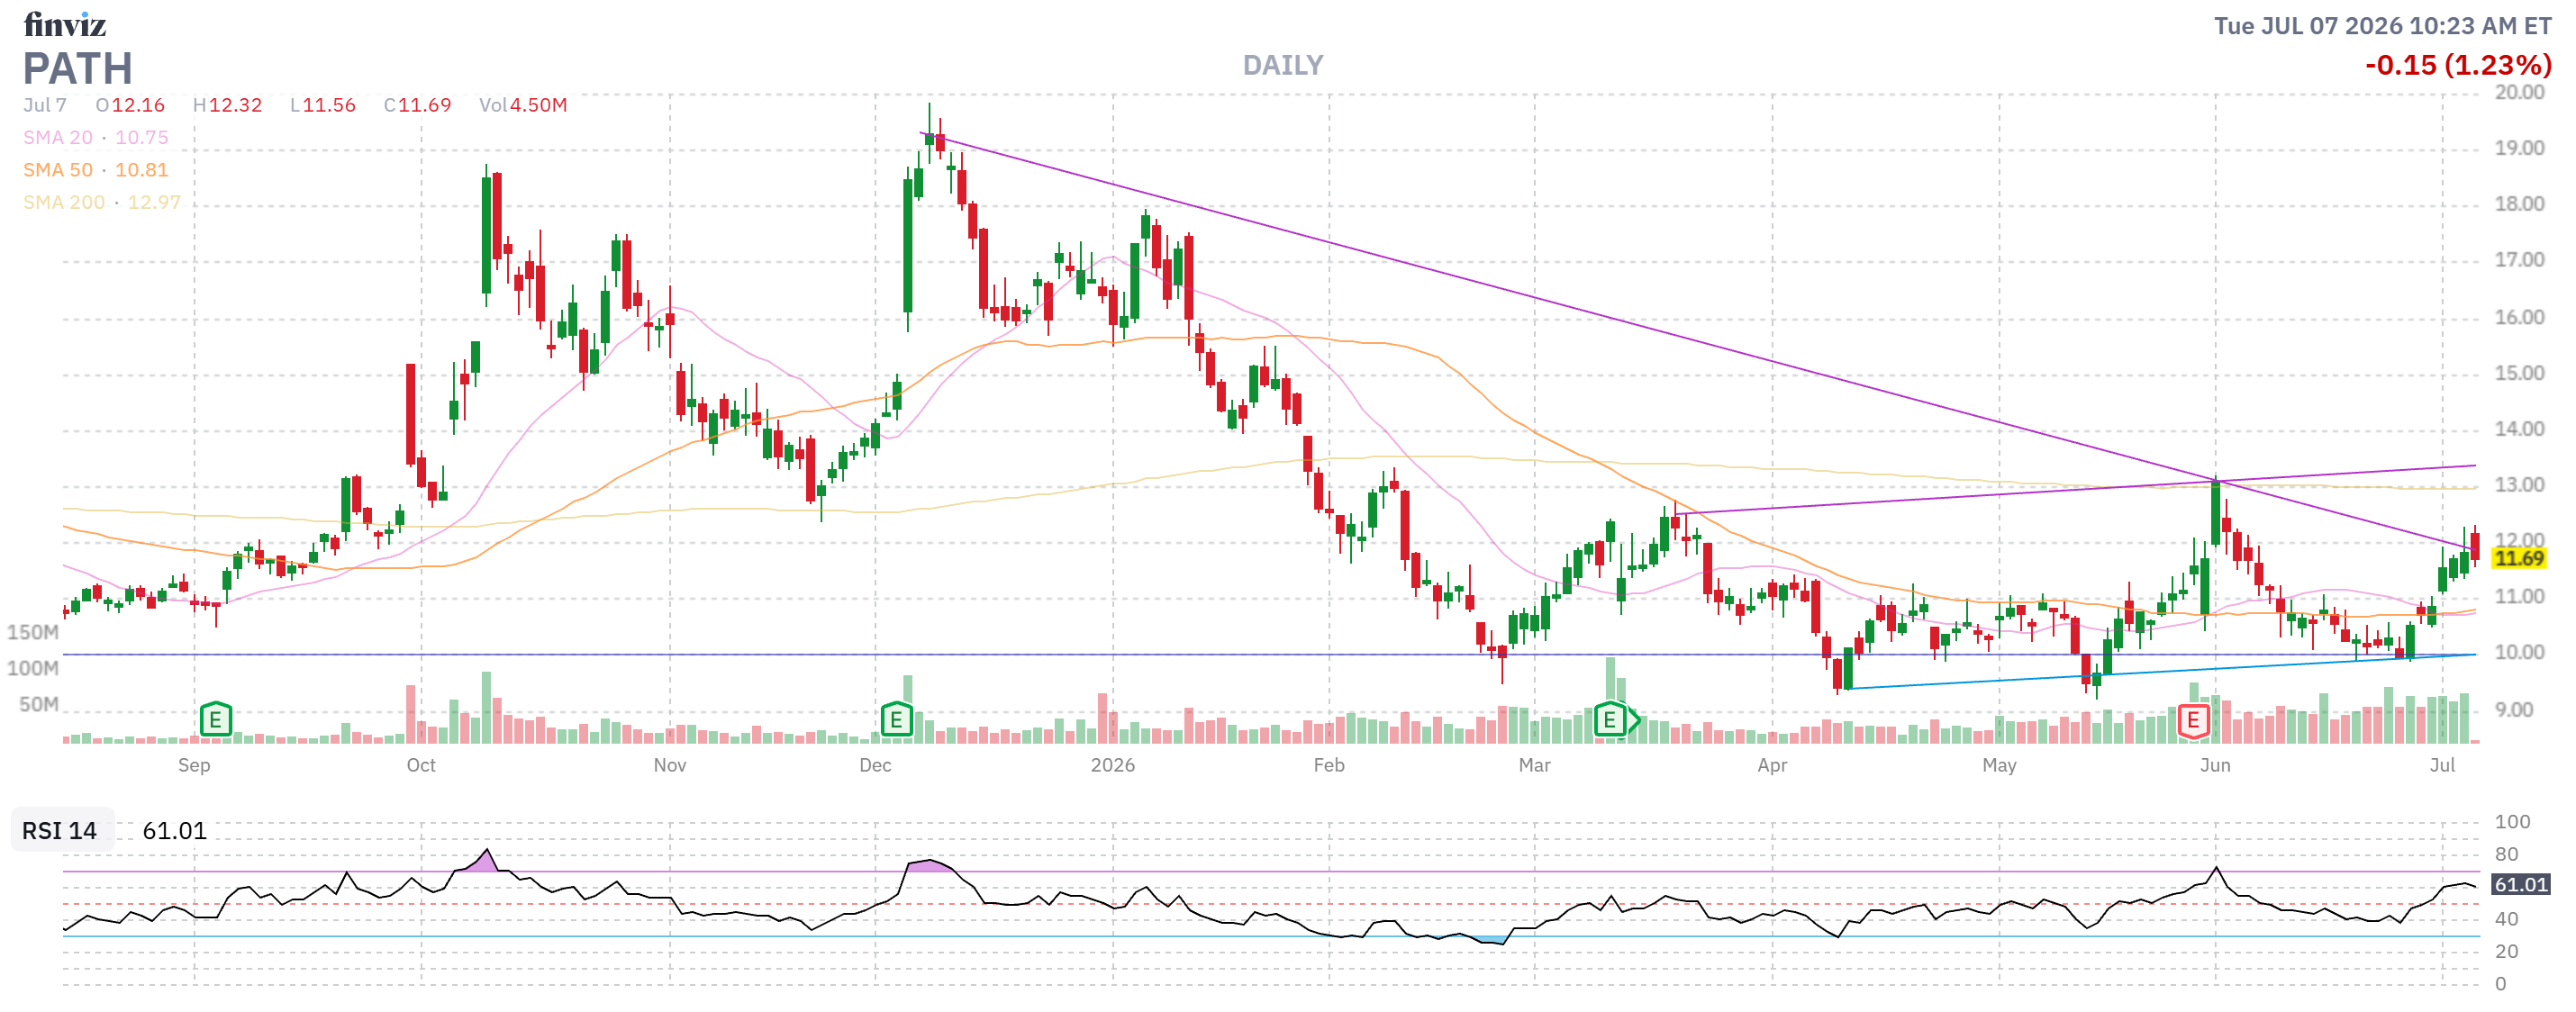
- PATH – Net $6,198 on the $10,500 spread with $4,302 (69.4%) upside potential PLUS 5 more sales of $1,450 is another potential $7,250 (116%) and I’m very confident in $15 so – Good for a New Trade (which it is).
-
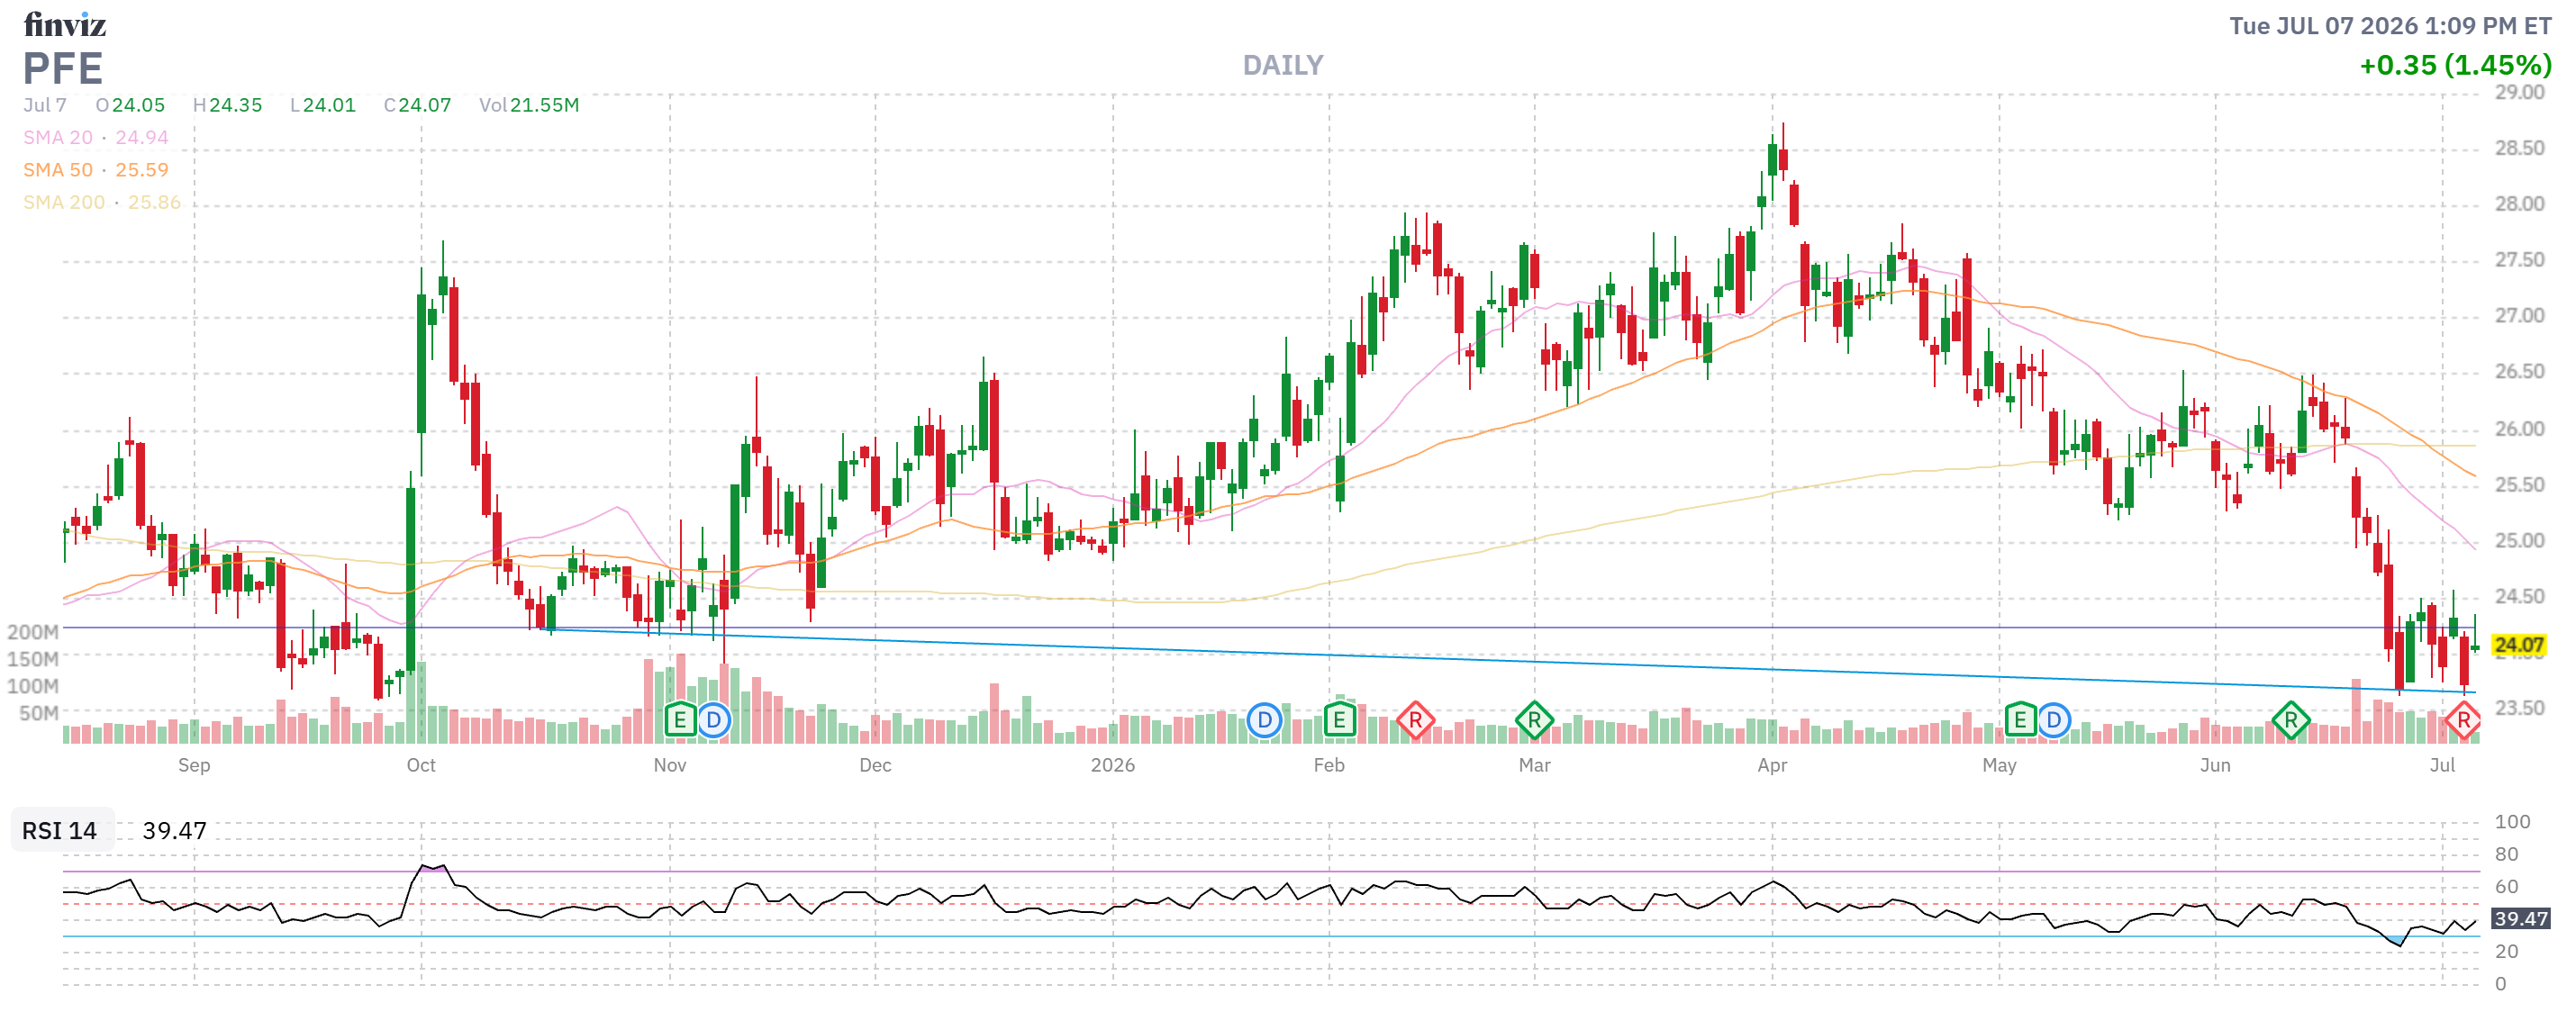
- PFE – Net $1,515 on the 5,000 spread and I still think $30 is realistic – so let’s call it $3,485 (230%) upside potential and we’ll buy back the short $27 calls ($4) and sell 4 Jan $25 calls for $1.15 ($460), which drops our net 30% to $1,055 and we have another (5 x $460 =) $2,300 (218%) of potential premium sales. Since we don’t need the bull call spread to work to make 218% – it’s Good for a New trade!
-
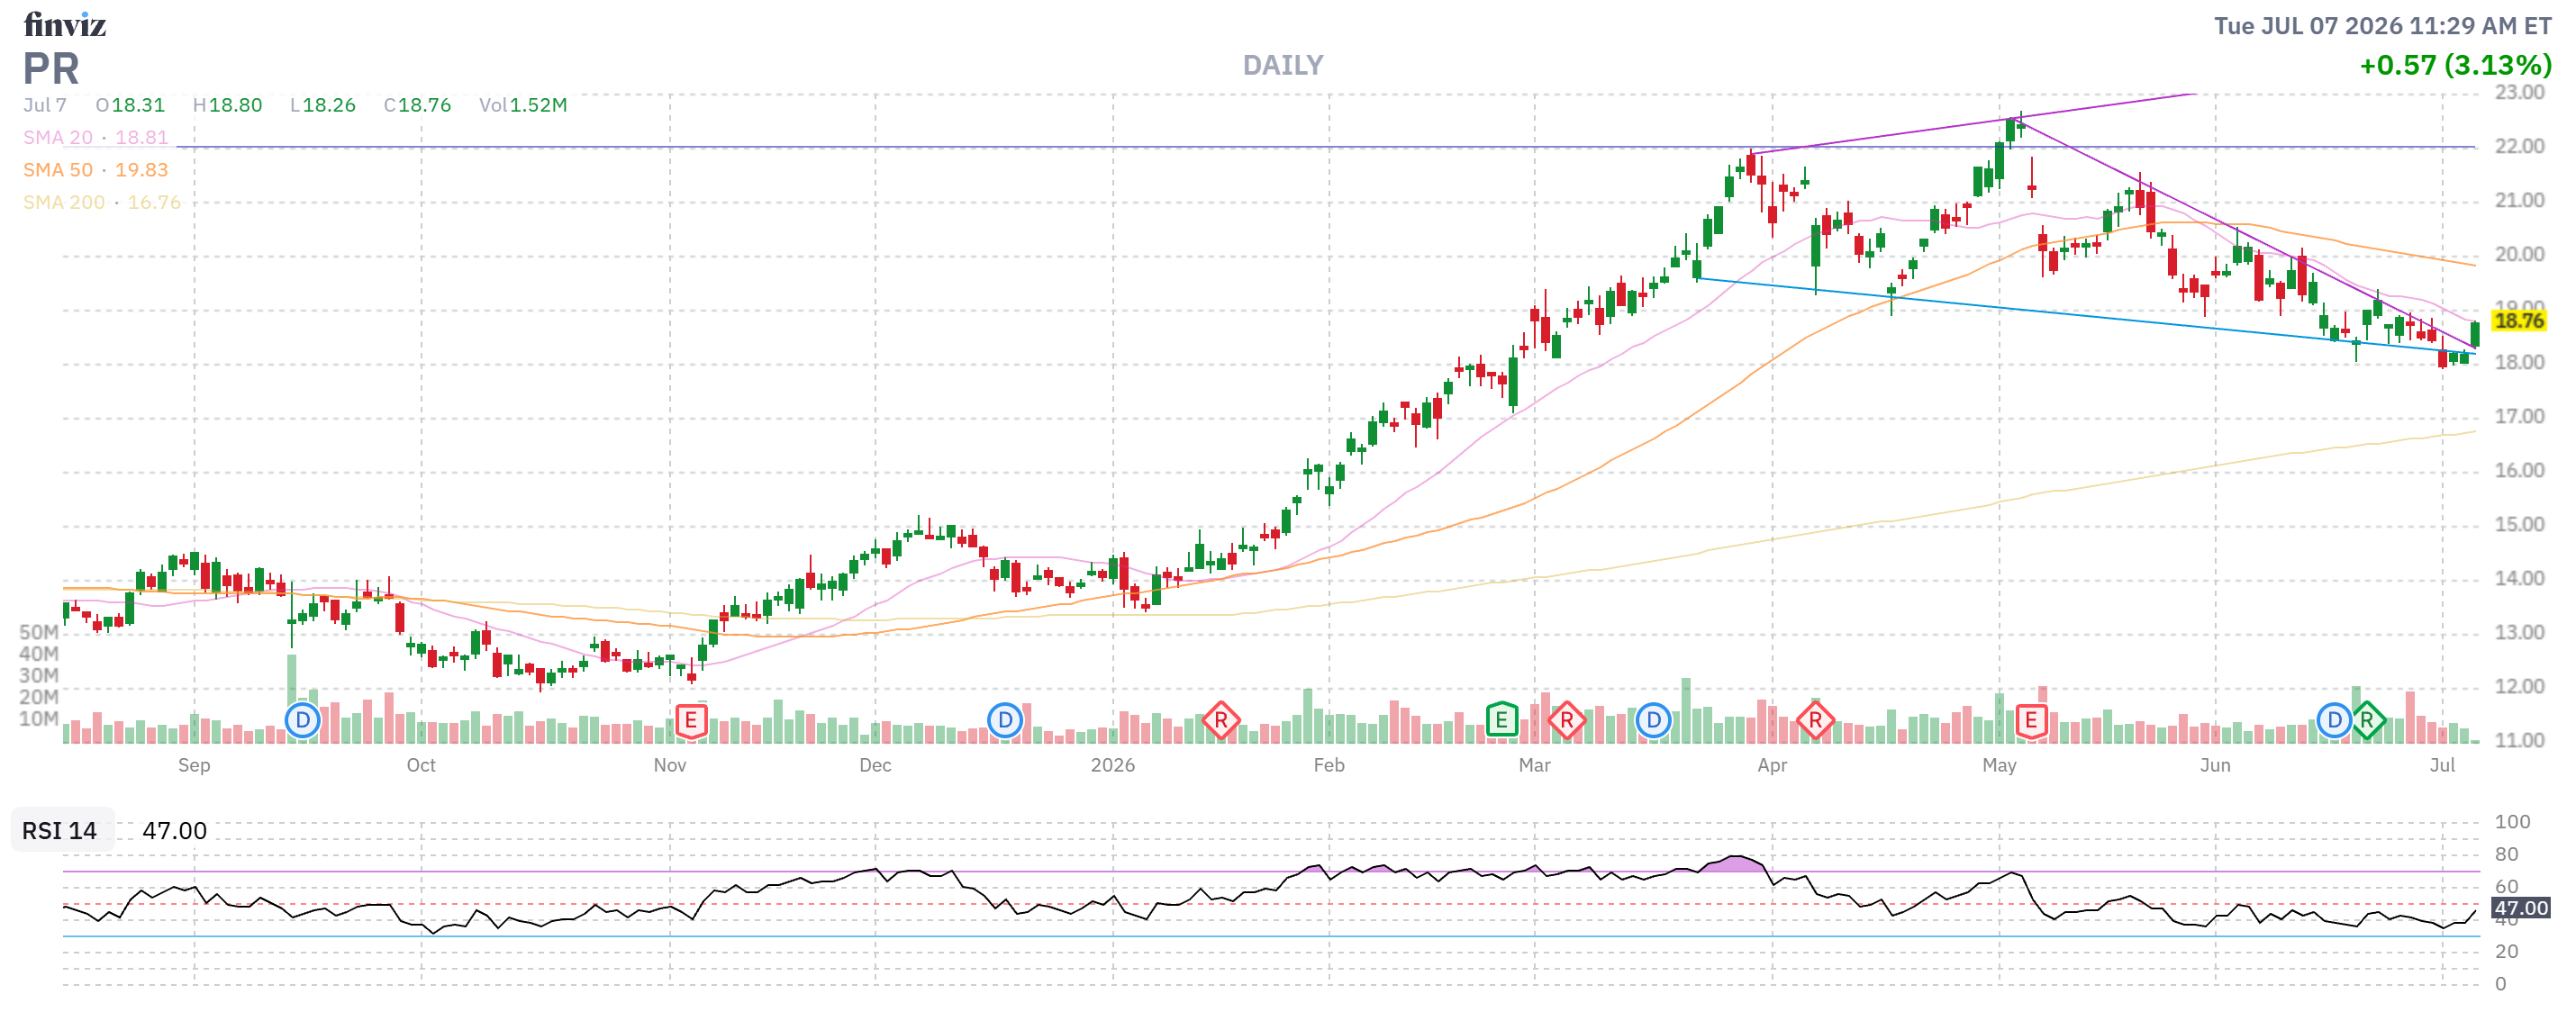
- PR – Well on track at net $6,275 on a (at $25) $12,500 spread so there’s $6,225 (99.2%) upside potential PLUS (4 x $3,200) = $12,800 (203%) of potential premium sales so Good for a New Trade.
-
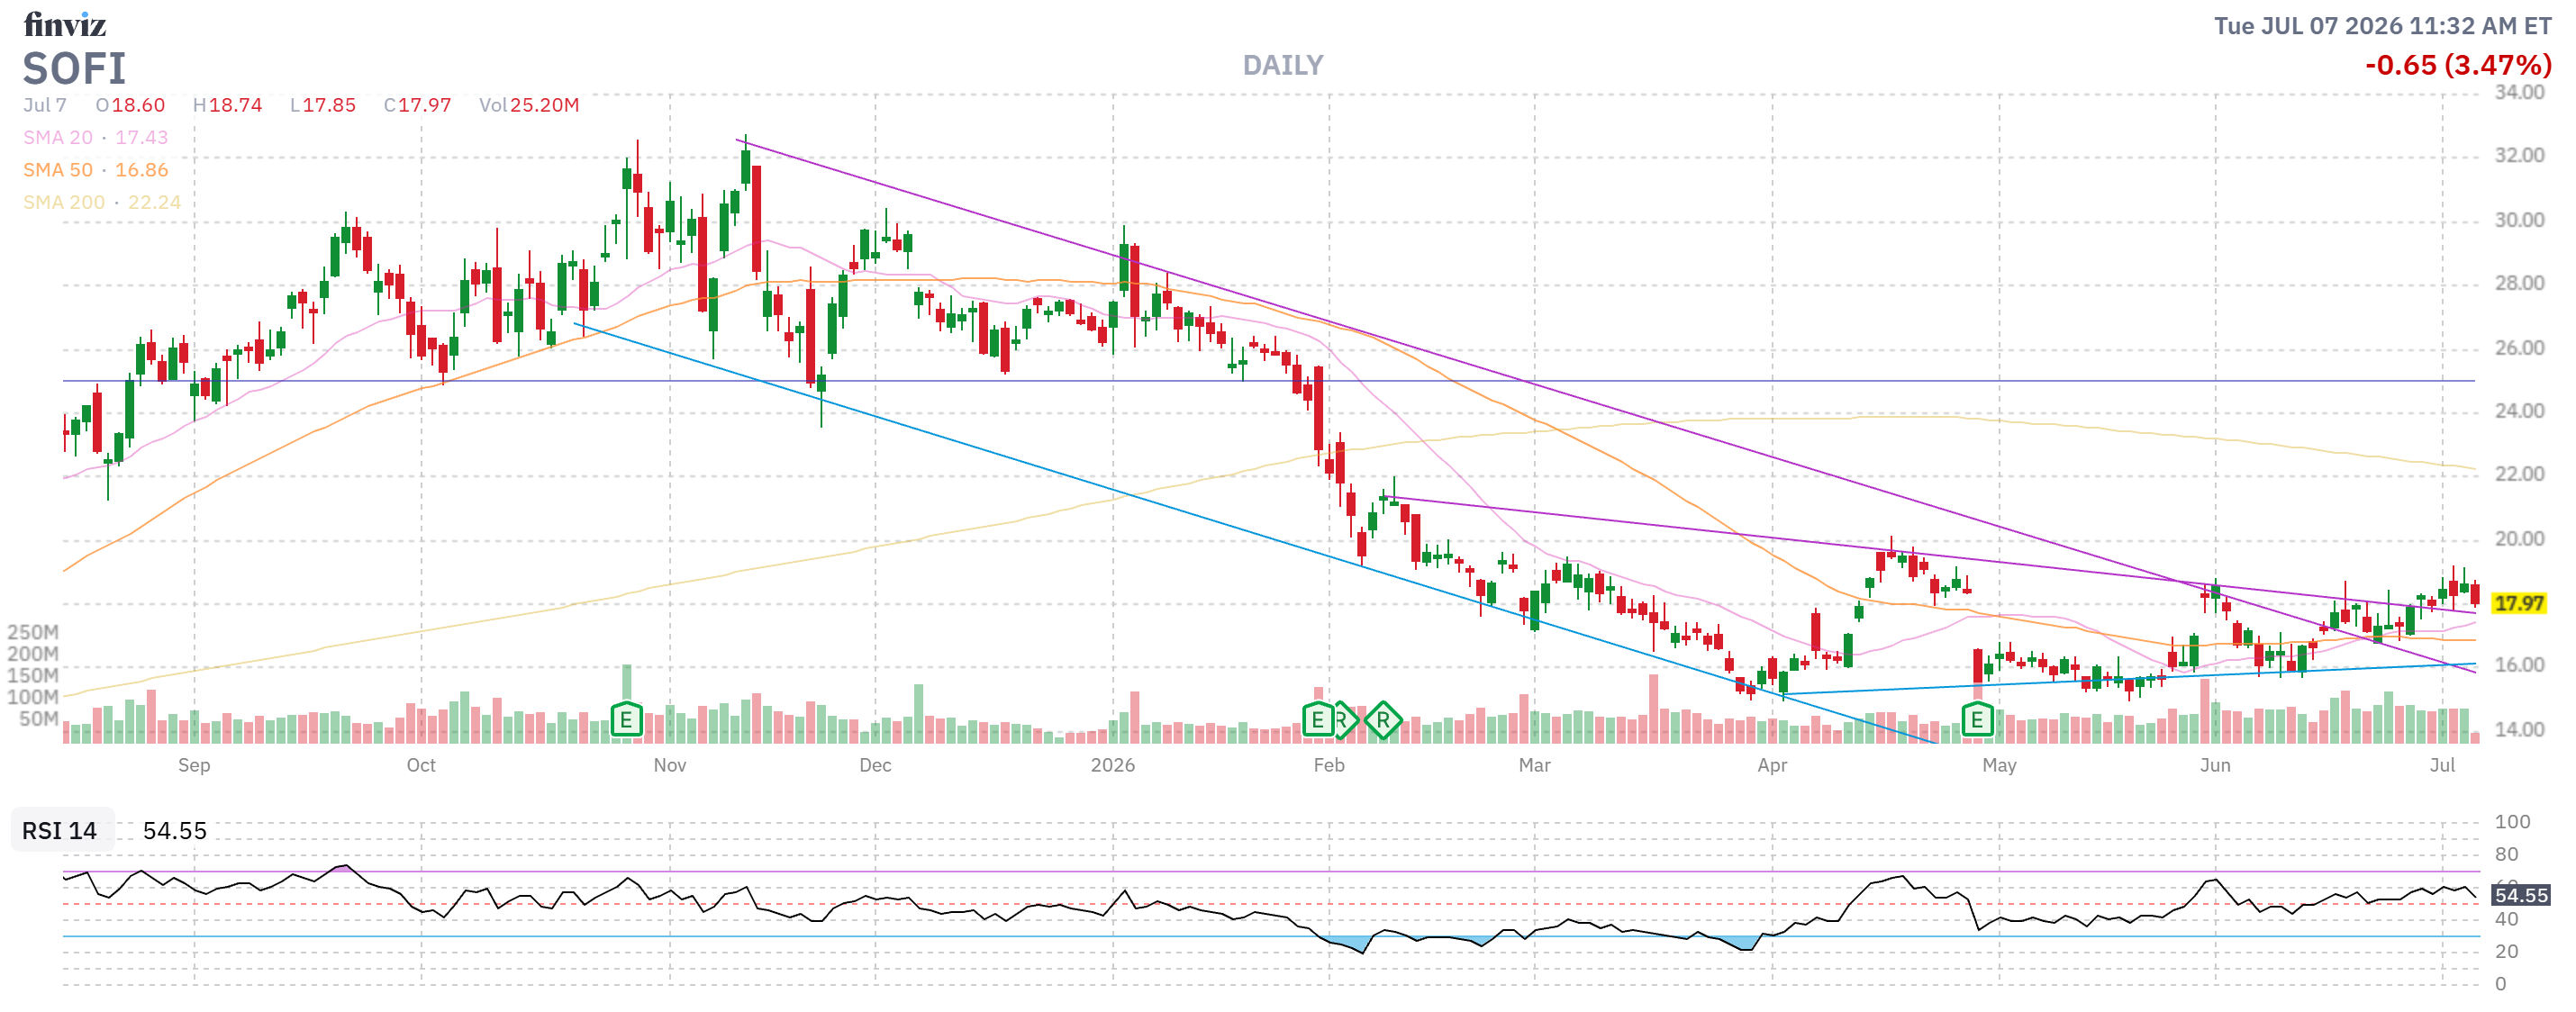
- SOFI I – $3,910 on the $8,000 spread has $4,090 (104%) upside potential PLUS, even though this one didn’t work, (5 x $390 =) $1,950 (49.8%) in potential premium sales makes this one Good for a New Trade too!
- SOFI II – $14,017 on the $30,000 spread has net $15,983 (114%) upside potential and we also have 5 more chances to sell $2,250 for another $11,250 (80.2%) potential premium sales.
-
- STLA – Brand new at $2,437 on the $4,500 spread with $2,063 (84.6%) upside potential PLUS (5 x $300 =) $1,500 (61.5%) potential premium sales. Good for a New Trade!
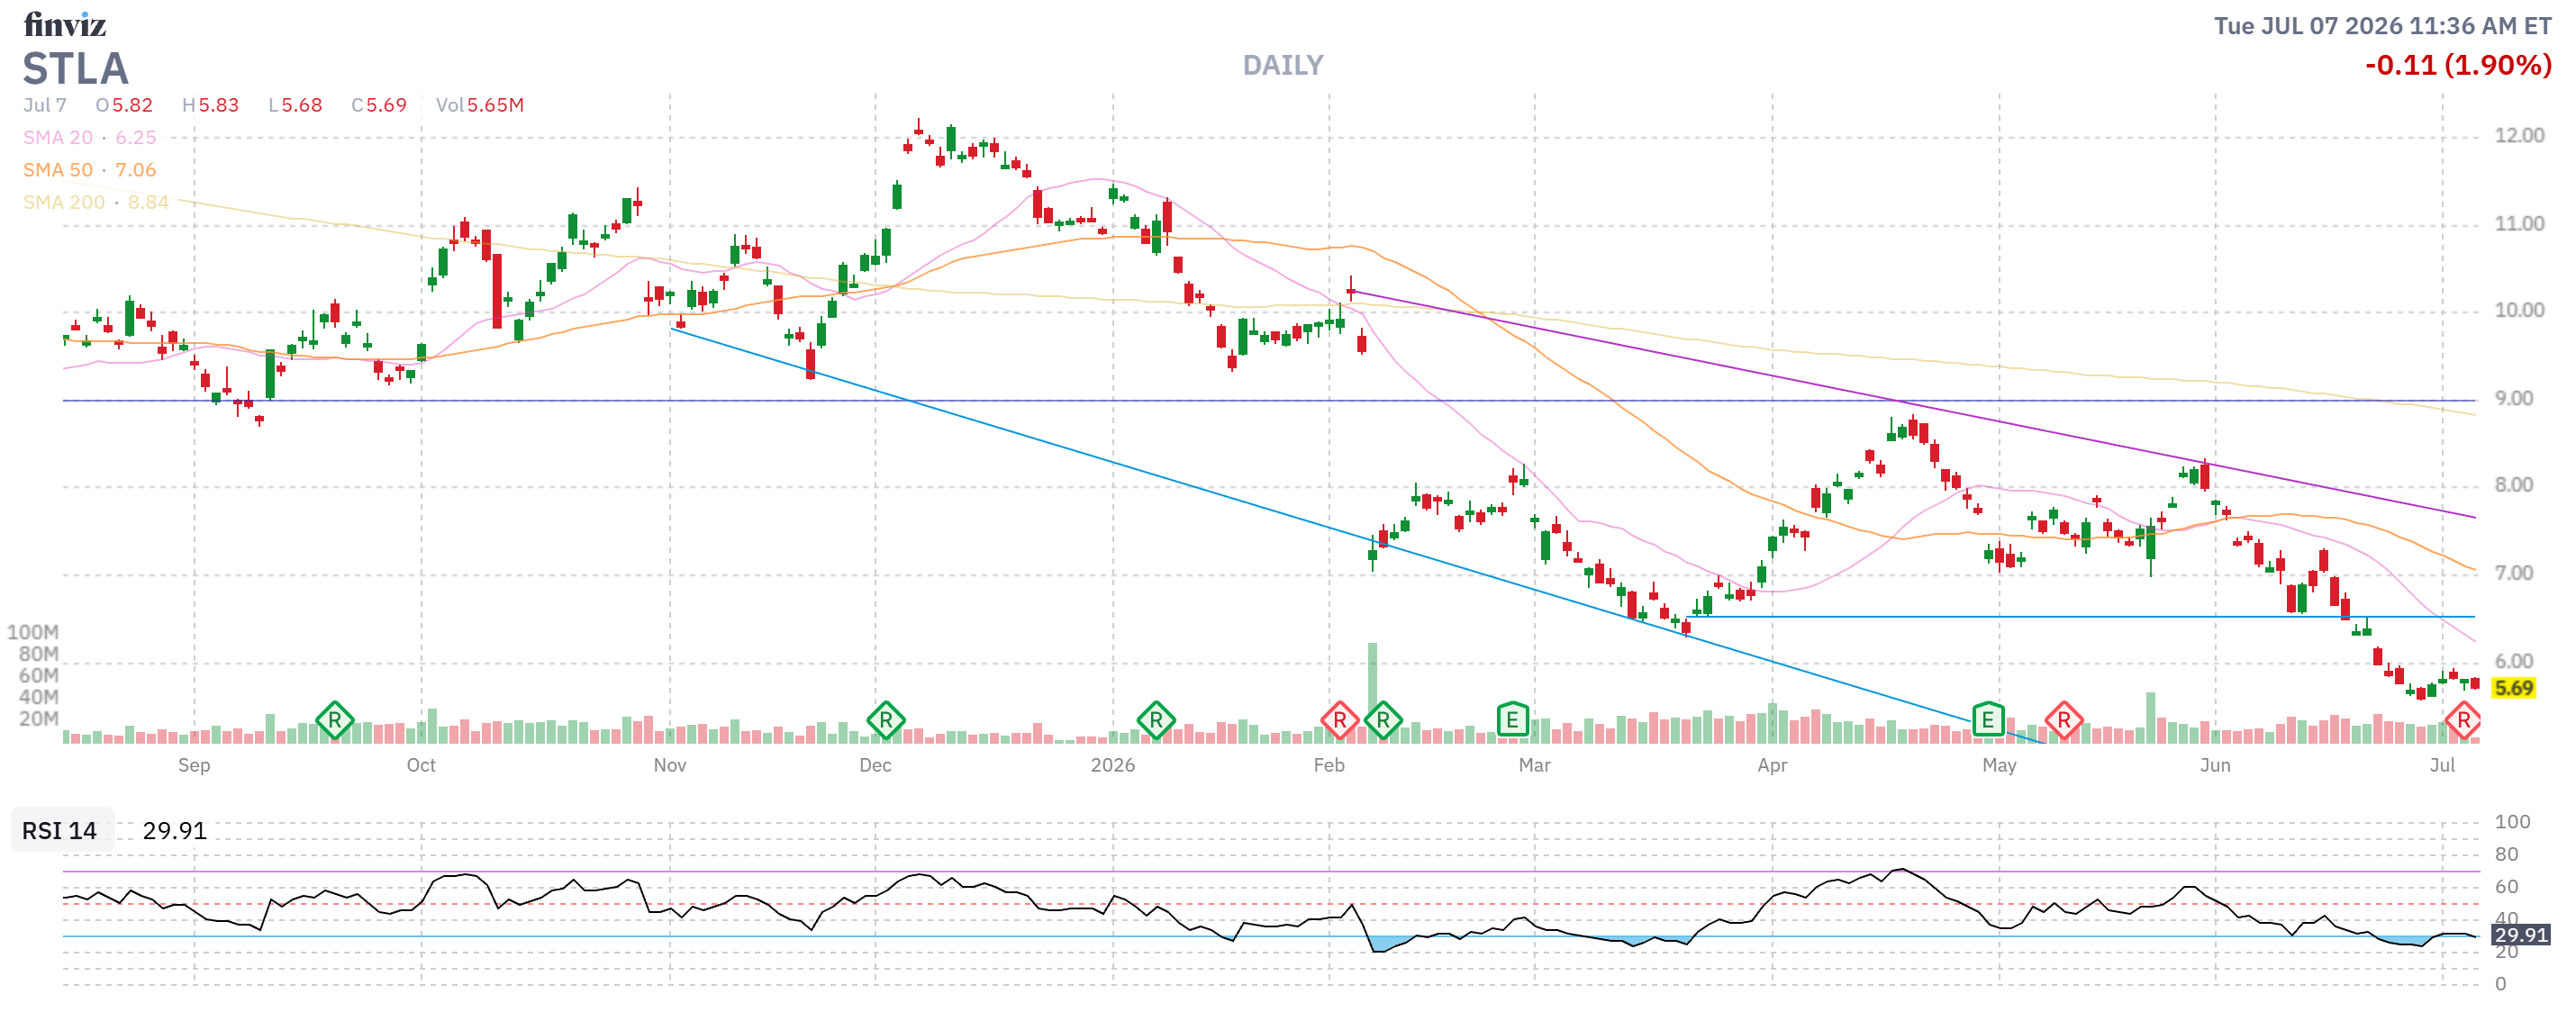
As a rule of thumb, if we can produce 80% + annual gains from a very conservative target like $7 in 18 months – WHY WOULD WE RISK TRYING TO MAKE MORE??? It’s not just how much you CAN make on a trade but how LIKELY you are to make it…
-
- UUUU – The excitement faded and FORTUNATELY we sold $10,500 worth of short calls to lock in our gains but it BARELY worked. Now the net is $12,197 and we’re up $4,000 in 4 months – let’s be happy and CASH OUT!
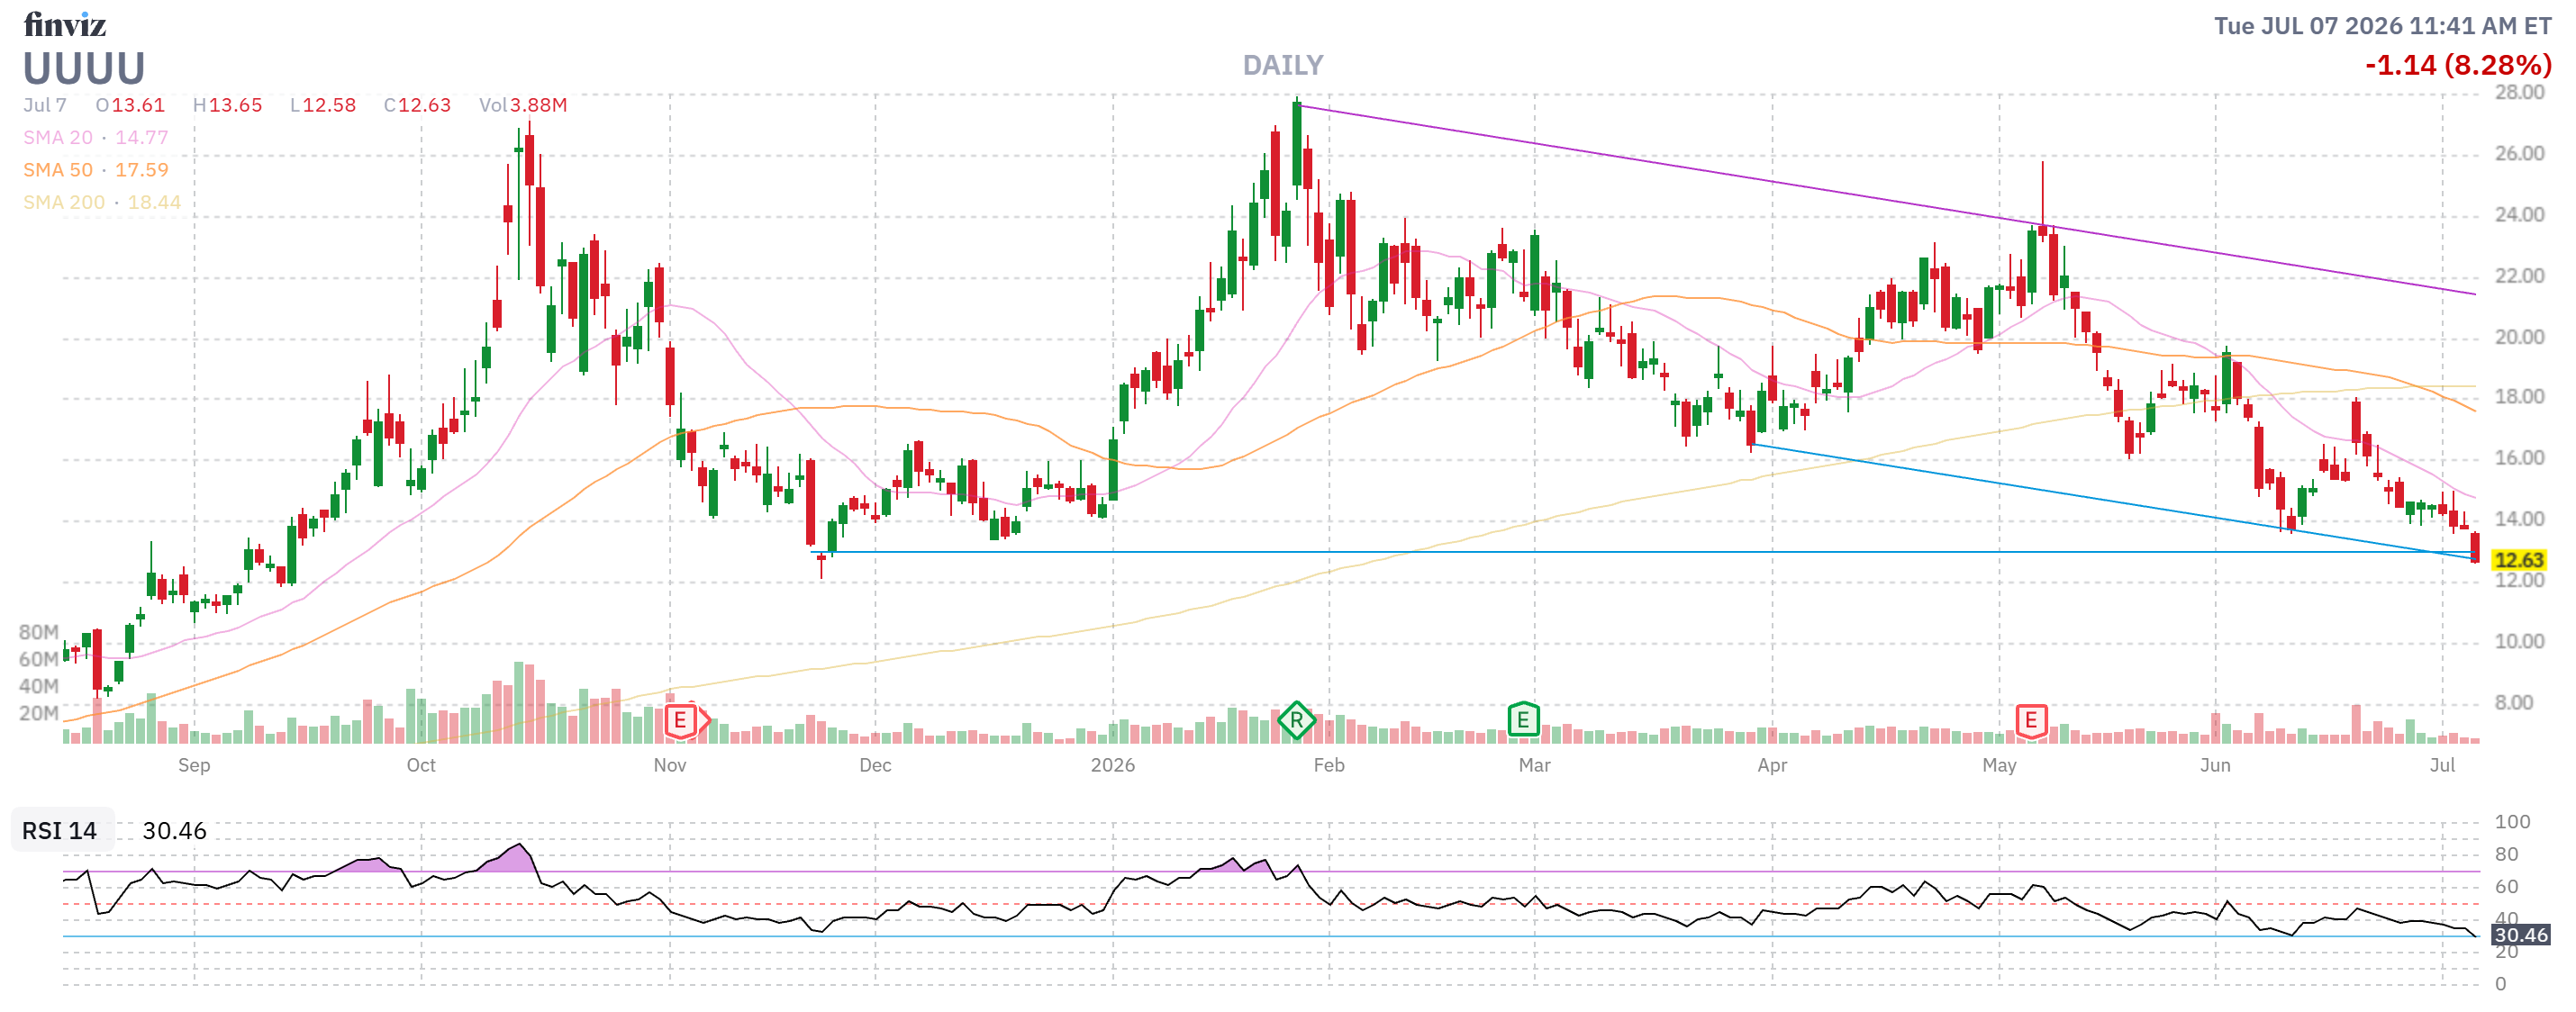
So we raised net $25,637 in CASH!!! and that can be our hedge for the moment. These are the kinds of stocks people will rotate INTO – the SQQQ hedge would only be bonus money at the moment as we have no QQQQ plays (not many) to protect.
Our remaining positions are good for $185,000 worth of gains over 16 months so we want to see roughly $2,500 worth of gains each week to stay “on track” and even that is “only” 136% (and that’s if all goes perfectly).
Of course TRYING to make 80% per year is silly (as we end up taking too many risks) – we need to accept the fact that we will normalize around 40% (still great) at some point but we’ll also find ways to deploy our now $43,000 (32%) CASH!!! pile.
I’d say, on the whole, things are looking good!
| Symbol | Current Status / Action | Upside Potential | Premium Selling Potential | Cash Inflow / Outflow |
| CAG | Kept; Earnings July 15th. Plans to sell Jan $14 calls. | $3,875 (182%) | $1,400 (65.8%) | — |
| HELE | Kept; Miles over goal. | $3,000 (66.6%) | — | — |
| SQQQ | CASHED OUT | — | — | +$11,925 (Inflow) |
| UNG | Kept; Selling 5 Sept $12 calls for $0.75. | $3,125 (108%) | $1,875 (65.2%) | +$375 (Inflow) |
| GEO | Kept; Heavy political catalyst intact. | $13,425 (111%) | — | — |
| HPQ (1) | Kept; Rolled out of trouble, set up income train. | $12,382 (220%) | $6,000 (106%) | +$1,140 (Net Inflow)* |
| B | Kept; Stable near target. | $3,681 (135%) | — | — |
| CLF | Kept; Huge premium engine despite being off track. | $2,095 | $19,500 (442%) | — |
| ET | Kept; Predictable value play. | $1,085 (56.6%) | $1,300 (67.8%) | — |
| HPQ (2) | Kept; High margin of error. | $7,168 (252%) | $2,100 | — |
| M | Kept; Brand new trade tracking well. | $3,127 (71.5%) | $5,250 (120%) | — |
| NVO | Kept; Rolled 5 short Sept $45s to Jan $50s even. | $5,488 (57.6%) | $9,500 (99.8%) | $0 (Even roll) |
| OWL | Kept; Riskier context but high recovery math. | $3,863 (180%) | $2,500 (116%) | — |
| PATH | Kept; Tracking well to $15. | $4,302 (69.4%) | $7,250 (116%) | — |
| PFE | Kept; Bought back short $27s, sold 4 Jan $25 calls. | $3,485 (230%) | $2,300 (218%) | — ** |
| PR | Kept; Well on track. | $6,225 (99.2%) | $12,800 (203%) | — |
| SOFI (1) | Kept; Long-term setup holds despite near-term miss. | $4,090 (104%) | $1,950 (49.8%) | — |
| SOFI (2) | Kept; Heavy size structure. | $15,983 (114%) | $11,250 (80.2%) | — |
| STLA | Kept; Brand new entry. | $2,063 (84.6%) | $1,500 (61.5%) | — |
| UUUU | CASHED OUT | — | — | +$12,197 (Inflow) |
| TOTALS | $99,462 | $86,475 | +$25,637 |

