18.1 C
New York
Tuesday, September 15, 2026

PhilStockWorld September Portfolio Review (Members Only)

Finviz Chart

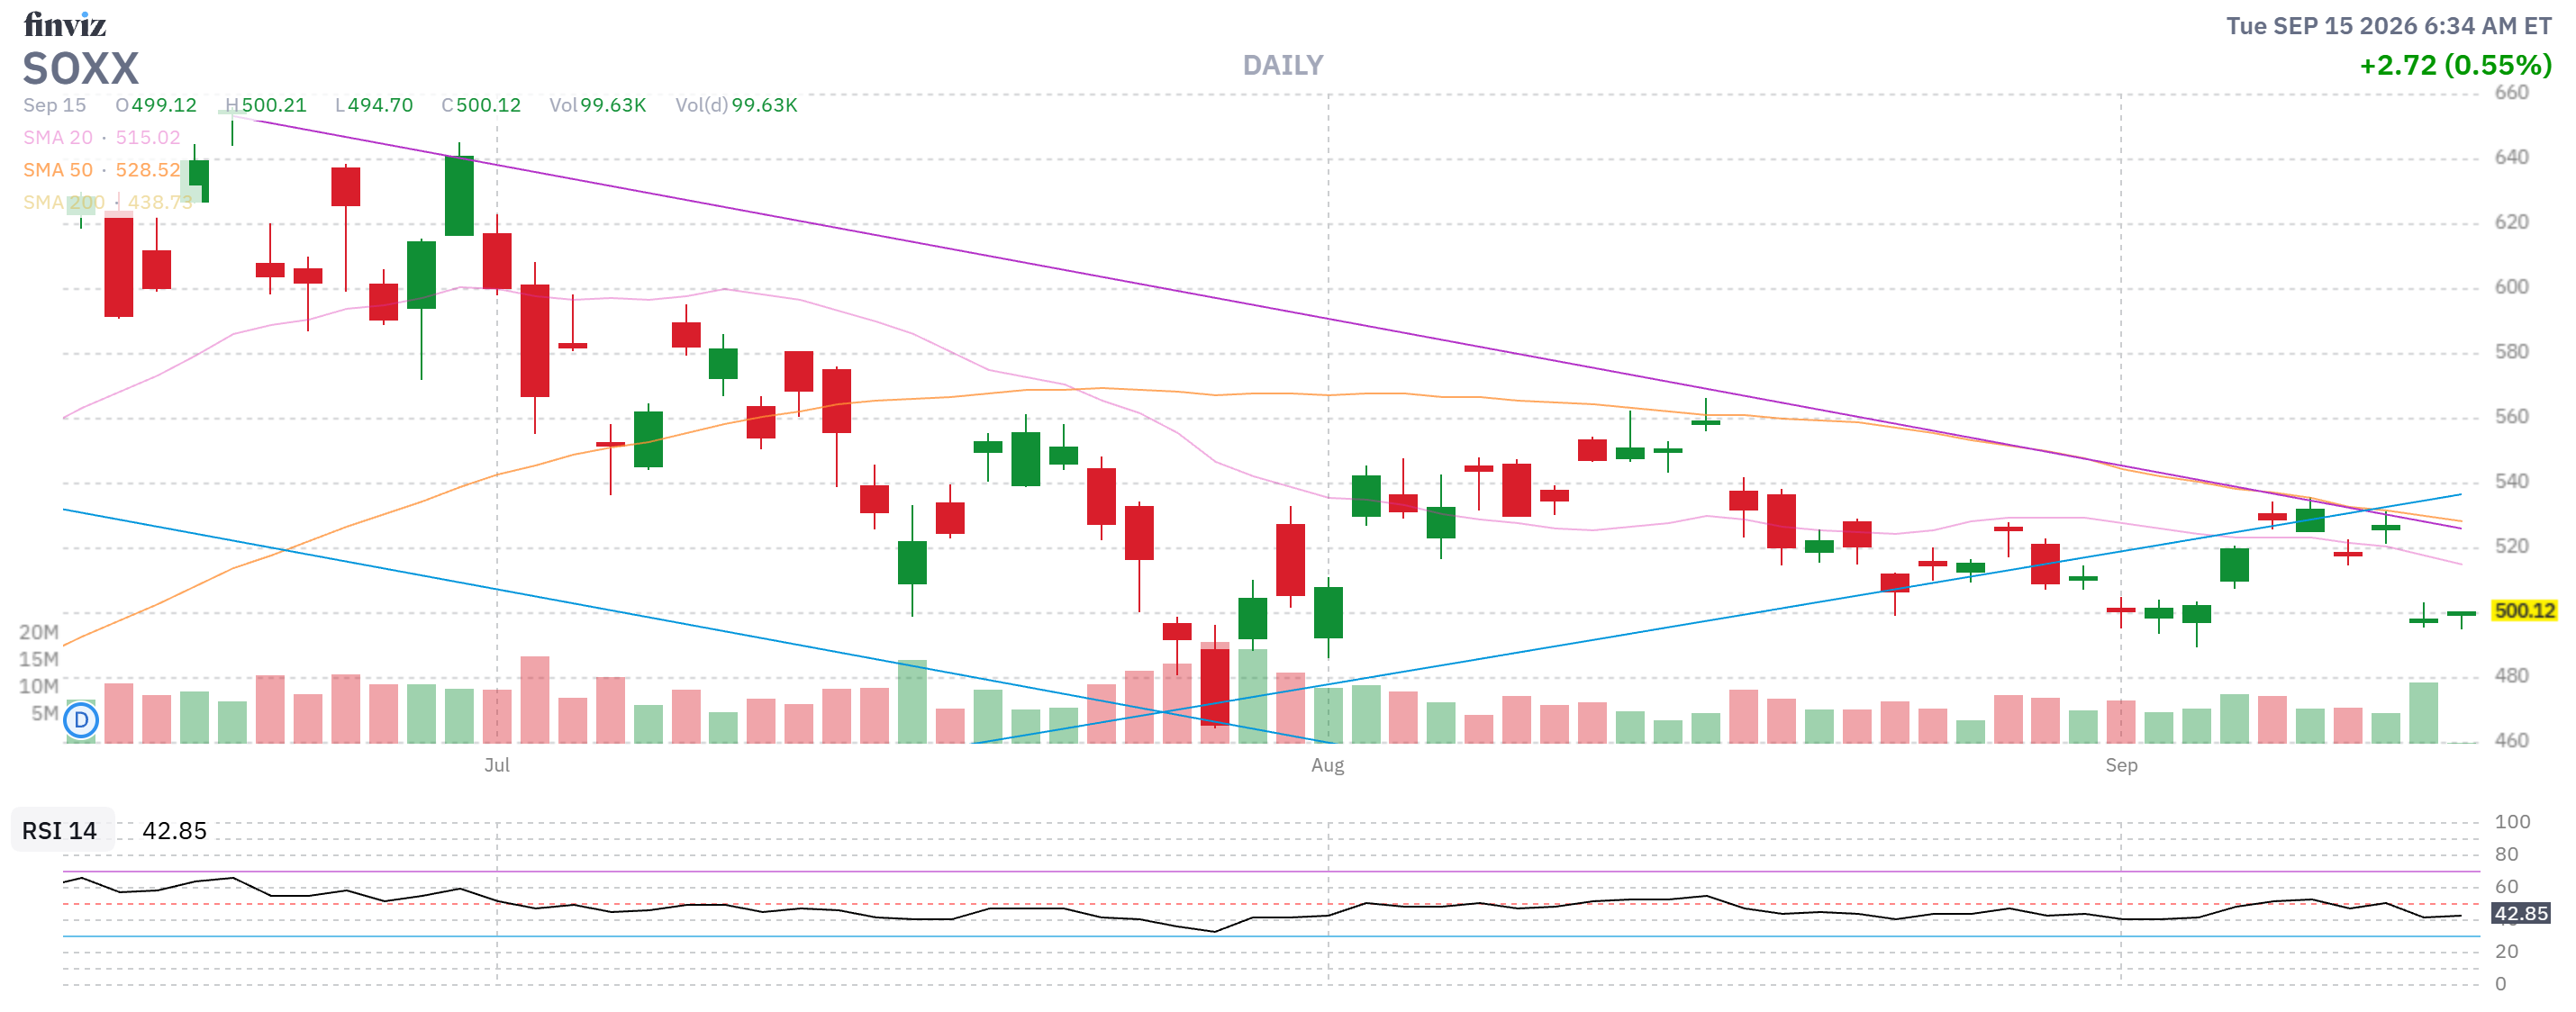
  • That’s the chip sector – down 24% in three months. 

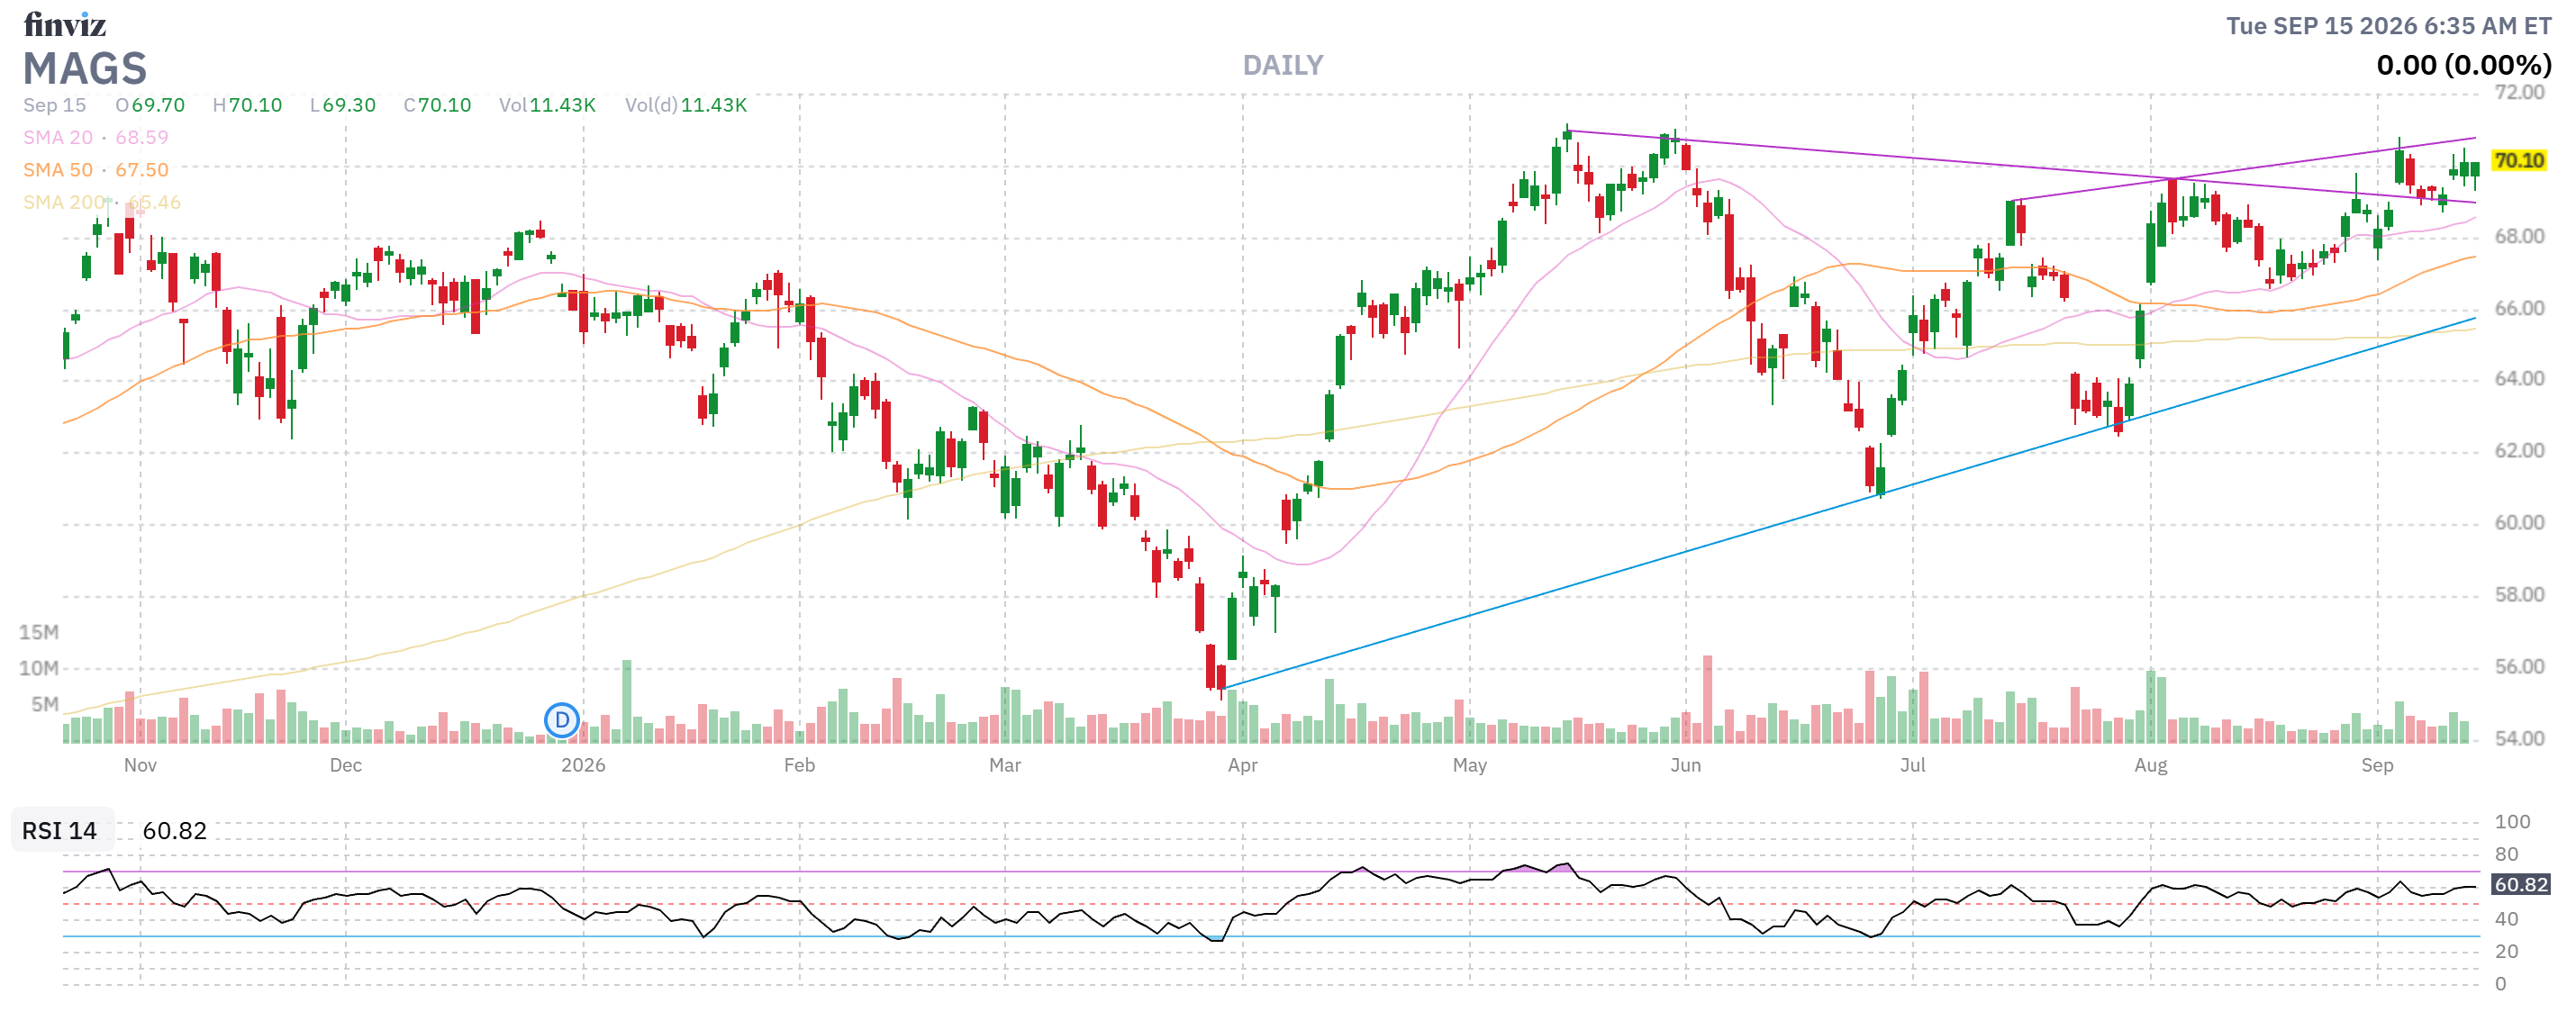
Finviz Chart

  • That’s the Magnificent 7 – oblivious – so far…

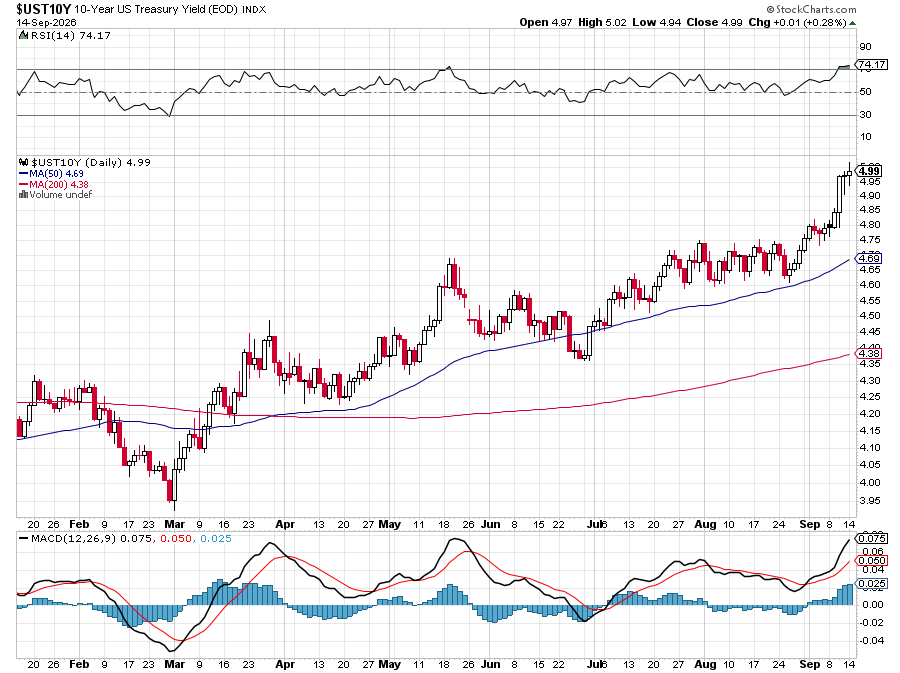
  • That’s the 10-Year Note Rate – DESPITE what the Fed does and, no, it is not being rejected at 5% – it is consolidating for a move higher!  
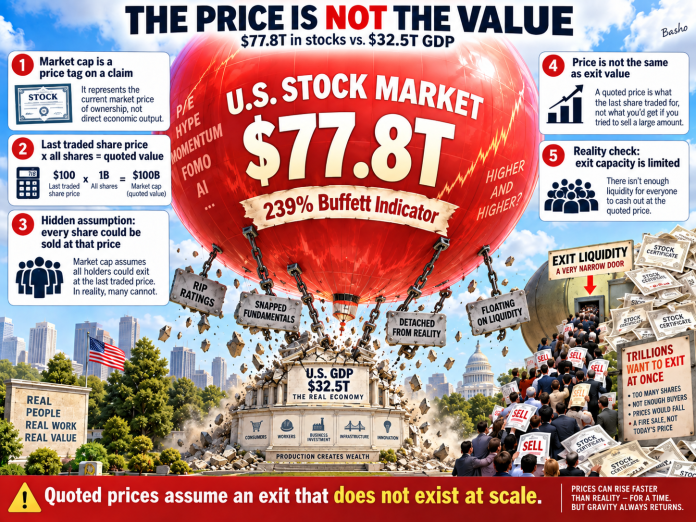
  • This is how much larger the Stock Market is than the GDP it inhabits. 
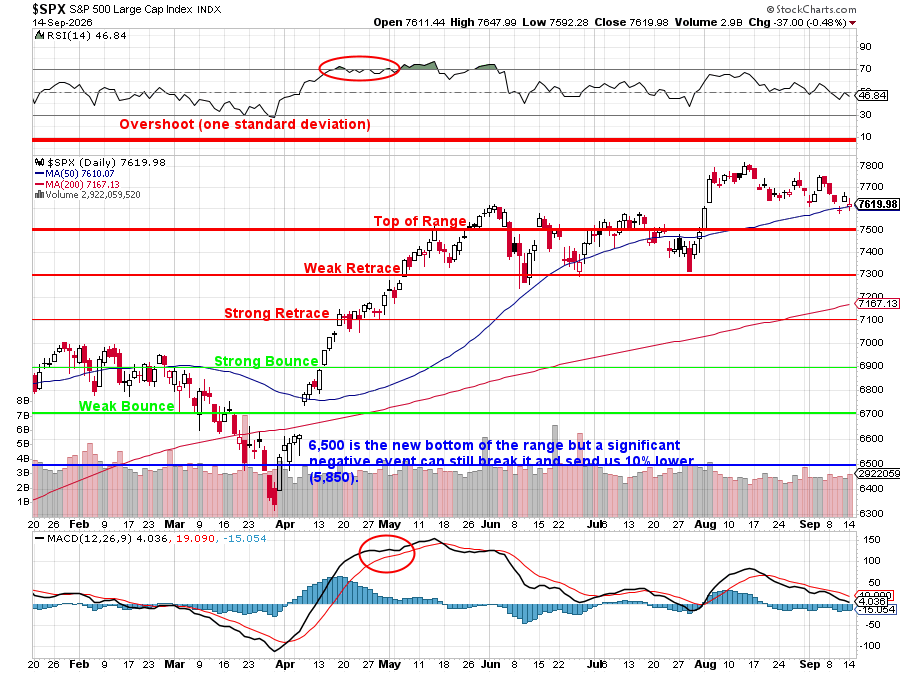
Our last Portfolio Review was on Aug 18th with the S&P at 7,745 and we’re down 1.6% for the month – nothing to panic about as we were up 2.666% from July but this is a market that LOOKS good – but certainly does not FEEL good. And now they are messing with the goose that lays the golden eggs. AI has driven the markets for the past two years – a 40% run from 5,500 in Sept of 2024 but more over 50% from April of 2025.

I have gone on and on about how dangerous the concentration of wealth is – both in the general population and in the markets and, at some point, we’ll see how it unwinds and I would LOVE to cash out now and wait – but I did that in 1998 and I watched the Nasdaq climb another 100% in 1999 and I regretted it.

An Inauspicious Start to Computer Animation: Disney's Chicken Little -  ReactorLesson learned and we called a perfect top in 2008 (after a year of warnings!) and we called a perfect bottom in March of 2009 – so an extra decade of experience was helpful and PSW has made it’s reputation calling near-perfect tops and bottoms since – but this is shaping up to be the next MAJOR correction – hopefully another 15 years of experience will have us well-prepared for what happens next.  

As it stands now, we have our hedges and we have our cash and I don’t expect more than a 20% correction so, if we have $100 now and the market drops 20% and we have $80 but our hedges pay us $10, then we have $90 and we’re ready to buy stocks that only cost $80 – so we get to buy 12.5% MORE stocks than we could have bought at $100. 

Of course, cashing out right at the top is even better as we have $100 when stocks are $80 and we get to buy back 25% MORE stocks than we had before BUT – what if we’re wrong? If we have $100 worth of stocks and the market goes up 20% we have $120 and lose maybe $5 on our hedges – that’s still $115 BUT, if we go to CASH!!! and miss it, then we have $100 and can only afford 83.3% as much stock when we try to get back in.  

This is how Game Theory works, we have to understand the risks and rewards and then we have to place a likelihood for each scenario and decide what we’re comfortable with. At this exact moment – I don’t have enough confidence in a crash to risk not being in the market – but I will certainly want to be well-hedged against the possibility of it happening!

We JUST did a Short-Term Portfolio (STP) Review on Friday in the Live Member Chat Room and we added to our TNA hedge but that was the ONLY thing we changed and that brought us up to about $1.8M of downside protection in our hedging portfolio. That is MORE than the sum value of all of our longs – though we sell a lot of puts – so let’s not fool ourselves into complacency.  

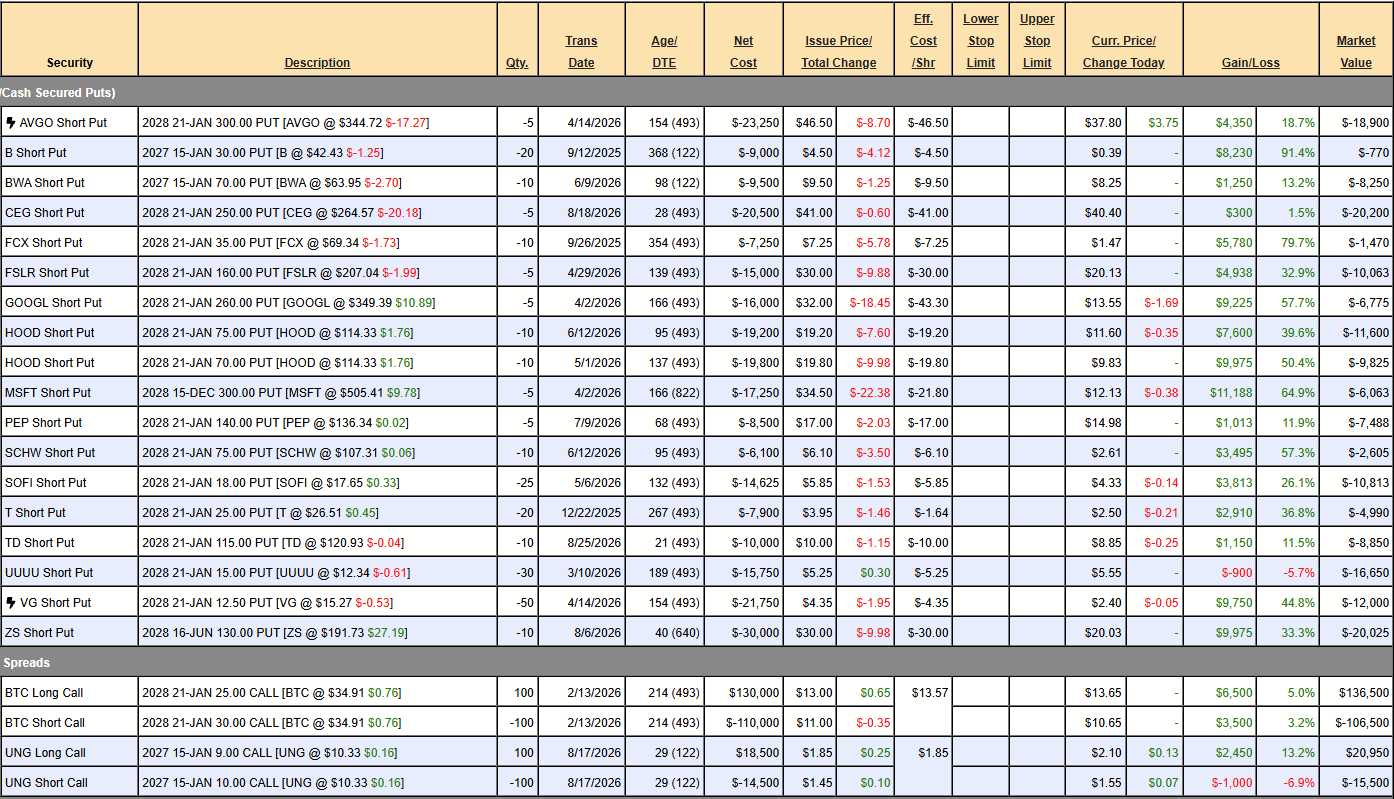
Short Puts – From an exposure standpoint, we’re going to kill the expensive assignments that can put us on tilt in a major sell-off. This is not an indictment of the companies – simply eliminating a worst-case scenario where the stock drops 40% (highly doubtful as these are all companies we like and would love to buy):

    • AVGO – I love them but $300 x 5 is $150,000 of exposure – Kill it! 
    • CEG – $250 x 5 is $125,000 exposure – Kill it!  
    • FCX – No real chance of going back to $35 but we’re up 80% so why wait until 2028 for the last 20%?  Kill it!  
    • FSLR – Kill.
    • GOOGL – Kill 
    • MSFT – Kill 
    • PEP – Kill 
    • ZS – Kill 

Now there are no short puts left that we would not be thrilled to double down on if they dropped 40% and, again, we do not at all expect that kind of correction but we’re removing the tail risk from our portfolios in order to be confident in maintaining our existing longs – without having to be distracted by worrying about being assigned new ones.  

    • BTC – This bet is that Bitcoin holds $65,000 and it pays $50,000 and it’s currently net $30,000 so 66.6% upside potential in 16 months is worth keeping.  
    • UNG – Similar bet with Natural Gas, which has to hold $2.75 to turn into $10,000 and currently net $5,450 so almost a double if all goes well.  

    • GBX – They make freight cars and $43 is stupidly low so we like them long-term.  As a trade, the Dec spread is a net $4,175 CREDIT and we made net $800 (20%) selling short-term premium for 2 months. Note the Dec $45 puts are only $2 in the money but are priced at $4 so we have $2 ($4,000) coming to us if GBX holds $43 there so it is worth keeping.  
    • To that end, we are going to roll the 30 Dec $45 calls at $2.30 ($6,900) to 50 April $42.50 ($5.30)/52.50 ($2.10) bull call spreads at net $3.20 ($16,000) and we’ll close the short Sept puts ($4,450) and sell 10 Dec $45 calls for $2.20 ($2,200) and 10 more Dec $45 puts for $4 ($4,000)

Finviz Chart

    • LULU – We are going to move this to the LTP, which means the LTP will pay the STP back the original net $7,750 and absorb the loss – after which we will adjust LULU as a long-term hold. 
    • Why? Because this is no longer a short-term position – it will take years for them to recover but it’s still a good income play.  

Finviz Chart

MSTR – This is technically another Bitcoin trade and we’re miles over target so let’s roll those 7 short Sept $100 calls ($25,953) to 10 short Jan $140 calls at $25.50 ($25,500) and we can also sell 5 Jan $125 puts for $16.15 ($8,075).  

We paid net $16,300 for the spread and now we’re collecting another net $8,000 so our basis is down to $8,300 on the $37,500 spread we started in July.  All that has to happen (since the spread is deep in the money) is for us to get lucky ONE TIME and thread the needle on our quarterly sales and this is a jackpot! 

Finviz Chart

This is a great example of how we engineer our own “luck“!  

    • OSIS – Already at our goal!
    • PUMP – We paid net $500 and we’re up $2,100 but it’s a $7,500 spread so I’d like to see how it goes.  

Finviz Chart

    • SOUN – Earnings were good so I’m sticking with them.
    • SPY – 80% of $760 is $608 so call it $160 x 40 = $640,000 potential on a 20% drop. The current net is $142,545 so we have $497,455 of downside protection. We sold $26,250 in premium just last month for Jan so 3 more collections like that is half our money back over the next year in premium sales.  That’s cheap insurance!  

Finviz Chart

    • SQQQ – We ignore the short $100s because they are mathematically unlikely. 1.6 x $40 is $64 so our $30 calls can be $34 x 300 = $1,020,000. The net of the spread is $181,525 so we have net $838,475 in downside protection

Finviz Chart

    • TNA – We bumped up to 150 $60 puts and a 20% drop in the Russell knocks TNA down 60% to $25.60 so potentially $34.40 x 150 is $516,000. The current net is $94,500 so there’s $421,500 worth of downside protection here.  

Finviz Chart

UNG – Same as the above – it’s a nice little income-producer. 

USO – A bullish bet on oil? I have to go back as I’m sure one of those Oct positions should be short puts, NOT short calls and I have to figure that out before we adjust.

Finviz Chart

    •  VOYA – Already at our goal! This was a $960 credit spread in July and we’re already up $9,560 (995%) in two months.
    • This is why we don’t need to chase these tech stock or meme stocks – just find us a good value stock and the right options spread will outperform anything the idiots on TV are telling you to BUYBUYBUY!  

Finviz Chart

So that’s $1,757,430 of downside protection for the long portfolios, which we’ll look at next:  


IN PROGRESS


6 COMMENTS

Subscribe
Notify of
6 Comments
Inline Feedbacks
View all comments

Stay Connected

148,415FansLike
396,312FollowersFollow
3,260SubscribersSubscribe

Latest Articles

6
0
Would love your thoughts, please comment.x
()
x