

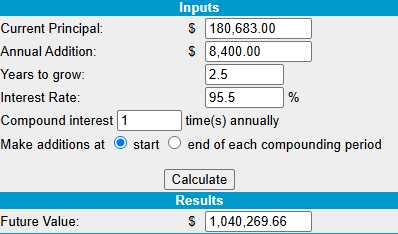
Despite a rough month for the markets, our $700/Month Portfolio gained a nice $9,830 (5.7%) since our Oct 7th Review and we are still on track to hit our $1M goal in July of 2029 and THAT is still $819,317 from here so, if you were to start with $180,683 today and add $700/Month from now until then and IF (a very big IF) we can keep up this pace of gains – then we are on track to hit $1,040,269.66 in May of 2029. Simple!
Unfortunately, the mega-rally that’s been driving this portfolio for the past 50 months is clearly coming to an end and, USUALLY, we would be THRILLED with making 20-40% annual returns – averaging 95.5% for the past 4 years WITHOUT using margin has been amazing!
We started out with $700 on August 25th, 2024 and, each month since, we have put another $700 into the portfolio – which I know seems silly but, if we didn’t keep doing that, our May 2029 total drops to $965,570 so 32 x $700 ($22,400) less contributed leads to $74,699 LESS money in less than 2.5 years – THAT is the importance of SAVING MONEY!!!
We’ve been playing cautiously the past two months – into earnings and now they are finally here and these are our last year’s worth of reviews – in case you’d like to catch up:
-
- How to Become a Millionaire by Investing $700 per Month – Part 50/360
- How to Become a Millionaire by Investing $700 per Month – Part 49/360
- How to Become a Millionaire by Investing $700 per Month – Part 48/360
- How to Become a Millionaire by Investing $700 per Month – Part 47/360
- How to Become a Millionaire by Investing $700 per Month – Part 46/360
- How to Become a Millionaire by Investing $700 per Month – Part 45/360
- How to Become a Millionaire by Investing $700 per Month – Part 44/360
- How to Become a Millionaire by Investing $700 per Month – Part 43/360
- How to Become a Millionaire by Investing $700 per Month – Part 42/360
- How to Become a Millionaire by Investing $700 per Month – Part 41/360
- How to Become a Millionaire by Investing $700 per Month – Part 40/360
- How to Become a Millionaire by Investing $700 per Month – Part 39/360
- How to Become a Millionaire by Investing $700 per Month – Part 38/360
- How to Become a Millionaire by Investing $700 per Month – Part 37/360 – Year 4 Begins!
We’re currently sitting on $65,158 (36%) CASH!!! and we have deployed some this month on new plays and we do have a large hedge (SQQQ) to protect us – so we’re ready to take advantage of more stocks that go on sale for dumb reasons but we do want to maintain some flexibility – as the market is still VERY uncertain.
-
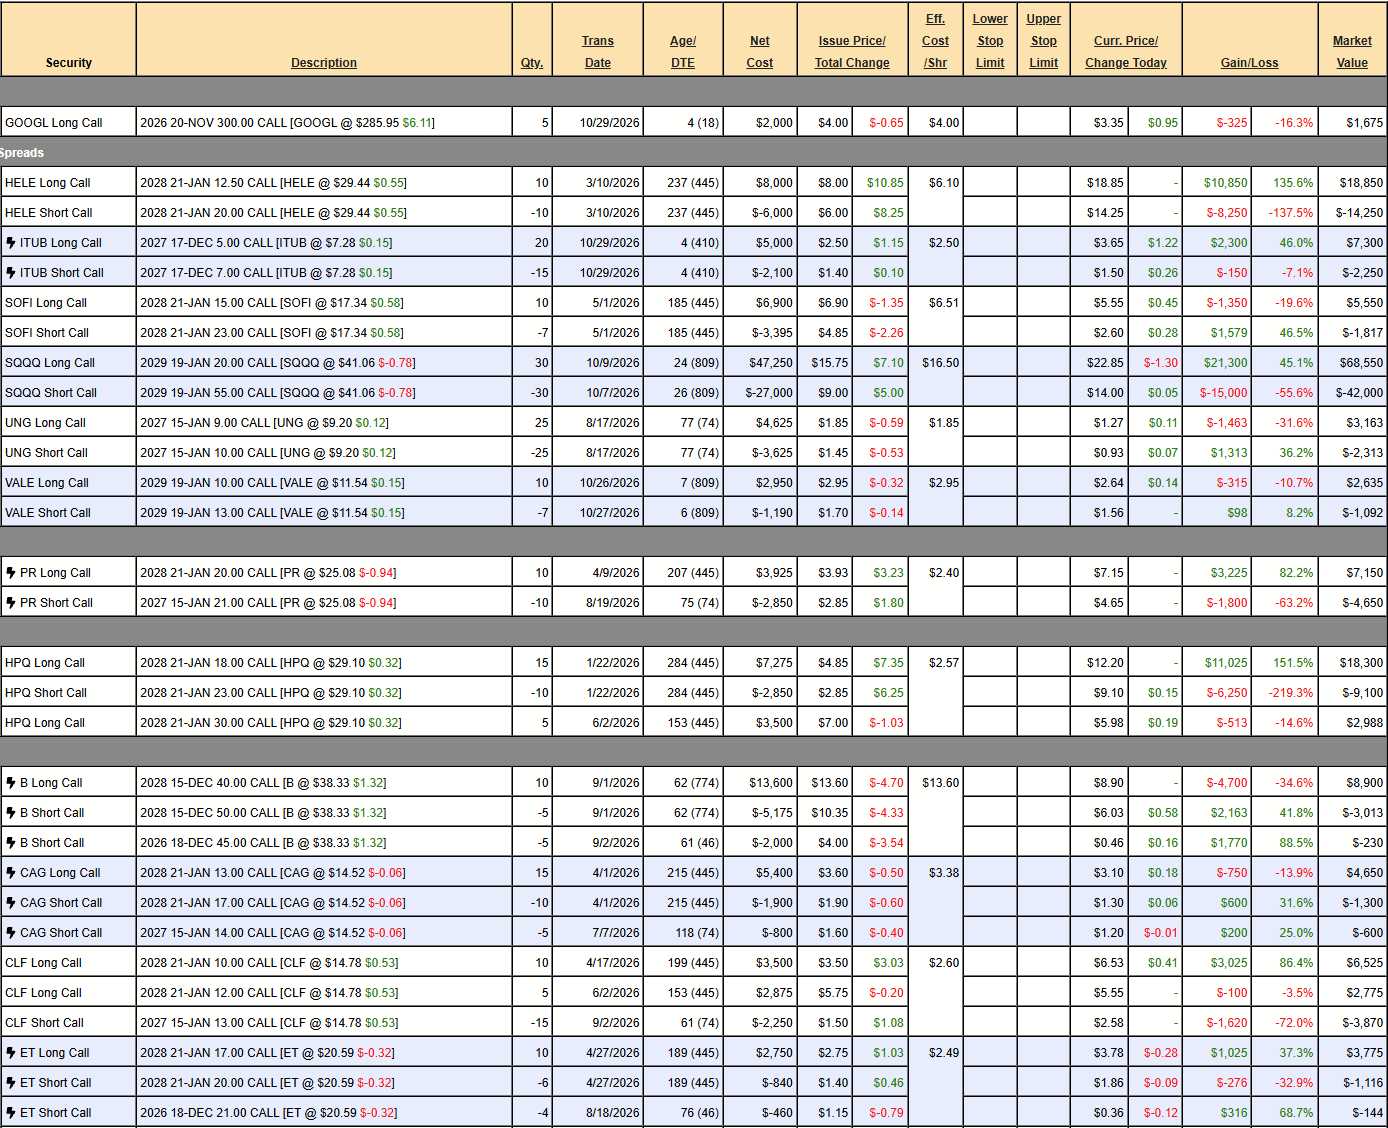
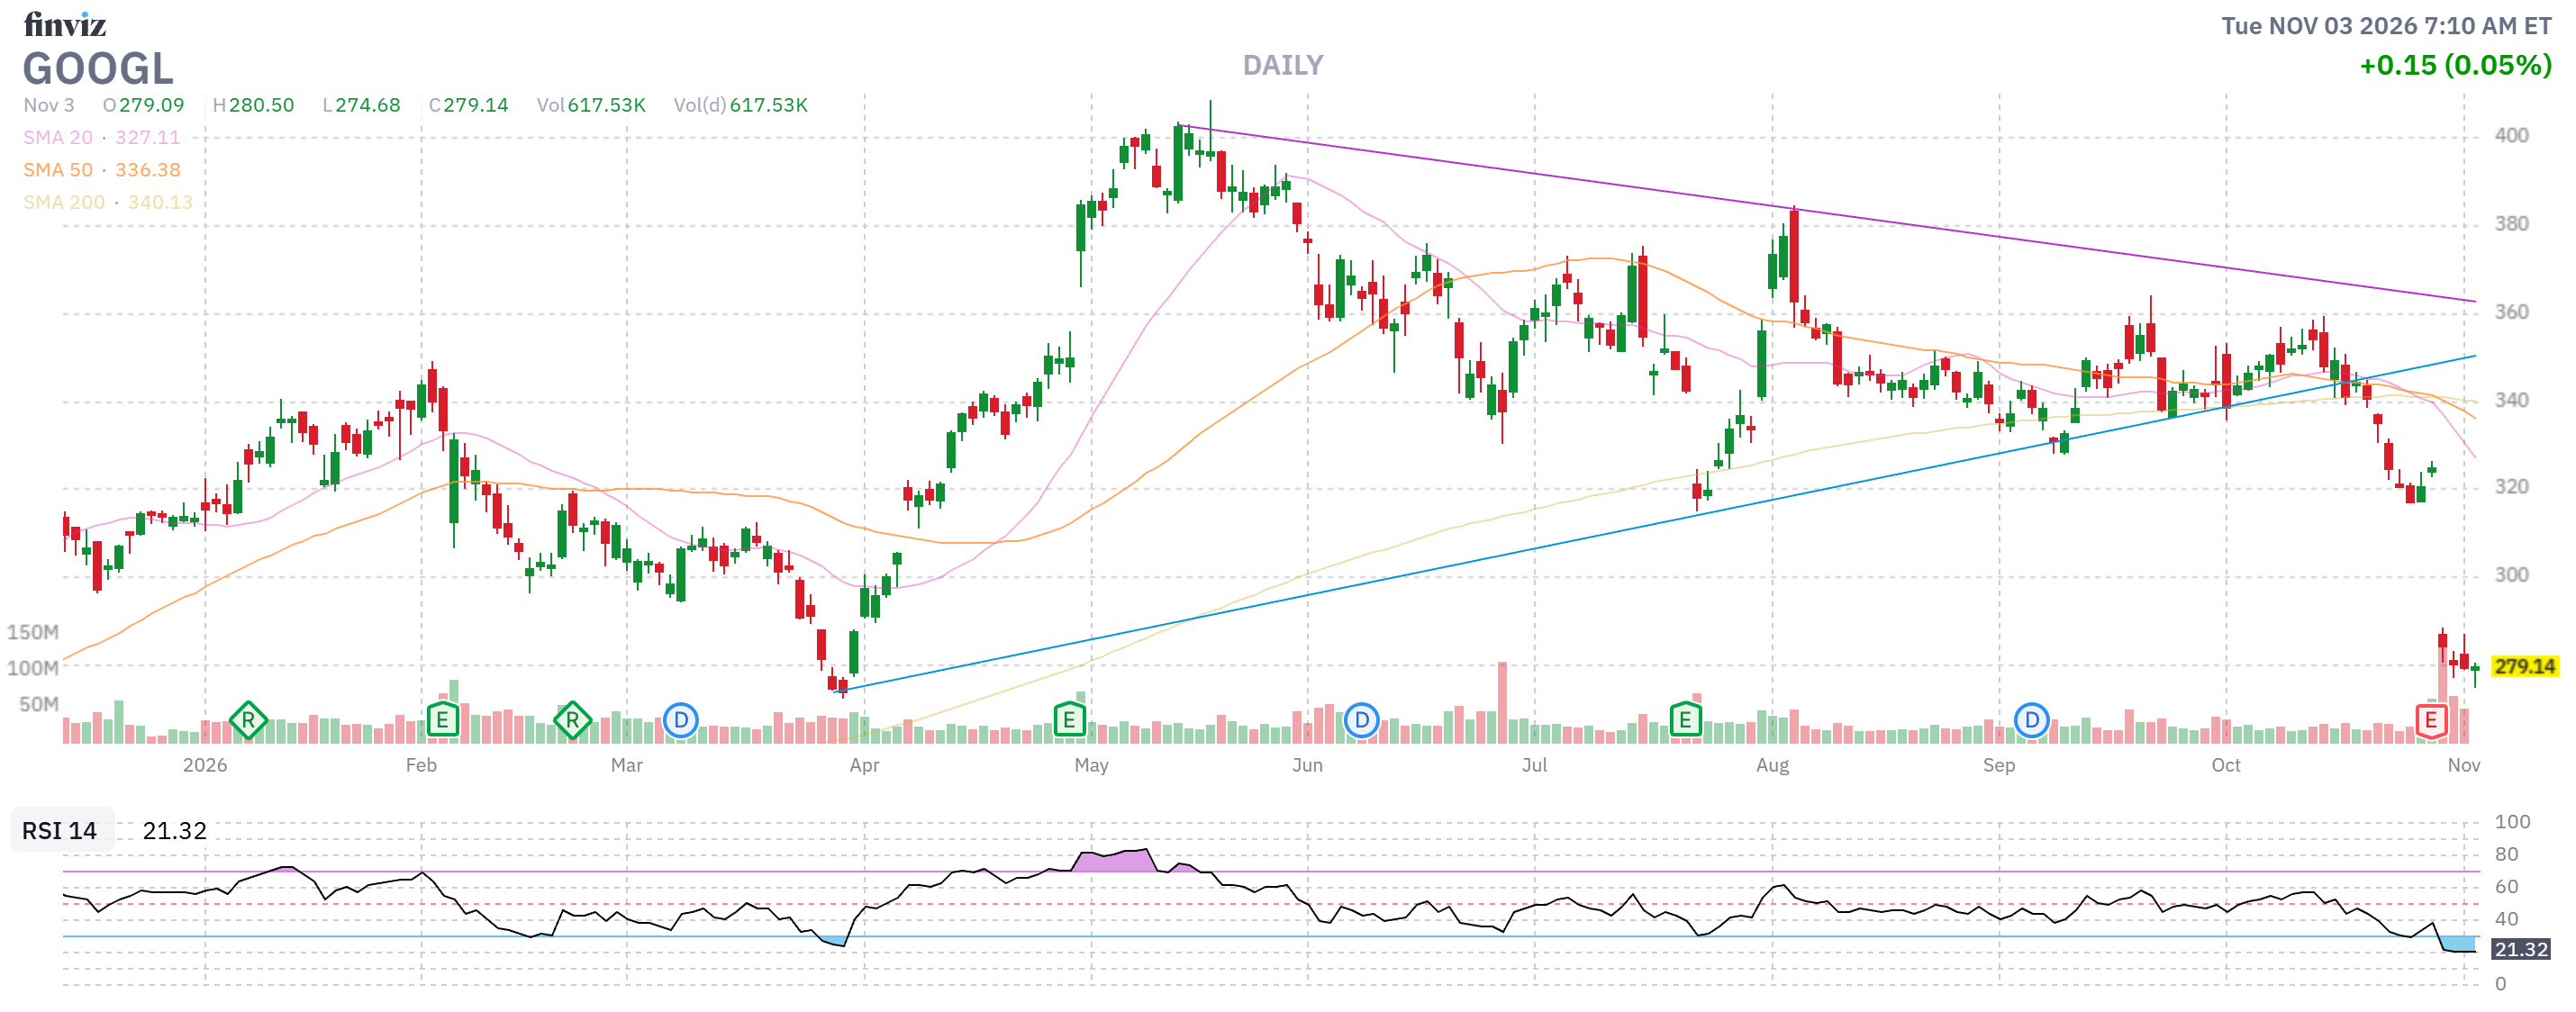
- GOOGL – A very rare gamble for us, that GOOGL would bounce after the earnings dip but it didn’t and our time-frame is too short to wait and see so we will take the quick loss and move on.
-
- HELE – Earnings were good and we are on track for the full $7,500 at net $4,850 so there’s $2,650 (54.6%) left to gain if HELE holds $20.
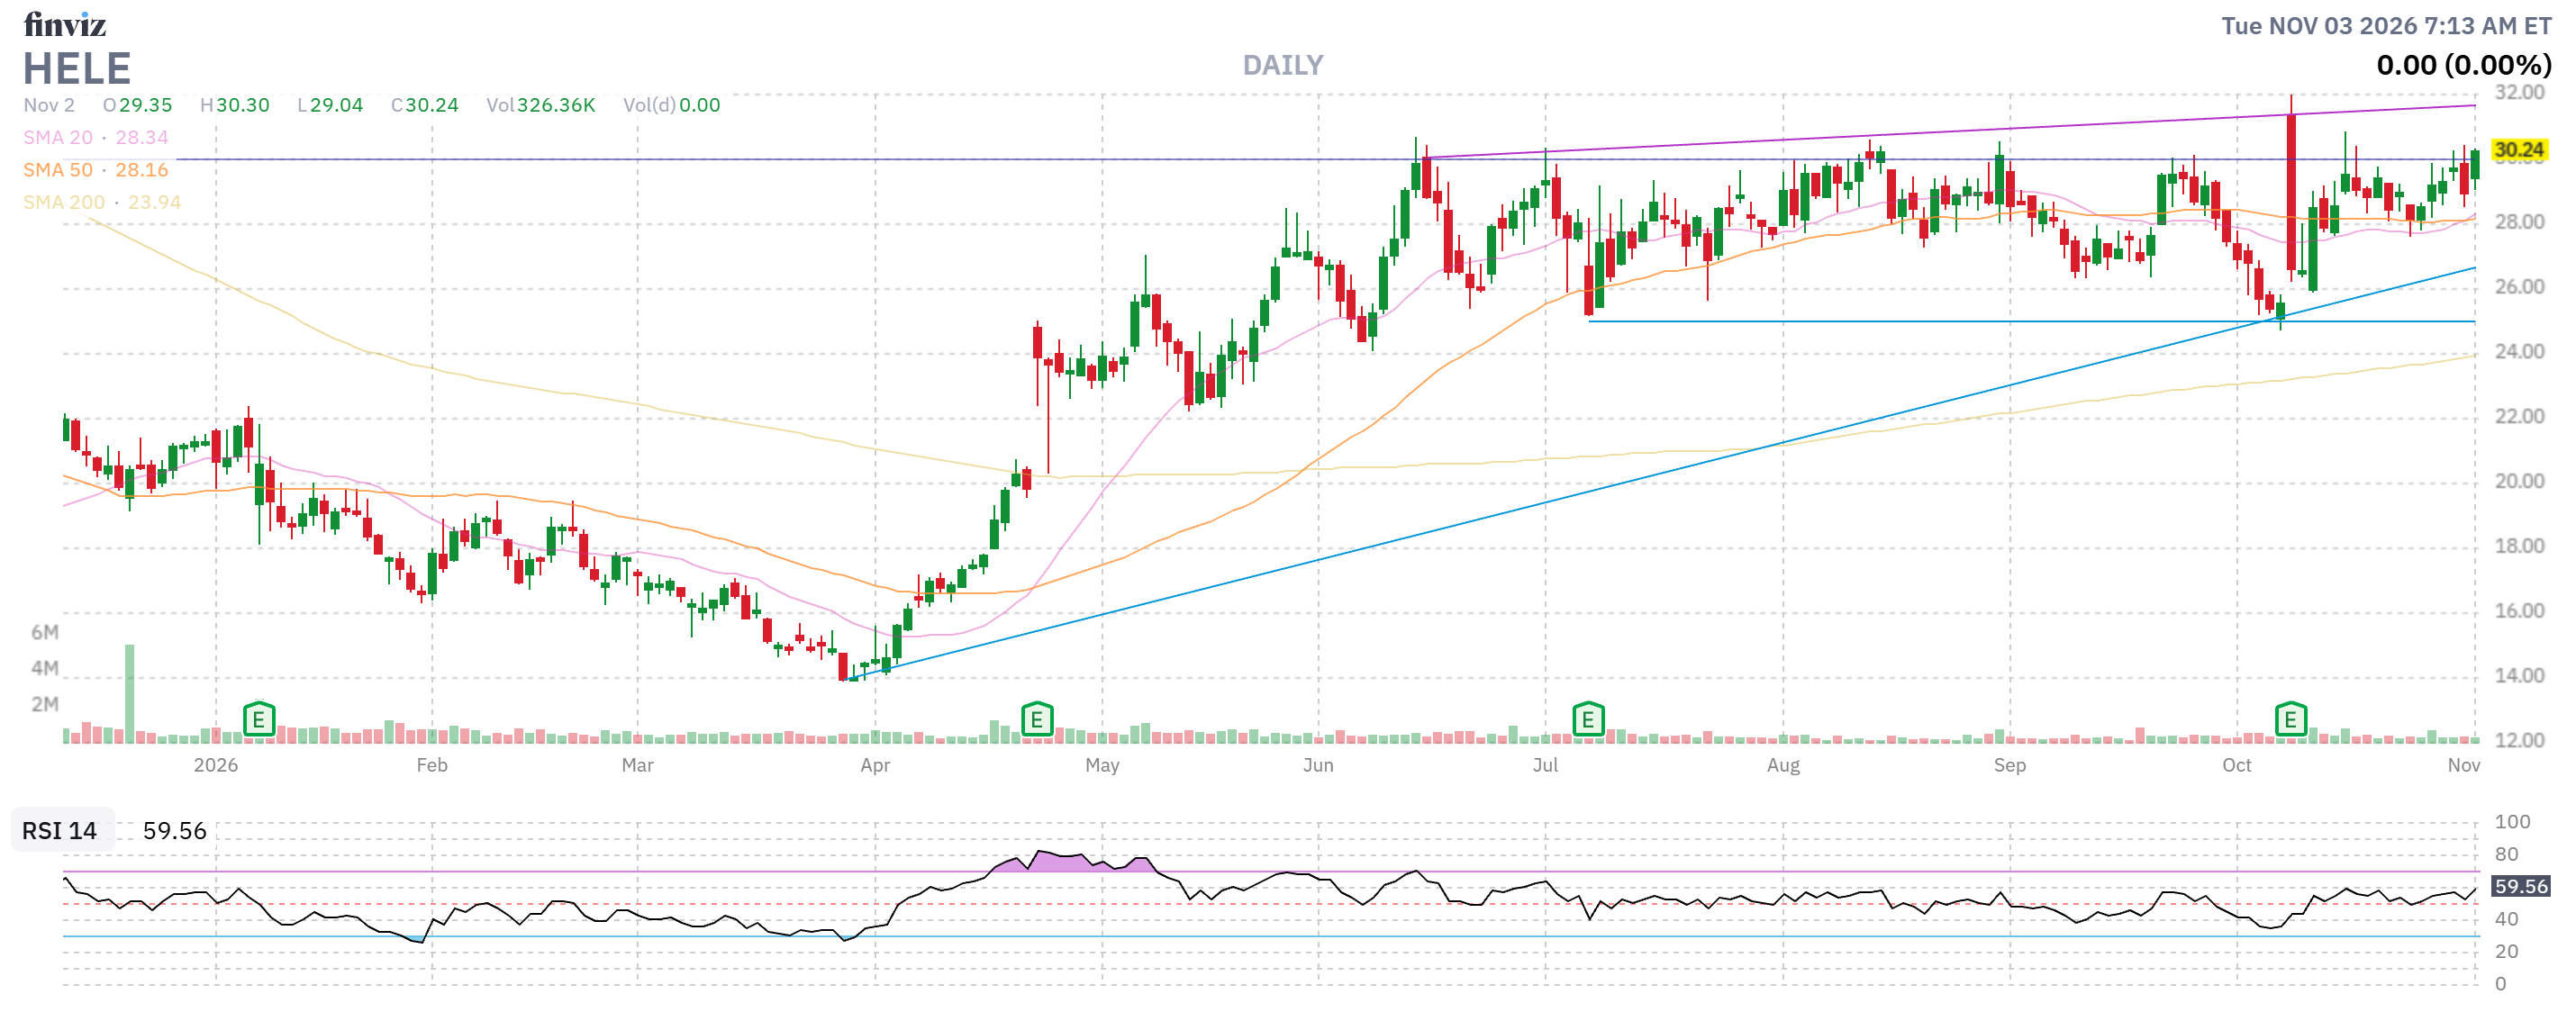
In any other trading site, that would be considered an amazing trade! Unfortunately, for PSW, it’s below the blazing 95.5% annual pace we’re been blessed with. BUT, we do not, at the moment, have anything better to do with the cash AND we have to consider the reality of the markets going forward – 54.6% in a year may be back in fashion soon!
-
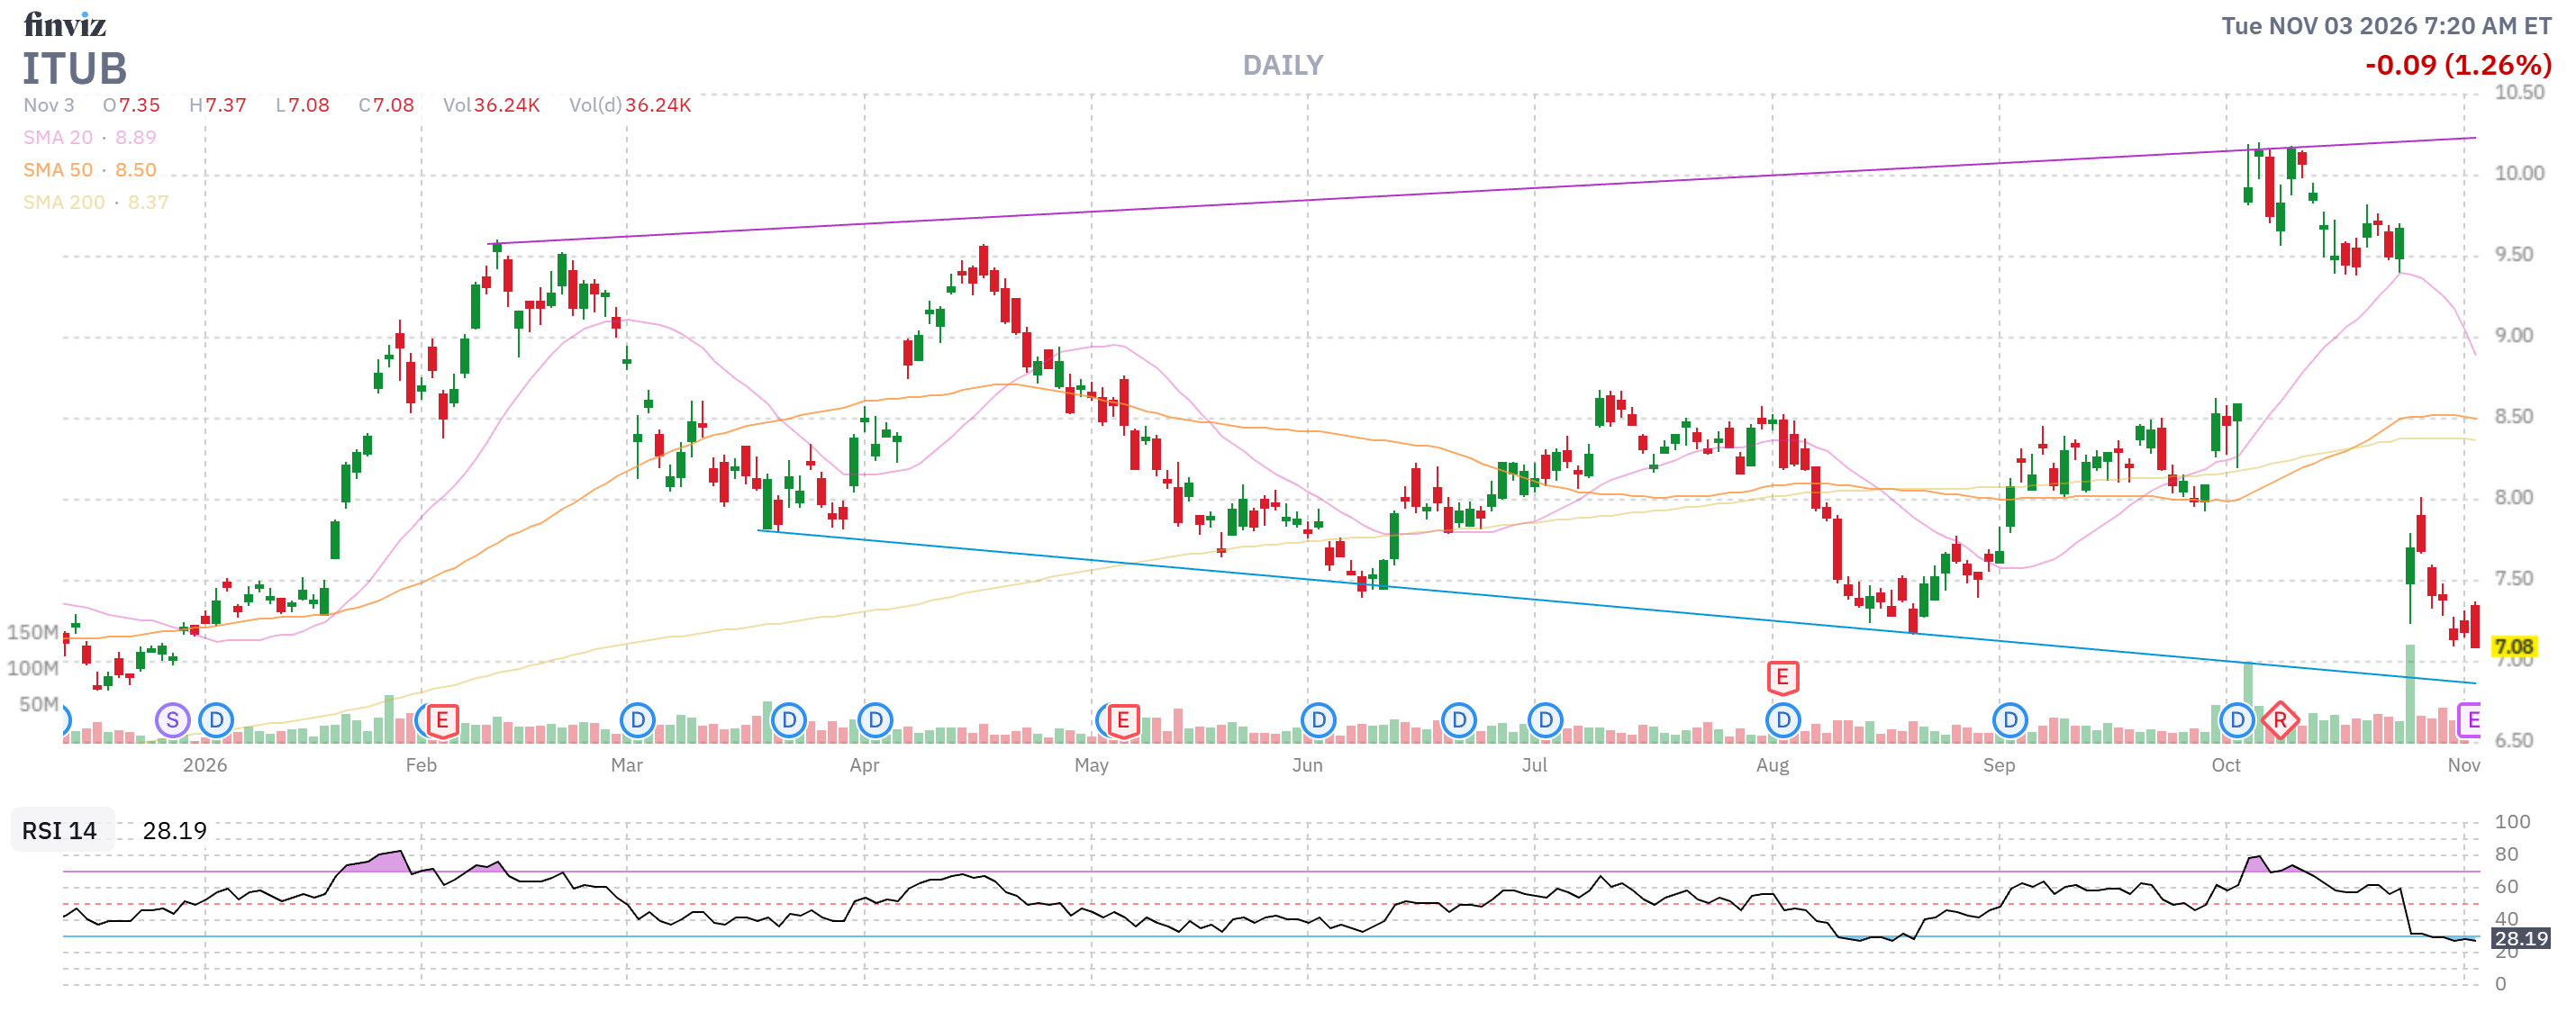
- ITUB – Brand new trade we entered at net $2,900 on the very short-term $4,000 spread and already (less than a week!) we’re at our goal and at net $4,050 and up $1,150 (39.6%) so, of course, WE CASH OUT!
-
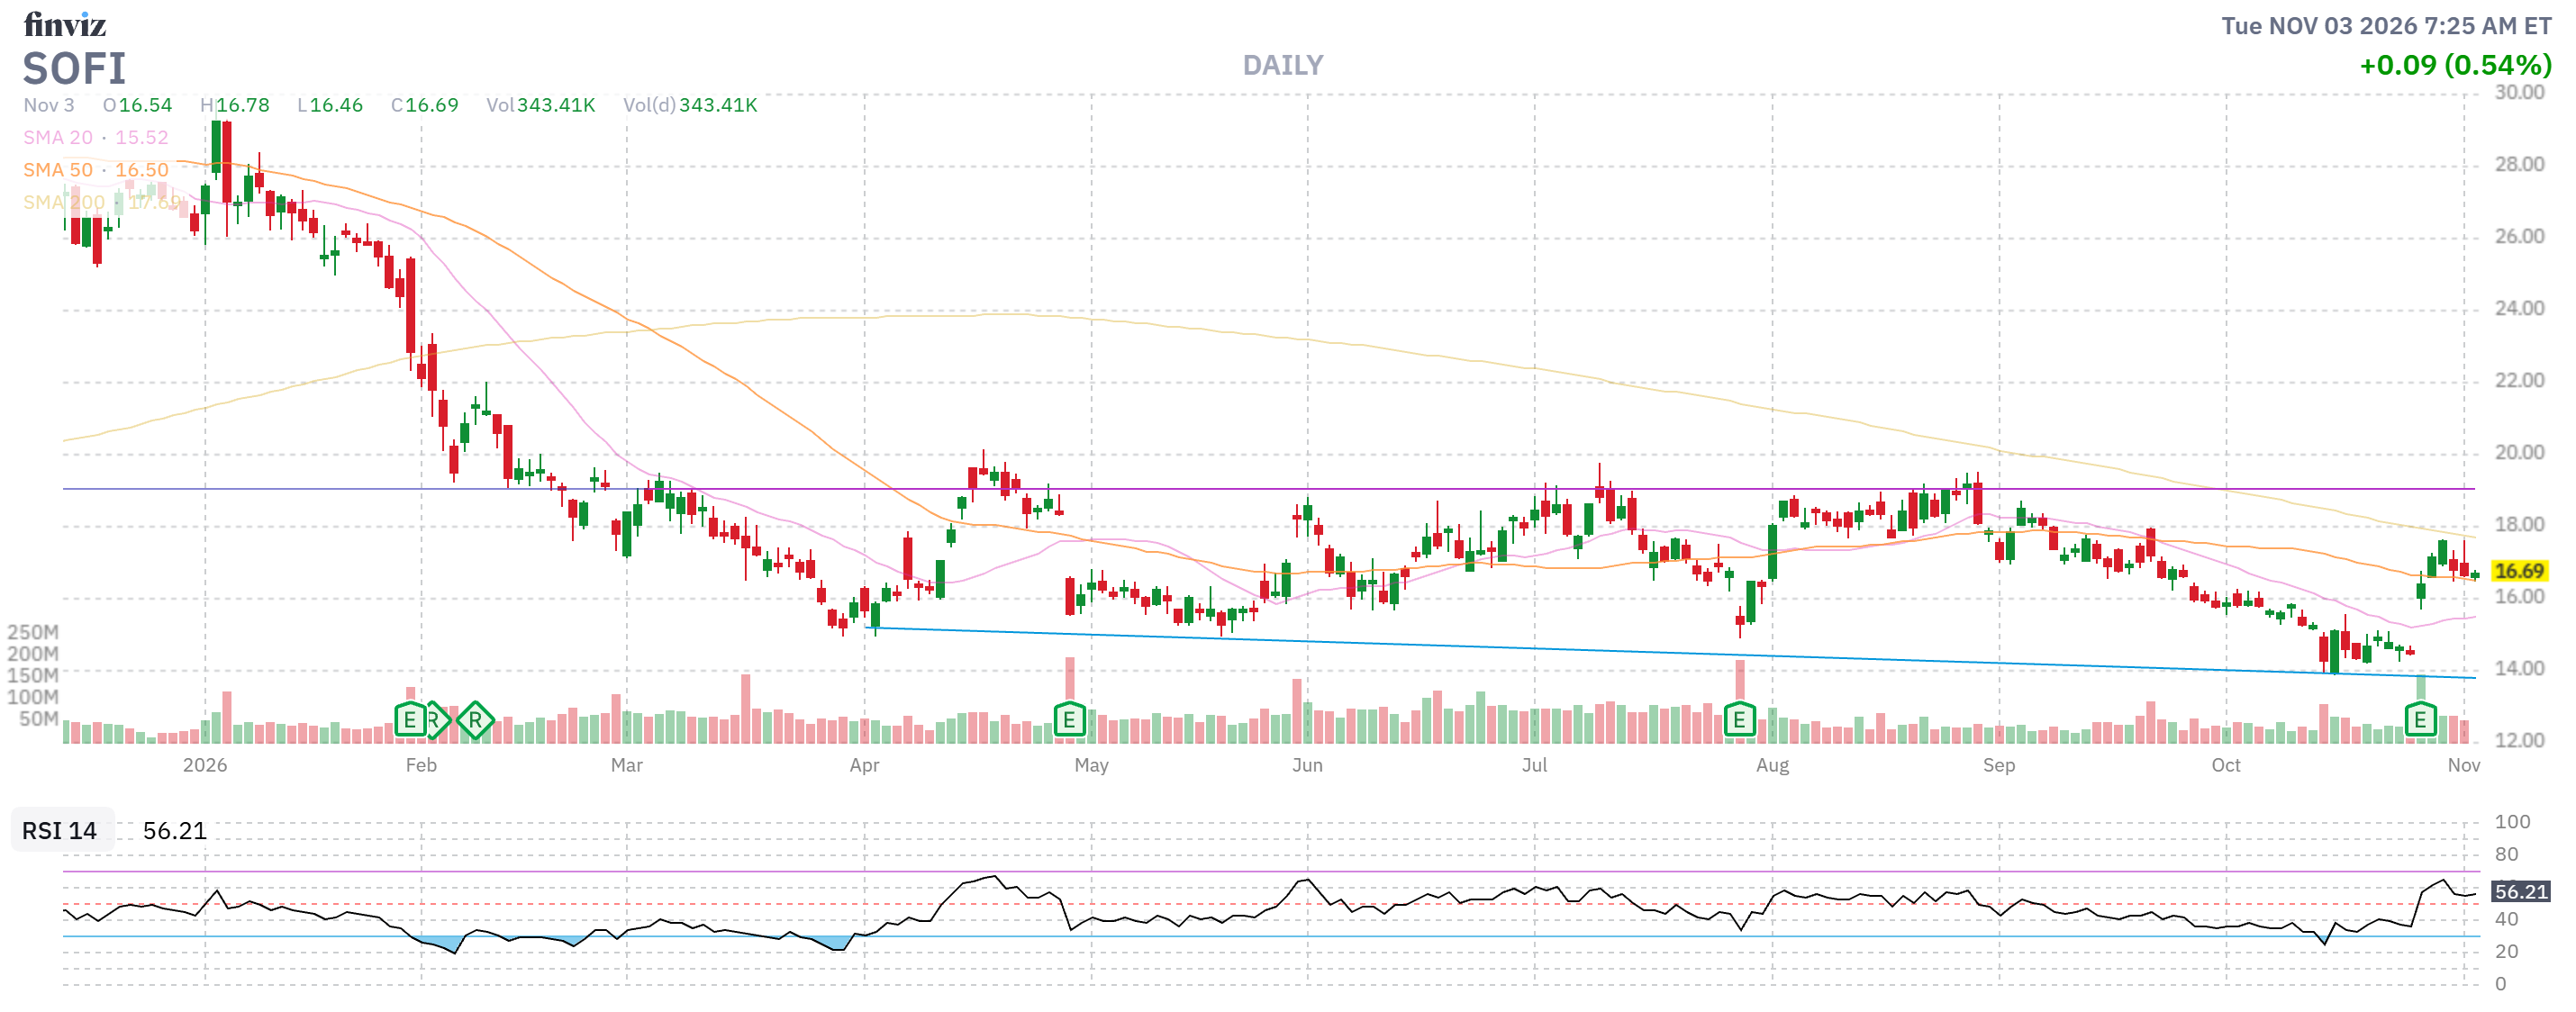
- SOFI – We were partially uncovered into earnings and that worked out but now we have to remember our JOB is to sell premium so we will sell 3 Jan $17 calls for $1.35 ($405), which is 12.1% of our $3,340 net spread over the next 73 days. We have 4 more quarters to collect $1,620 (48.5%) next year and, hopefully, we end up at our $23 goal with another potential $4,660 (139%) so this one is GREAT For a New Trade!
-
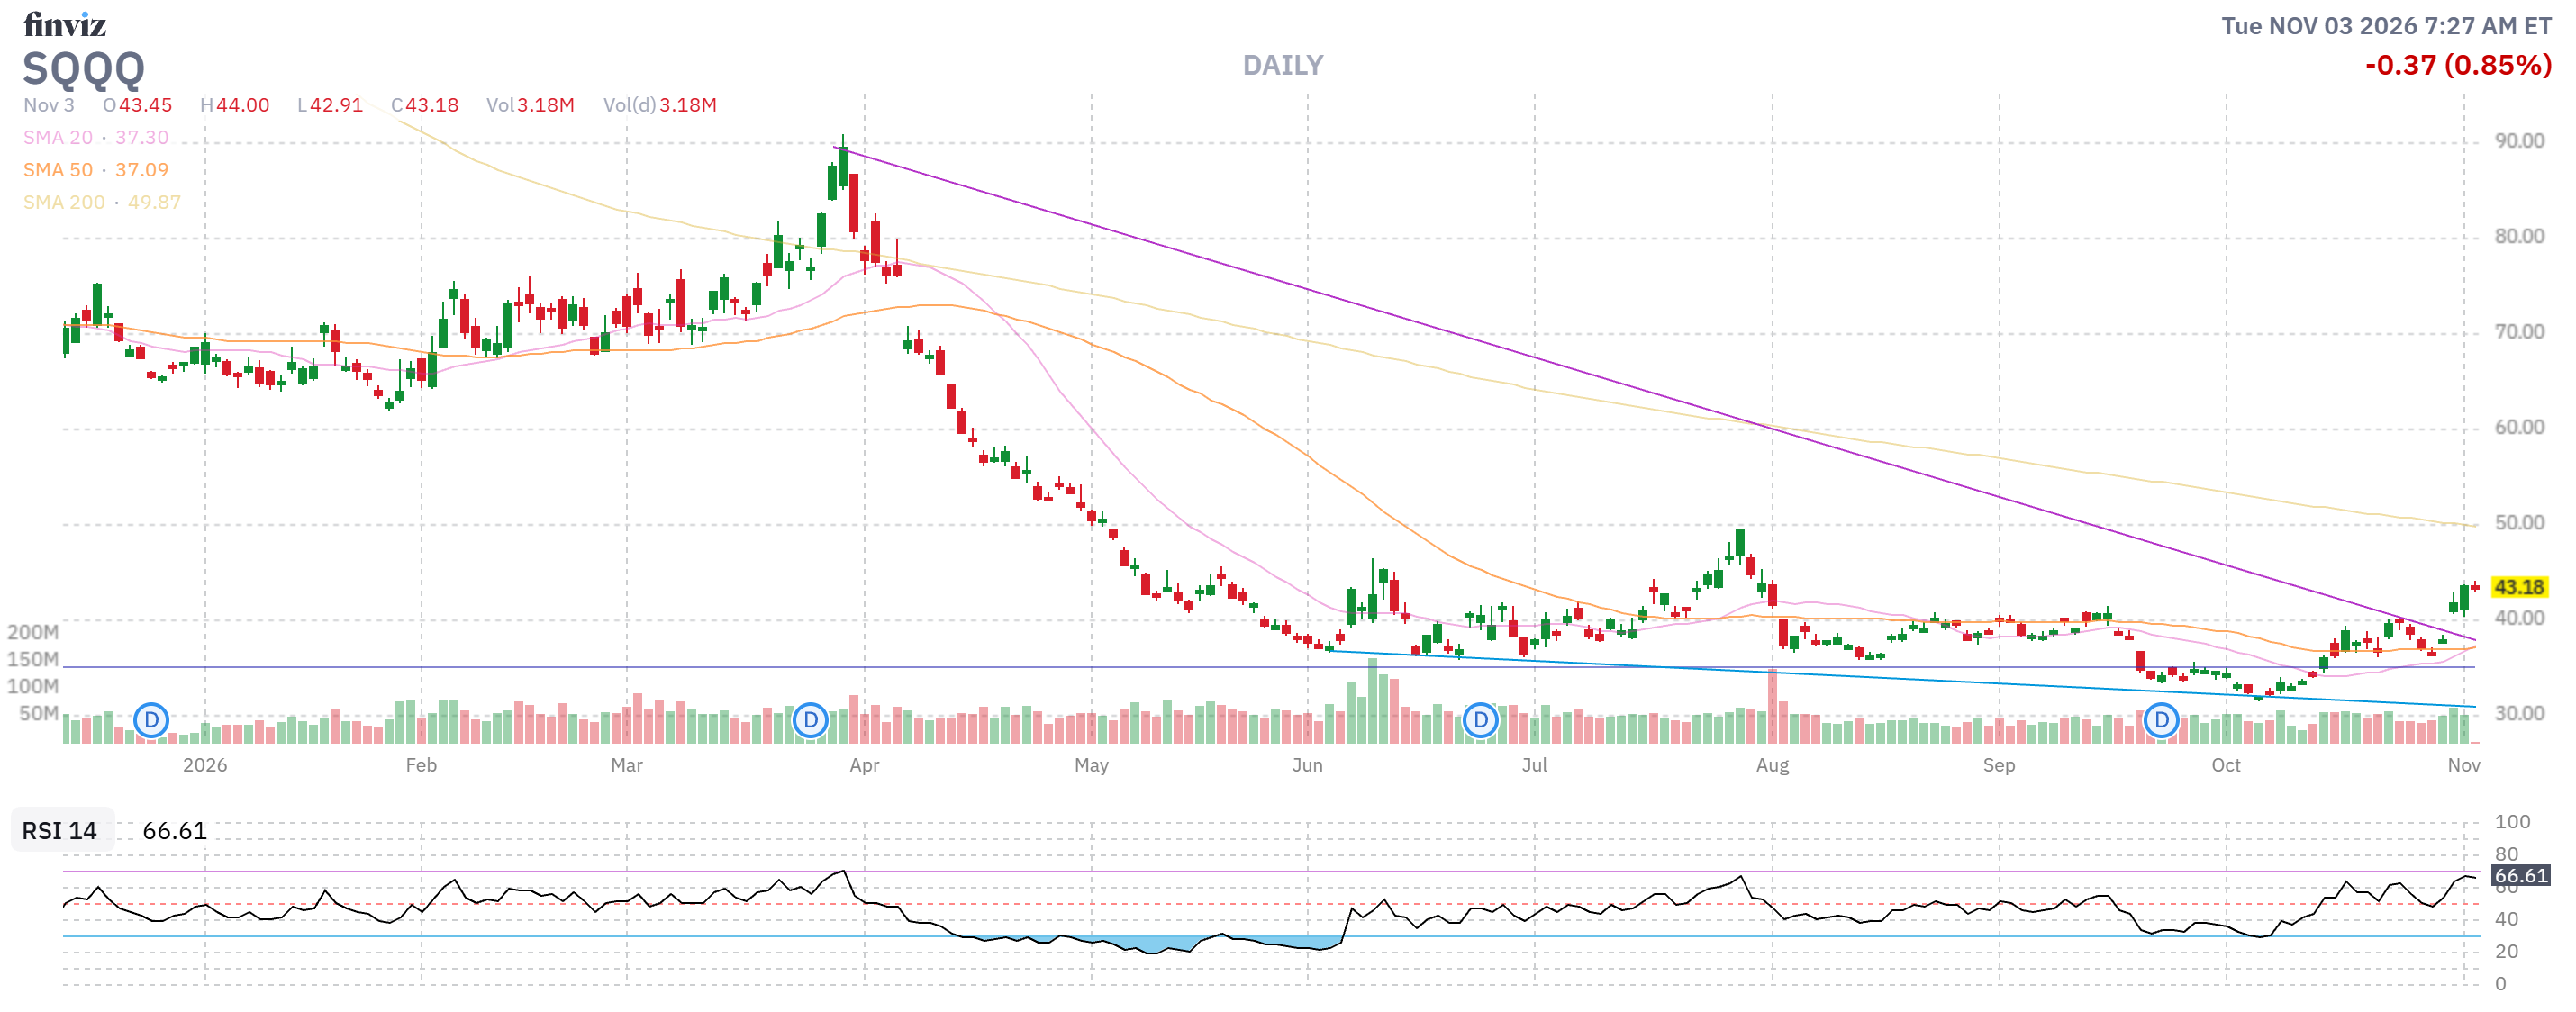
- SQQQ – Here is our hedge. At $55, this spread would be $105,000 and it’s currently net $30,150, so it’s providing net $74,850 worth of downside protection.- about half of our total portfolio’s value and covering 2/3 of our invested total. Since we are not using margin – that’s rock-solid protection!
-
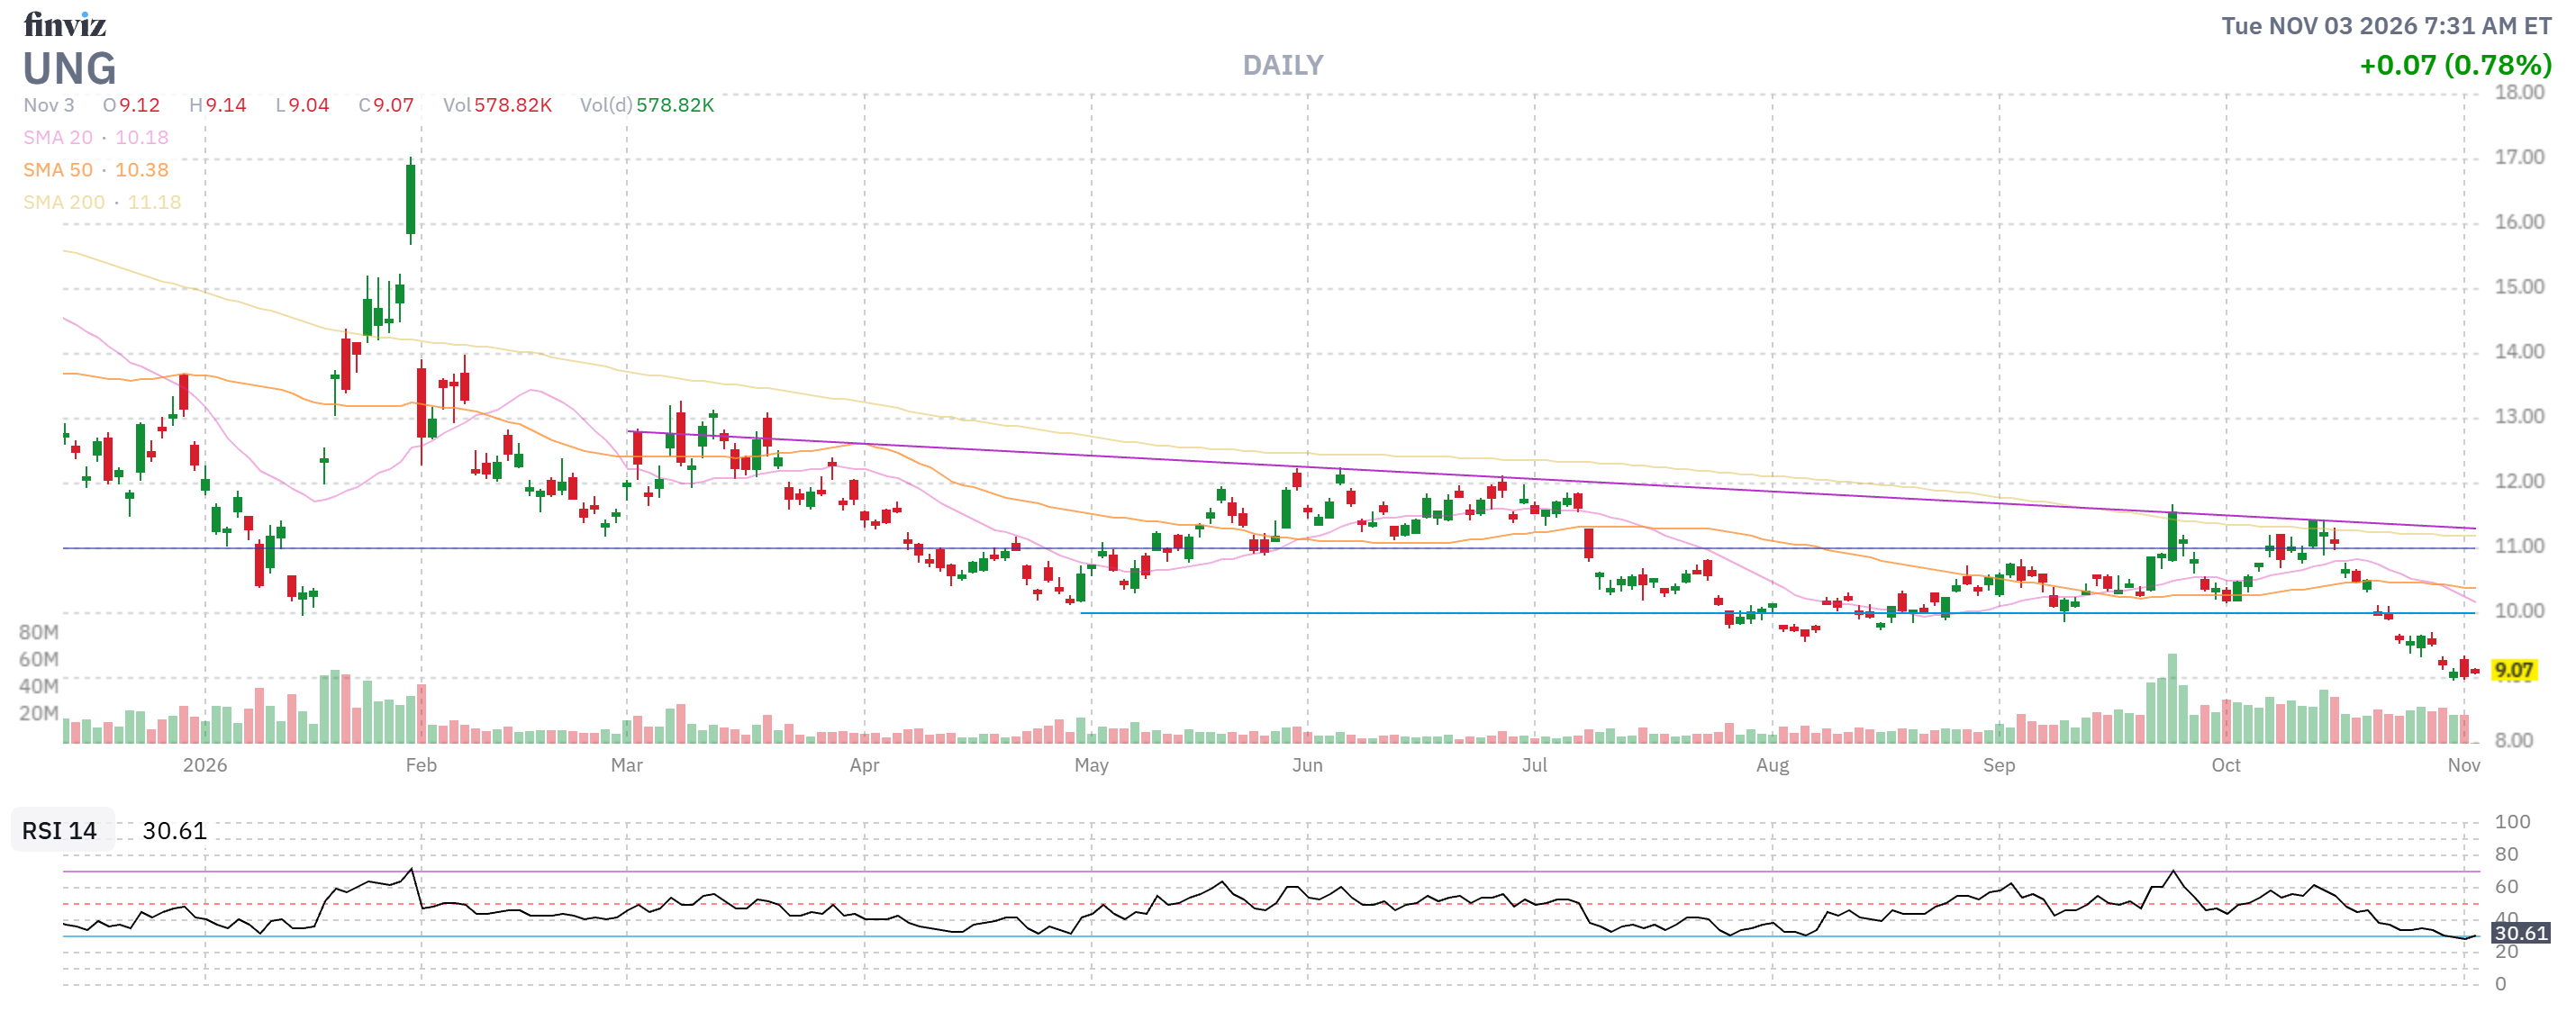
- UNG – We now have a small loss and a short time-frame and a mild winter is now forecast so this $9/10 spread is a bit more of a gamble than we expected. In a larger portfolio, I’d roll out for time but here I’d rather take the $162 loss and put our money back to work elsewhere.
-
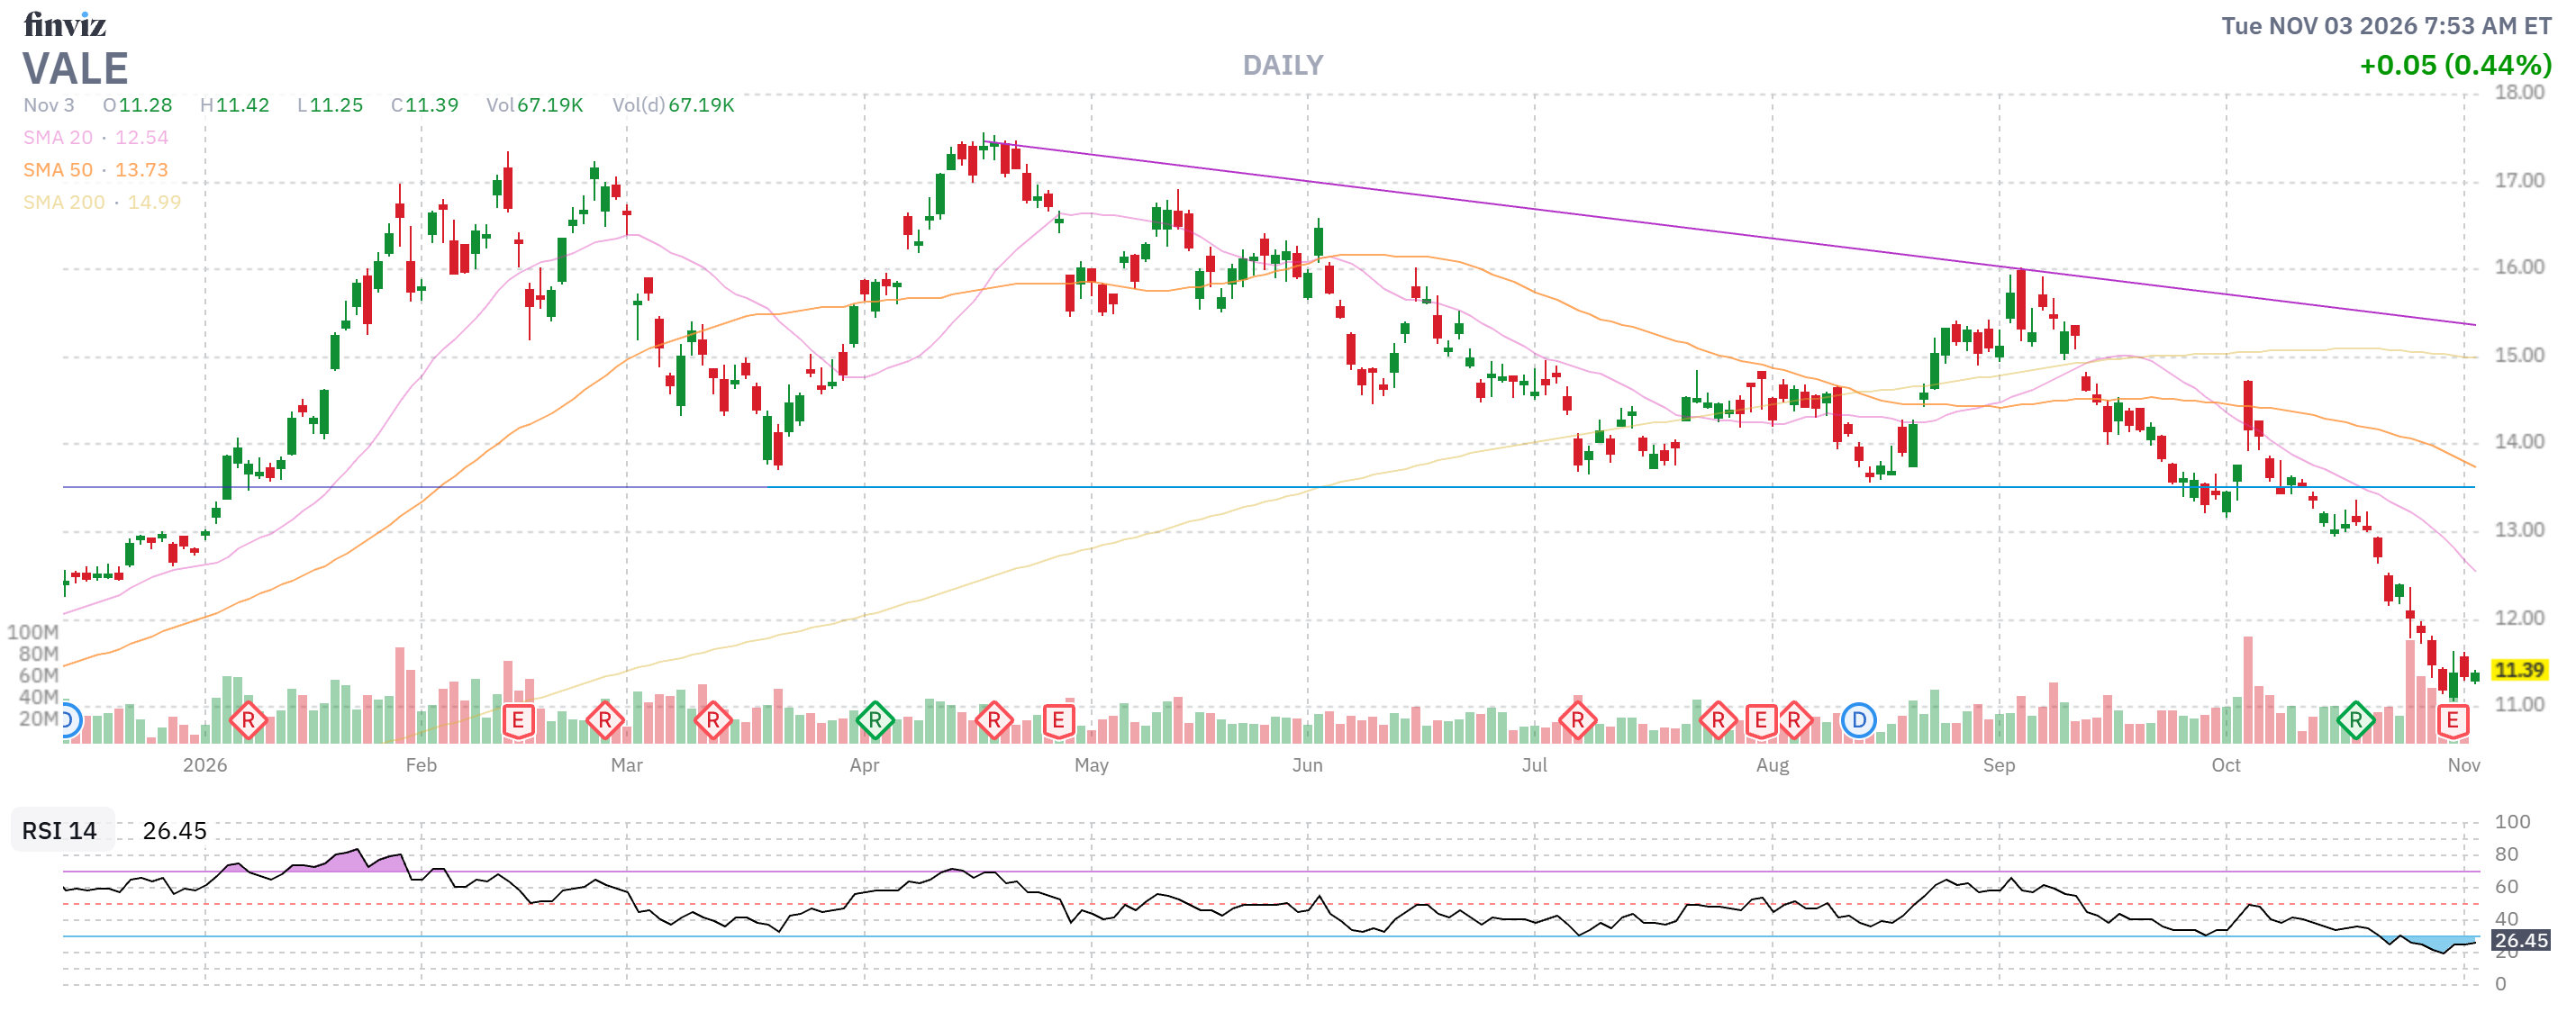
- VALE – Brand new trade with $1,290 (73%) upside potential plus we intend to sell short-term premium once VALE moves up but this earnings report was disappointing, so we’ll have to be patient.
-
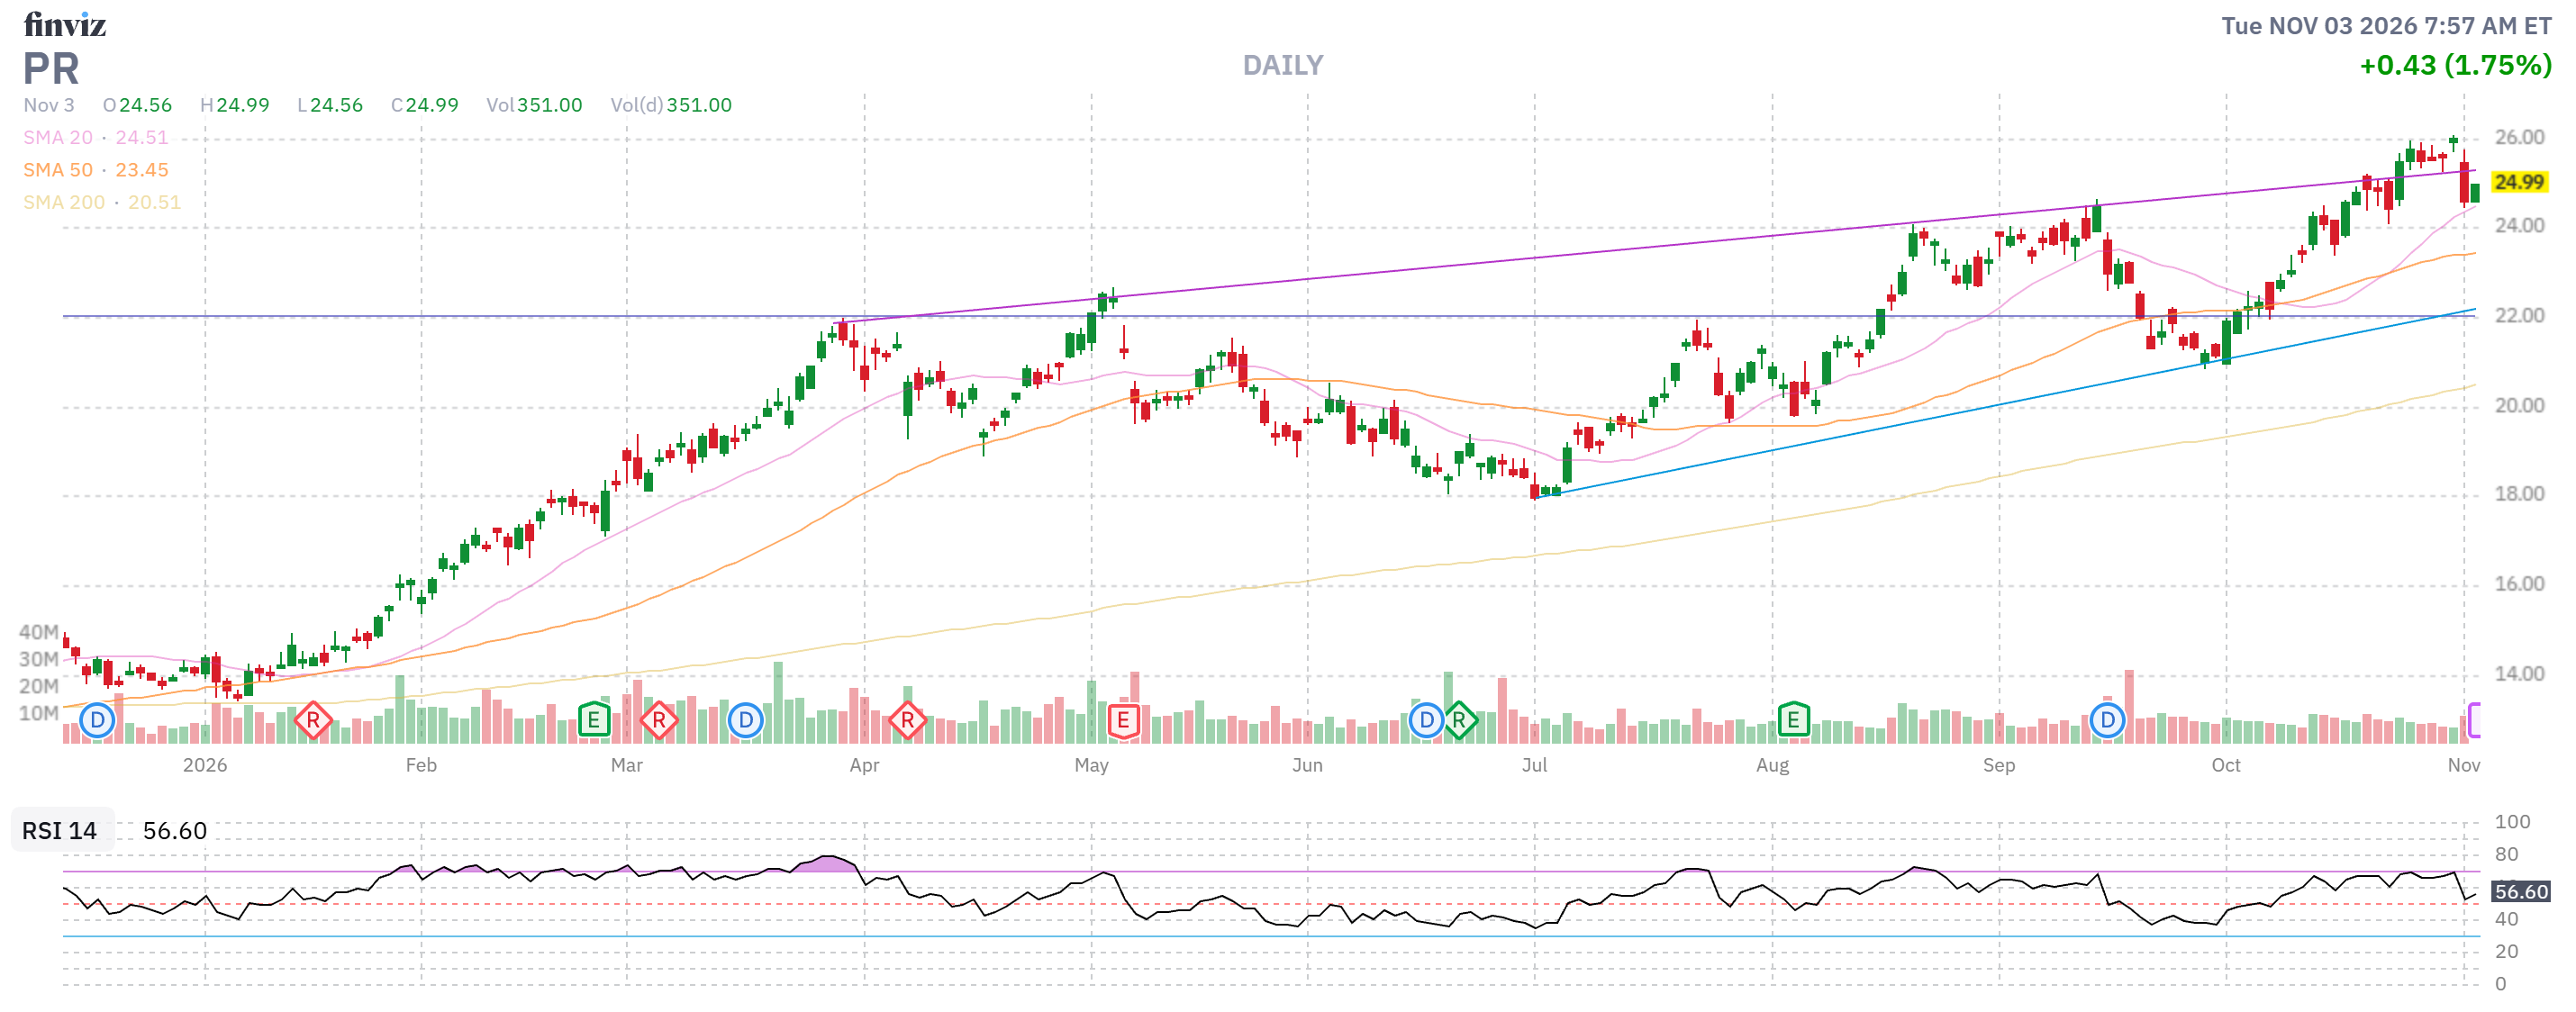
- PR – Well in the money at net $2,750 but we only paid $1,075 for it so we’re up $1,675 (155%) so there’s no sense in trying to milk it – CASH IT OUT!
-
- HPQ – Earnings were fantastic but they got caught up in the sell-off. Fortunately we had the short calls to protect us but the spread is at net $6,637 and up $4,287 (463%) so can we milk more out of it or is it too risky? We need to roll the short 2028 $23s up in strike and the long 2028 $18s are wastefully deep in the money, so let’s:
-
- Roll 15 2028 $18 calls ($18,075) to 25 2029 $25 calls at $9.50 ($23,750)
- Sell 10 2028 $37 calls at $6 ($6,000)
- Roll 5 (half) short 2028 $23 calls ($4,325) to 10 short April $27 calls at $4 ($4,000)
-
- That will be net $0 spent and we have re-initialized our income engine with 7 quarters left to sell let’s say $3,000 for net $21,000 (316%) in potential premium sales on what is still a net $6,637 spread which will pay out $30,000 at $37 for another potential $23,363 (352%) upside potential. Do I even have to tell you this is Good for a New Trade?
- HPQ – Earnings were fantastic but they got caught up in the sell-off. Fortunately we had the short calls to protect us but the spread is at net $6,637 and up $4,287 (463%) so can we milk more out of it or is it too risky? We need to roll the short 2028 $23s up in strike and the long 2028 $18s are wastefully deep in the money, so let’s:
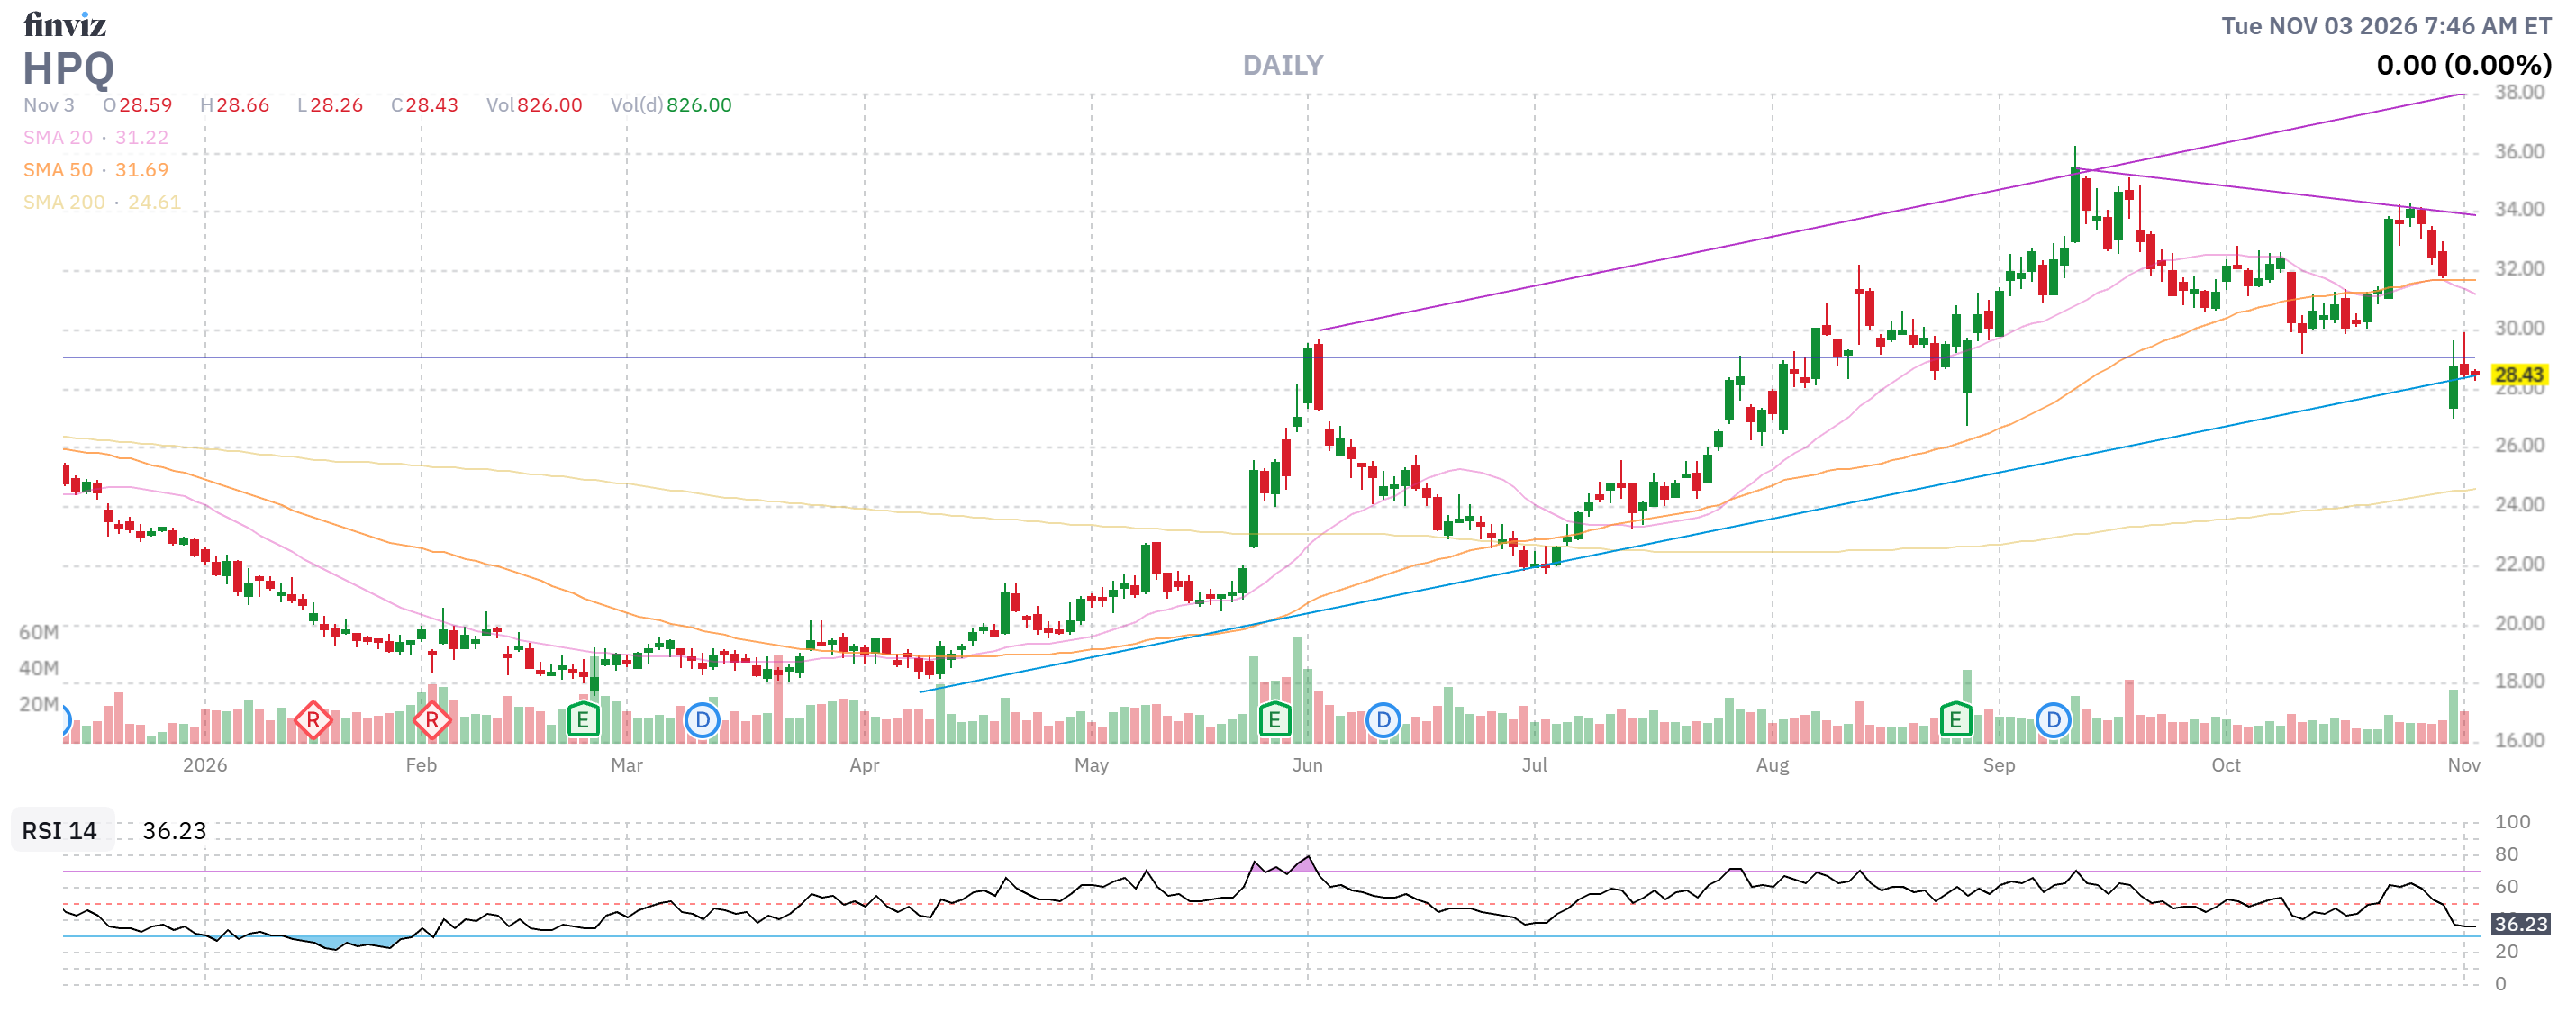
With trades like this, you can see how we can average 95.5% a year! And it doesn’t use any margin!!! You can also see how HPQ is a great place to deploy our CASH!!! vs holding it in something like PR – which has already exceeded our expectations.
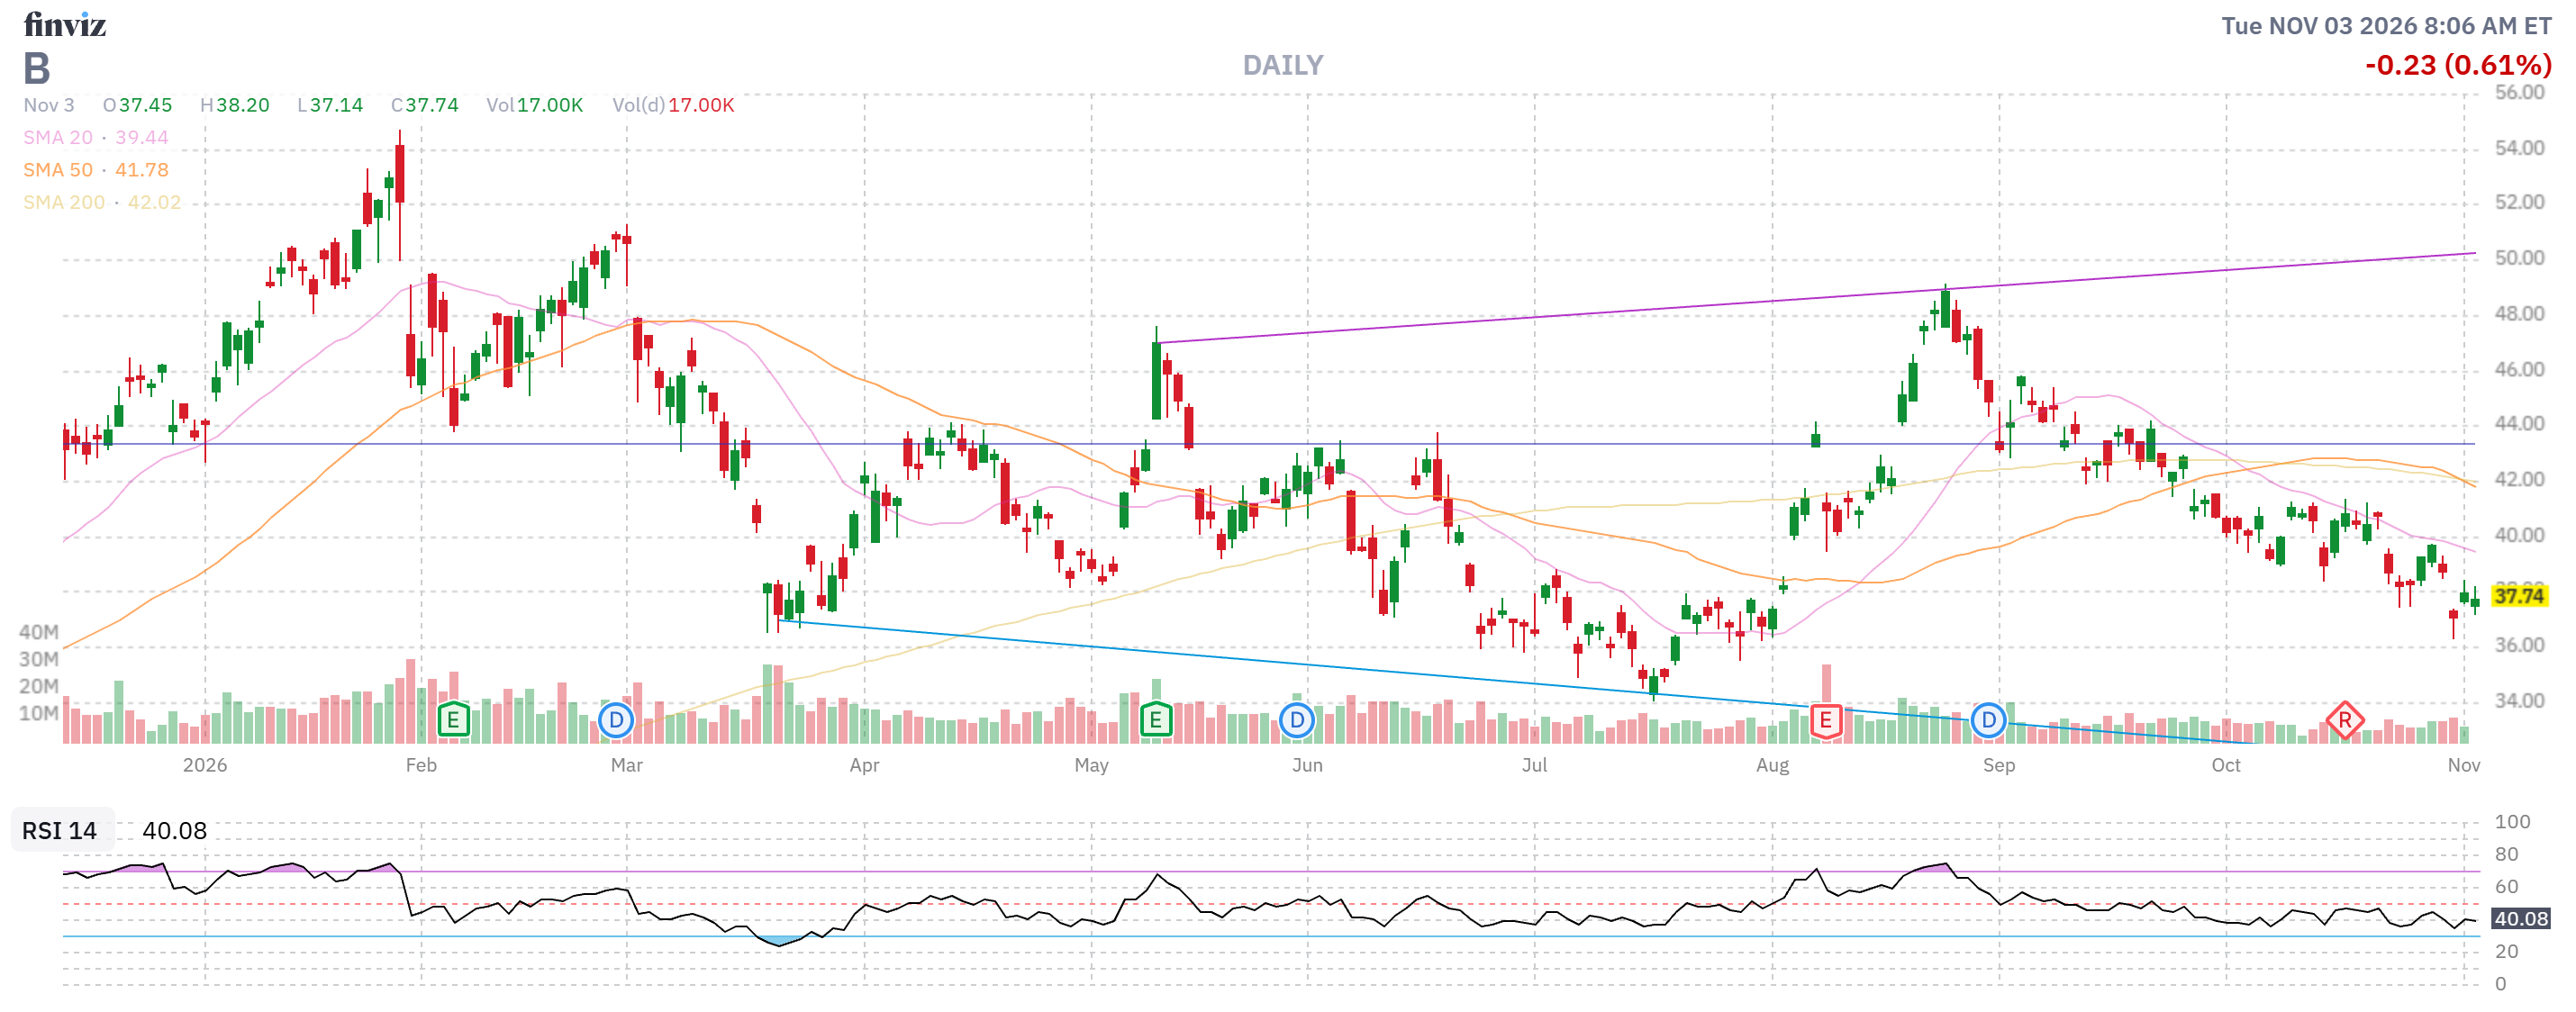
B – Fantastic that the short Dec $45s are expiring worthless but let’s cash out the whole spread and take $4,769 off the table and recast it as:
-
-
-
- Buy 15 B 2029 $30 calls for $12.75 ($19,125)
- Sell 10 B 2029 $45 calls for $7.50 ($7,500)
- Sell 5 B March $39 calls for $3.50 ($1,750)
-
-
That’s net $9,875, deploying net $5,112 of new money on the $13,500 spread that’s mostly in the money so there’s $3,625 (36.7%) upside potential PLUS 7 more chances to sell, let’s say $1,500 is another potential $10,500 (106%) in premium sales.
-
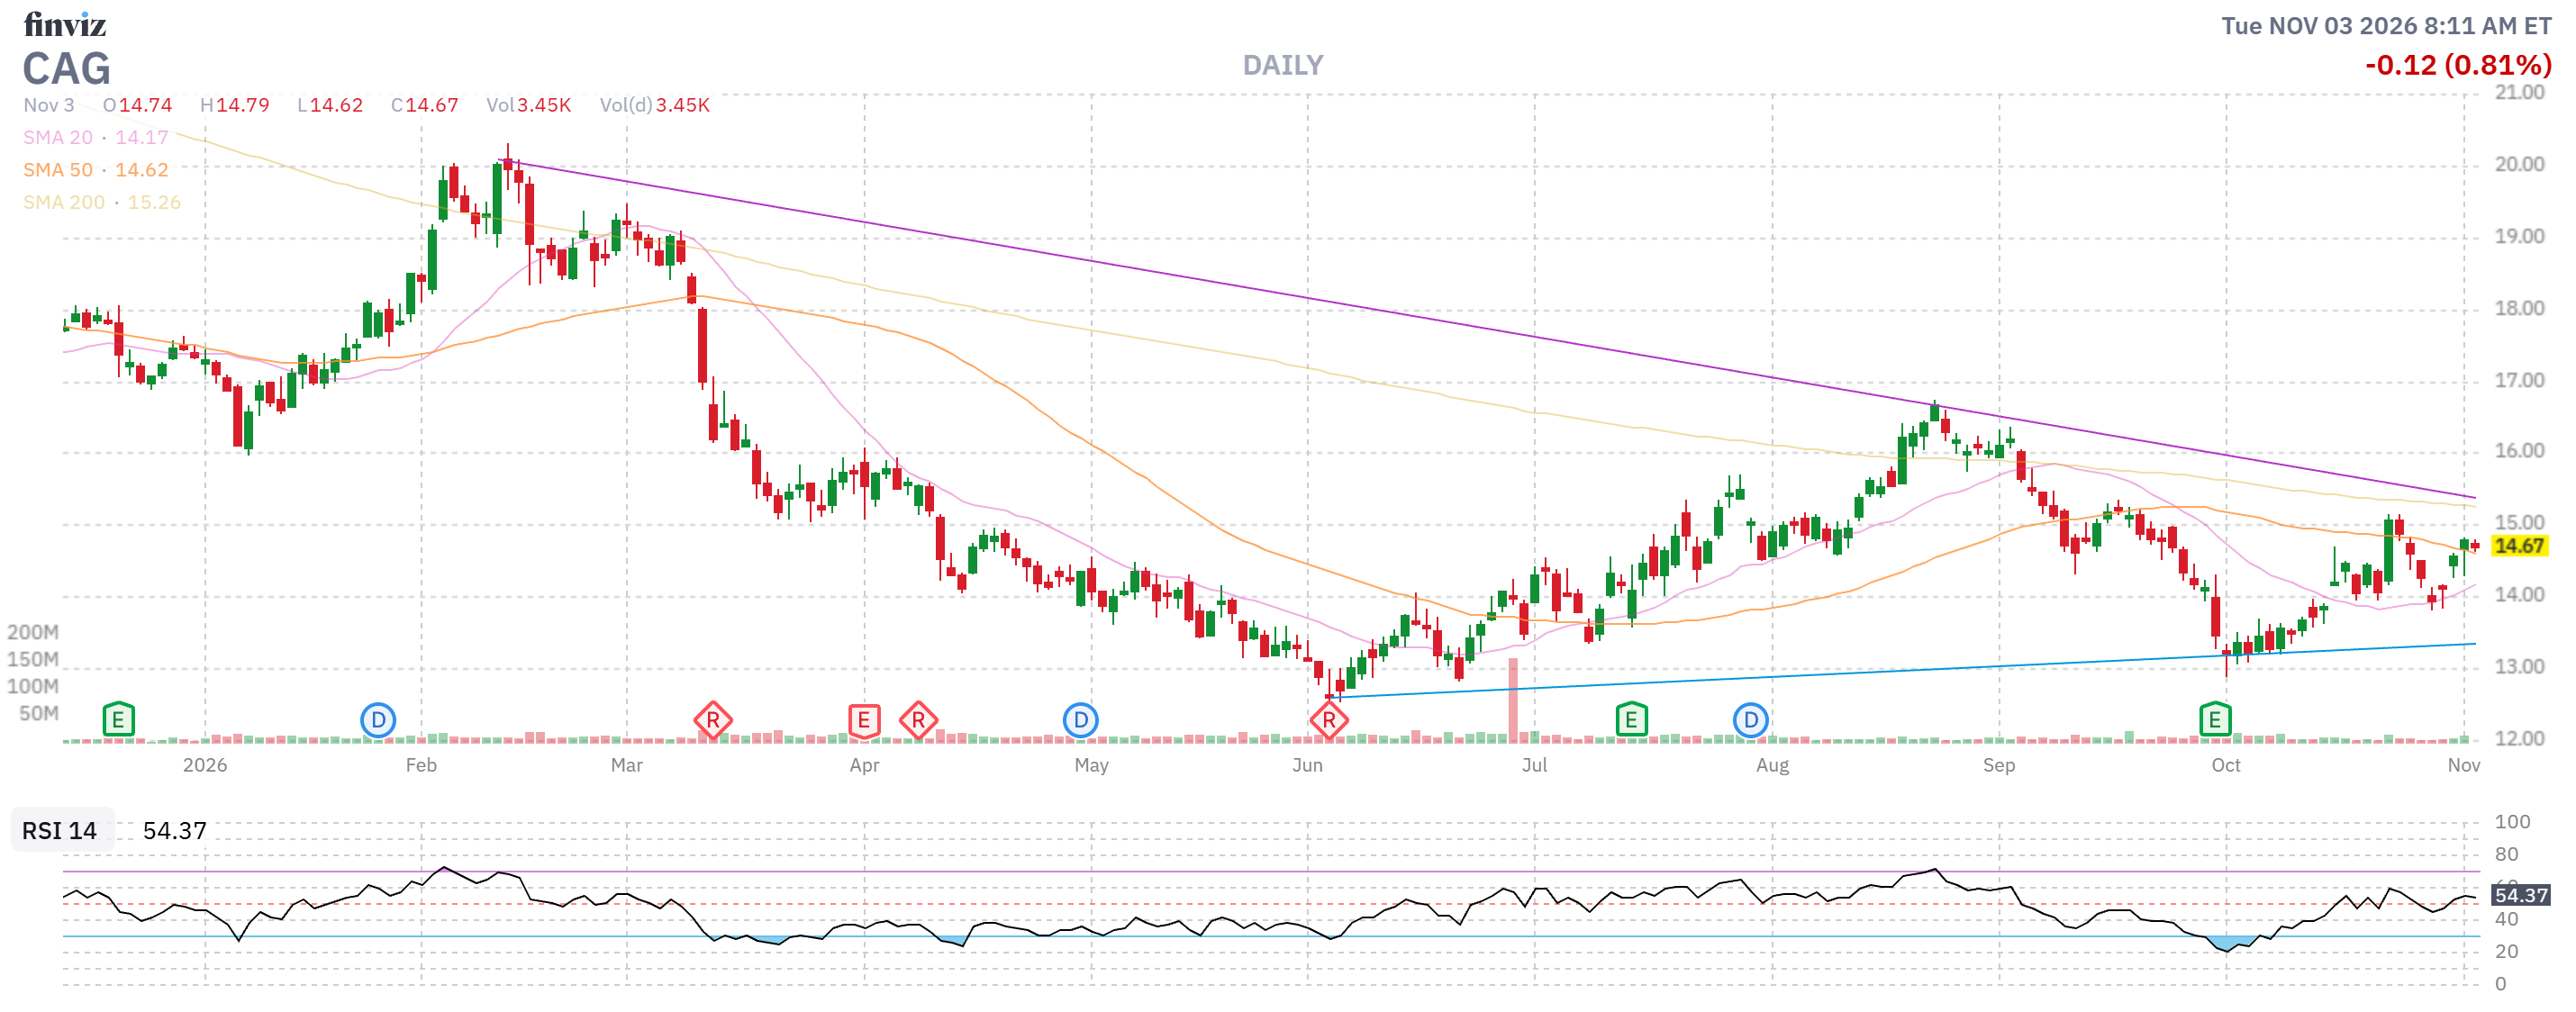
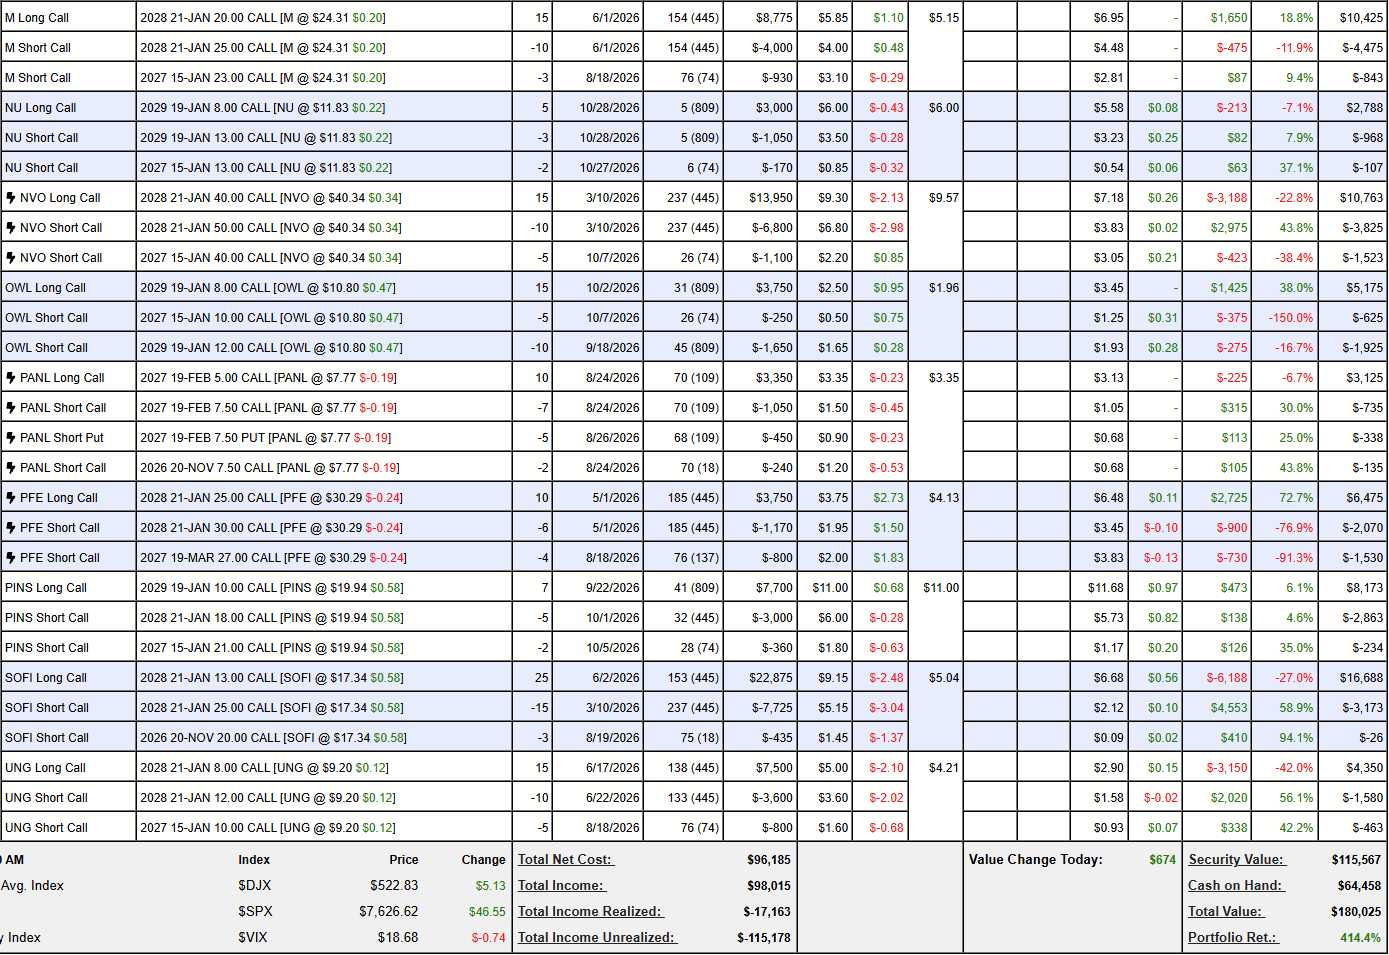
- CAG – Right on track at net $2,825 on the $6,000 spread so we have $3,175 (112%) upside potential PLUS 3 more chances to sell $800 for another $2,400 (85%) premium sales potential. Earnings were great so still Good for a New Trade!
-
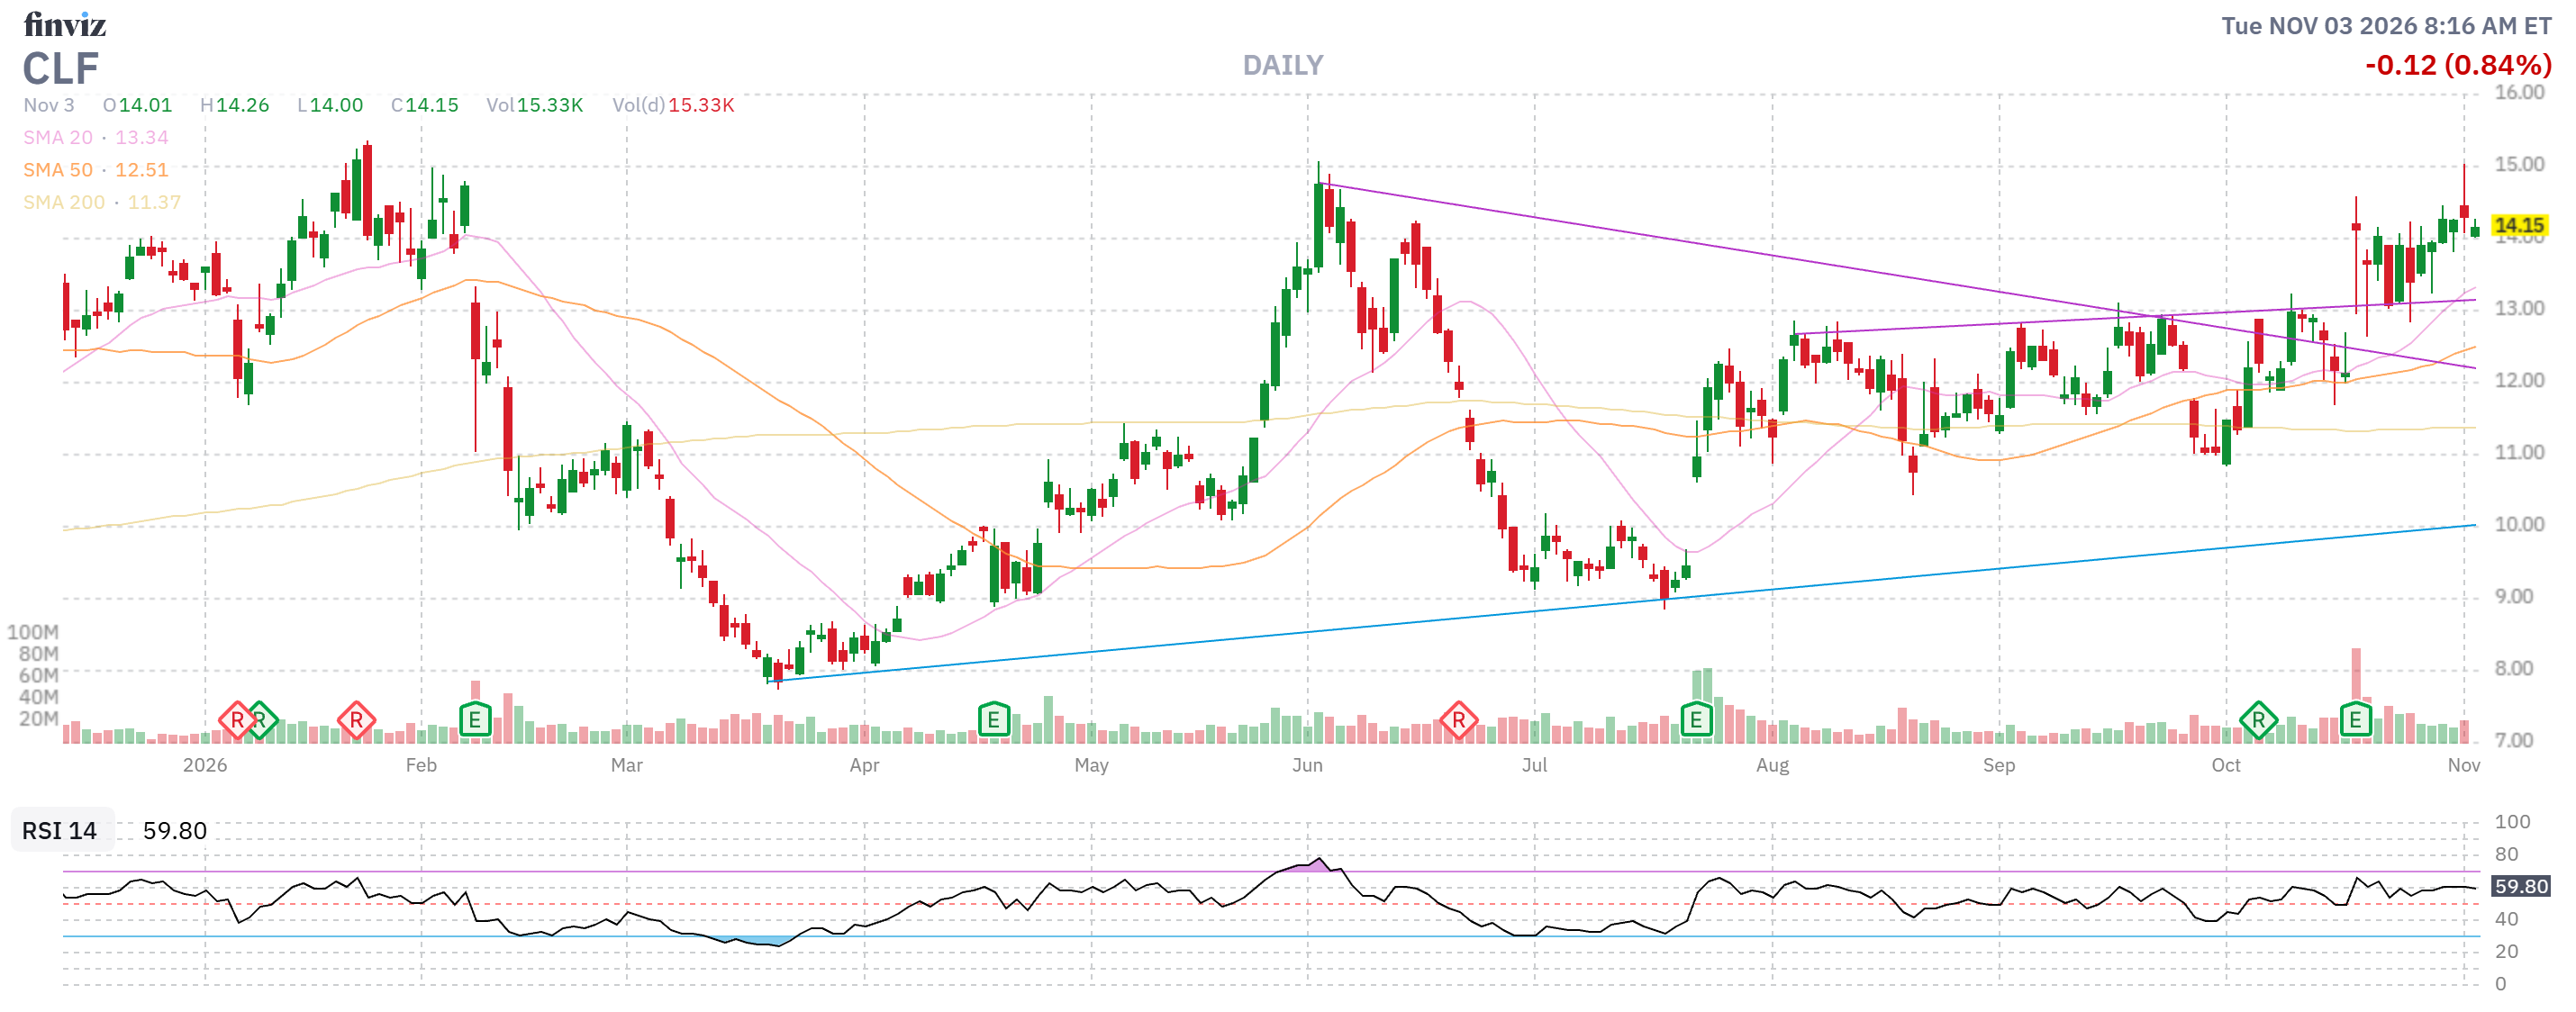
- CLF – We’ll have to roll the short calls but no worries as the 2028 $22s are $2.10 – so that’s our ultimate roll target for a $10(ish) spread of $15,000 and we’re only at net $272 and $3,000 in the money so GREAT for a New Trade!!! with $14,728 (5,414%) of upside potential at $22 PLUS 4 more chances to sell $2,250 in premium is $9,000 (3,308%) of potential premium sales! We probably won’t make $22 but our break-even is $10.27 – so I think this will work out great…
-
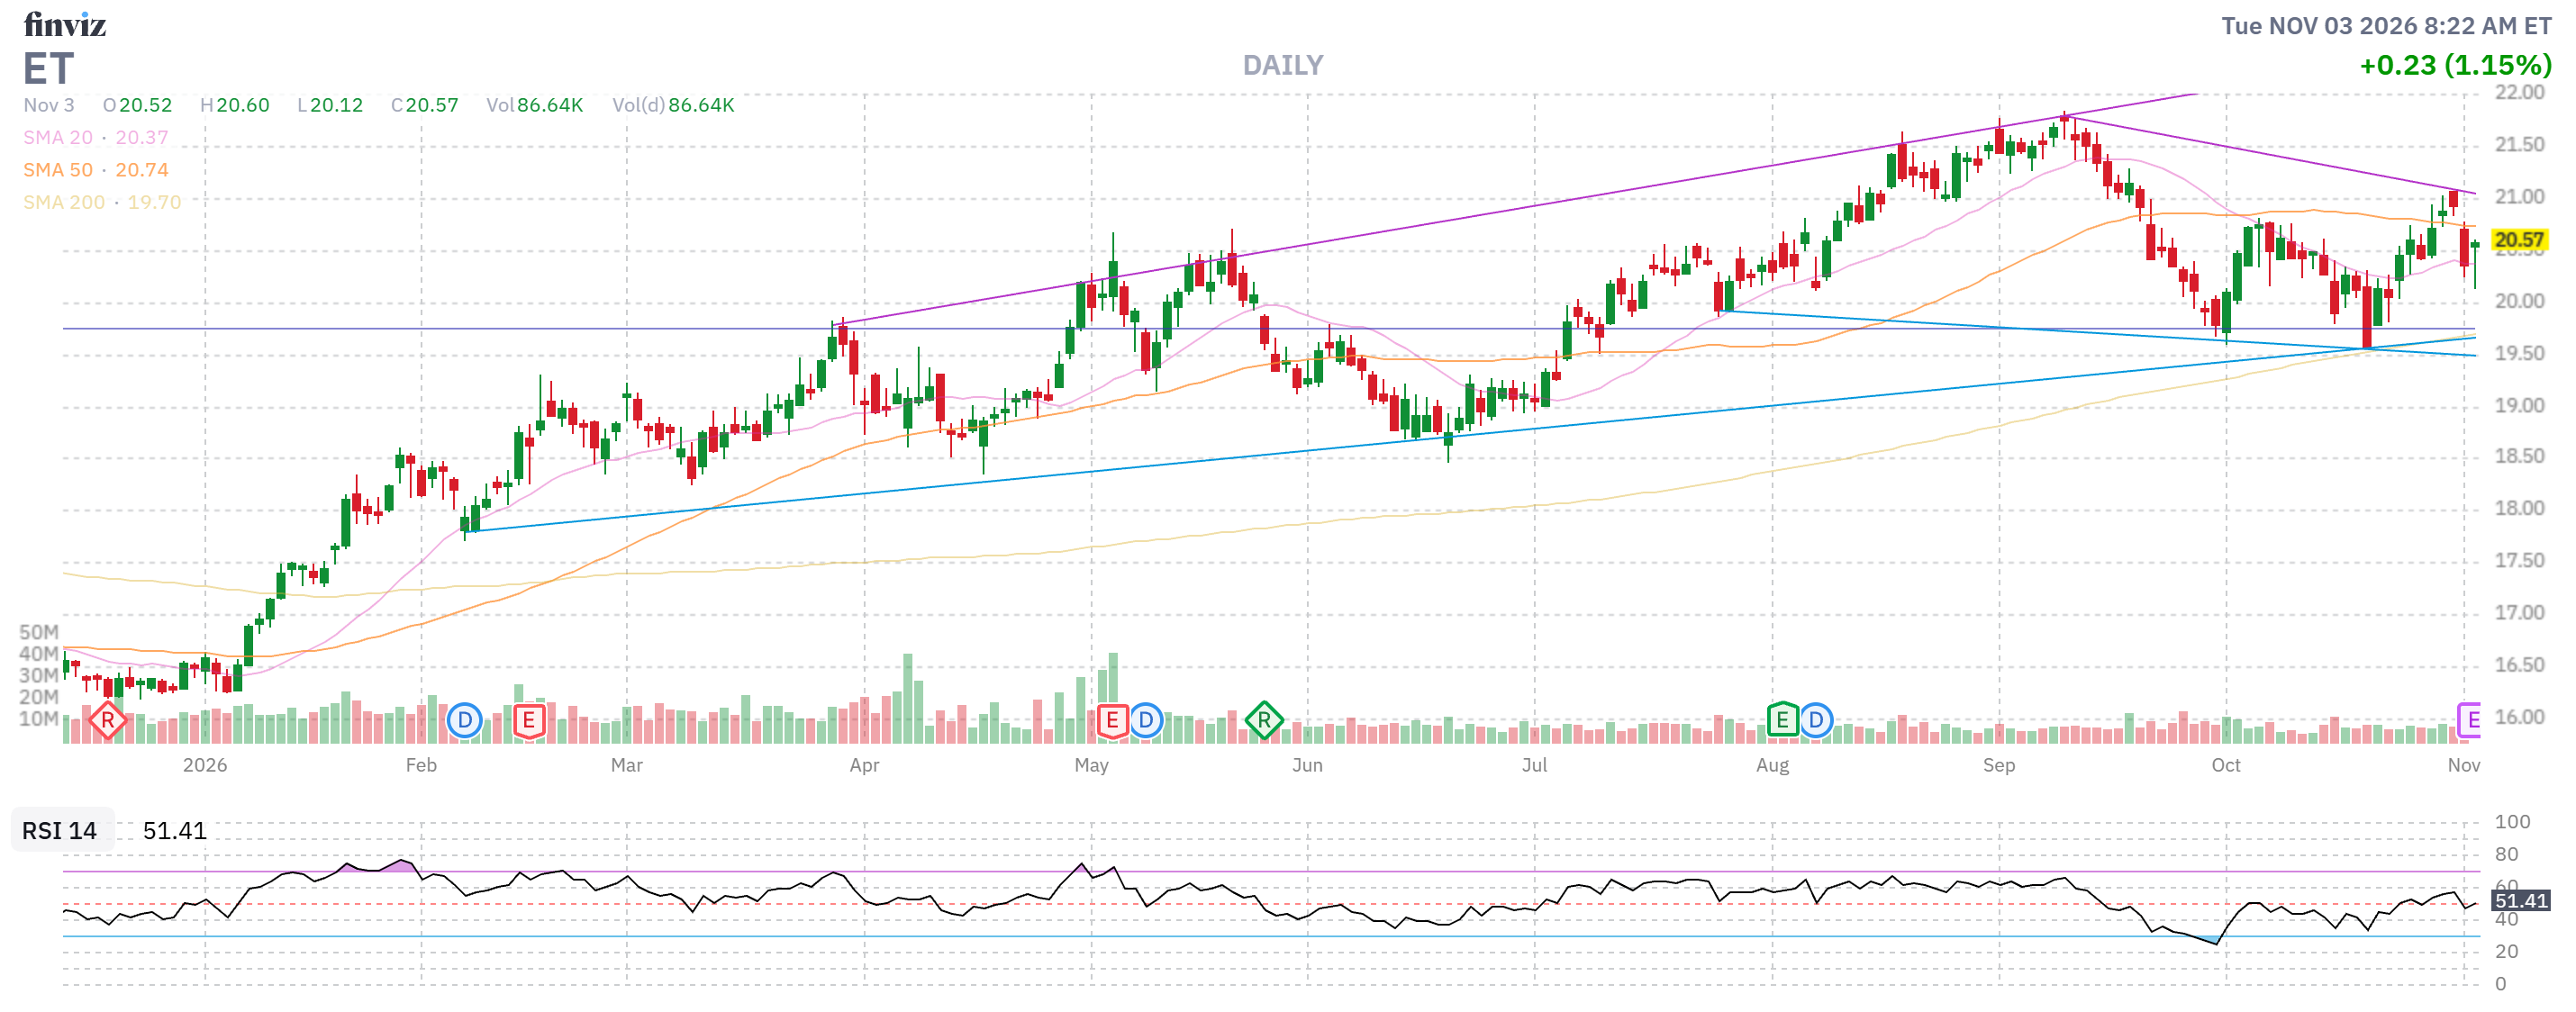
- ET – Net $2,403 is already up $953 (65.7%) in 6 months and we’re not even counting previously collected premiums (we never do – it’s in the portfolio’s cash pile). It’s a potential $3,000 spread and now at the money with just $597 (24.8%) left to gain and that, by itself, is a fish we throw back but $1,200 in potential premium sales is another 50% and it’s a nice, steady income – so we’ll hang on to it for now.
-
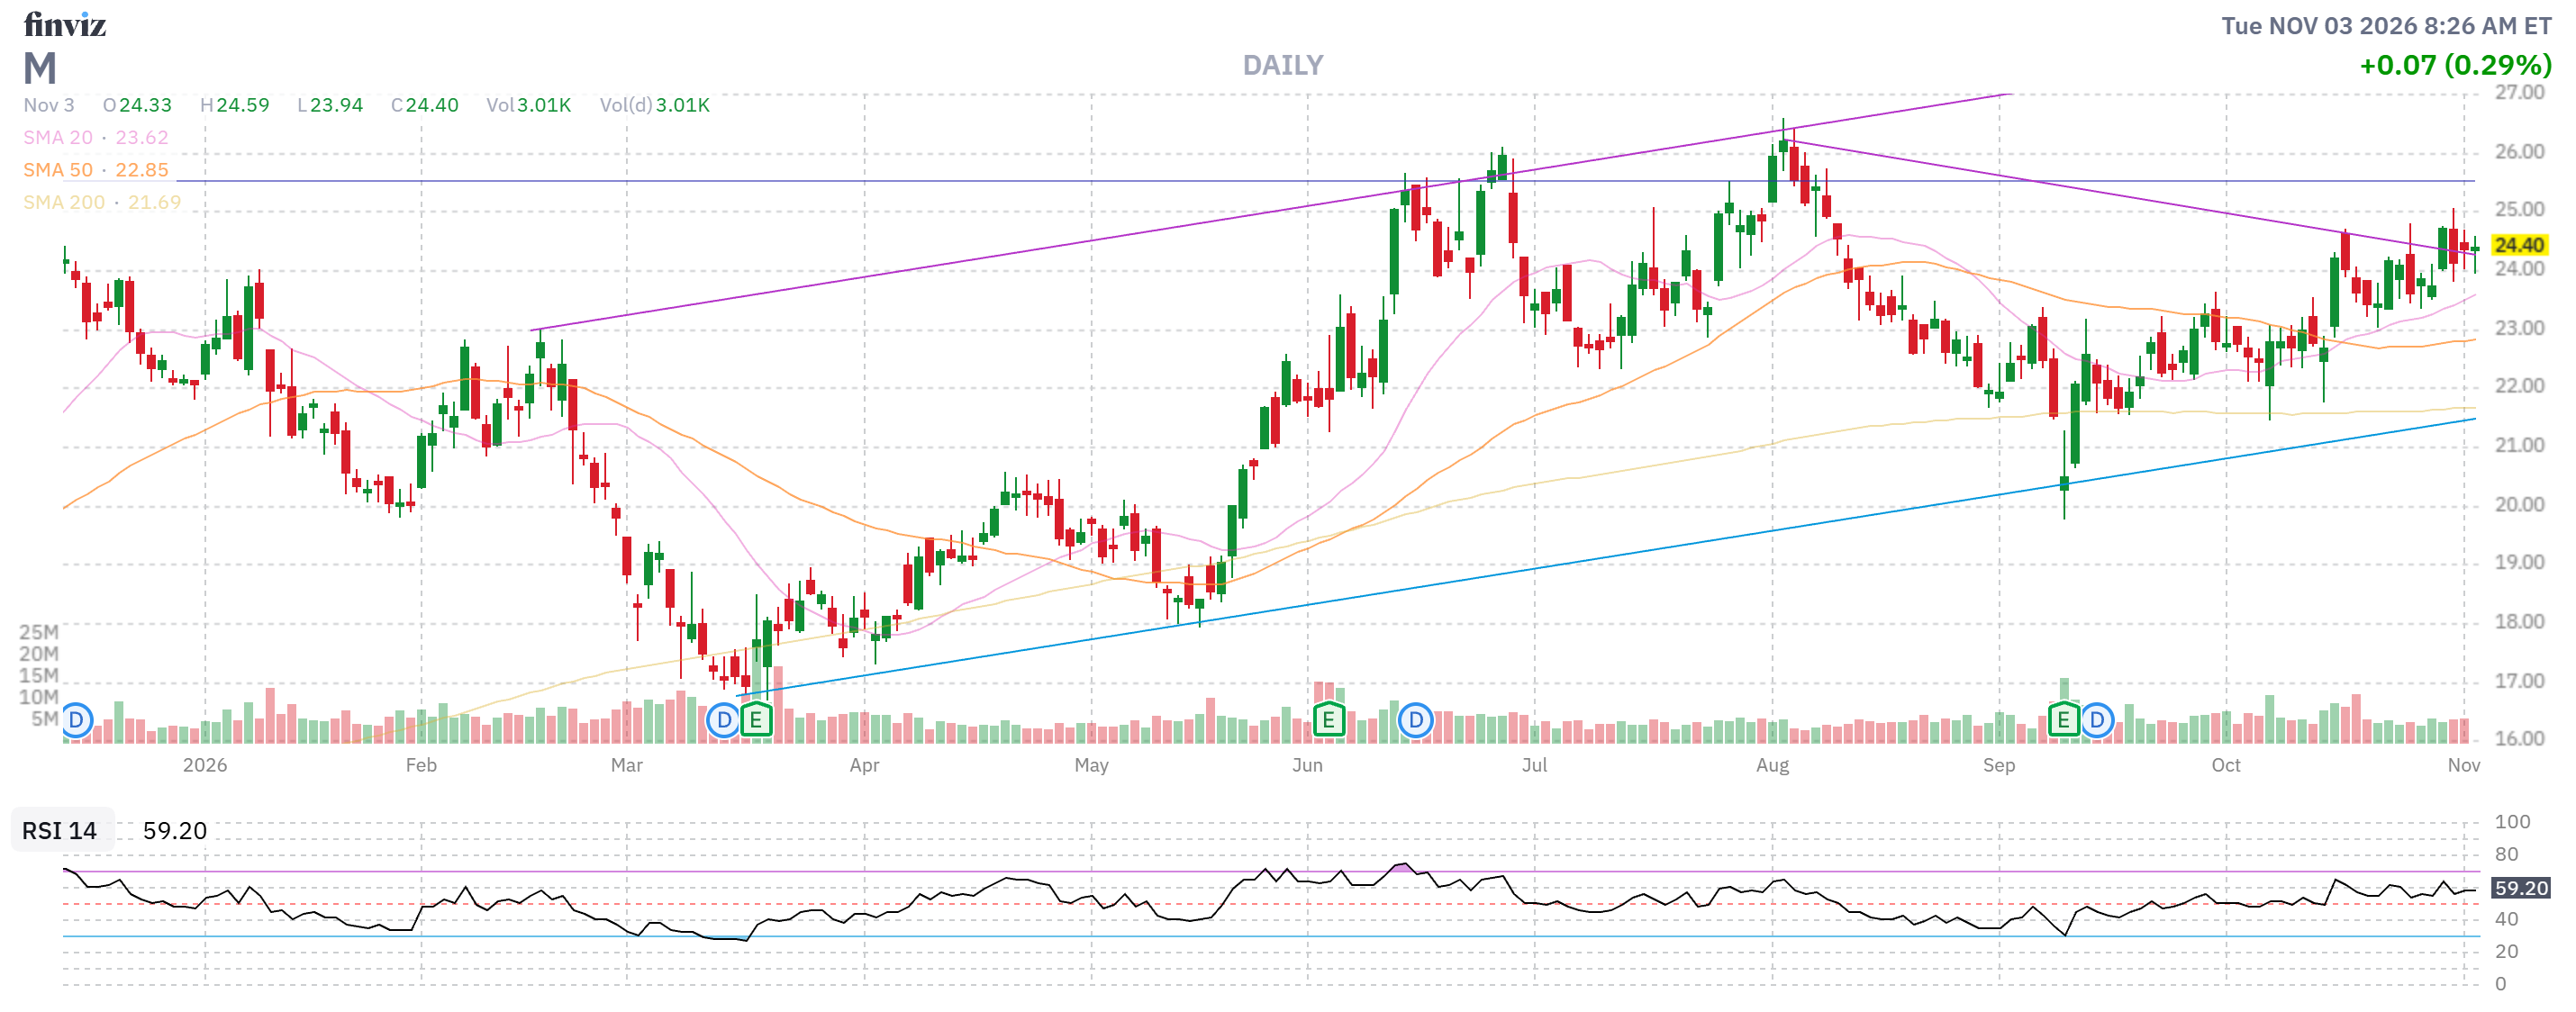
- M – Net $5,065 on the $7,500 spread that’s at the money has $2,435 (48%) upside potential PLUS 3 more chances to sell $930 in premium is $2,790 (55%) additional potential and that makes it a keeper and, dare I say: Good for a New Trade!
-
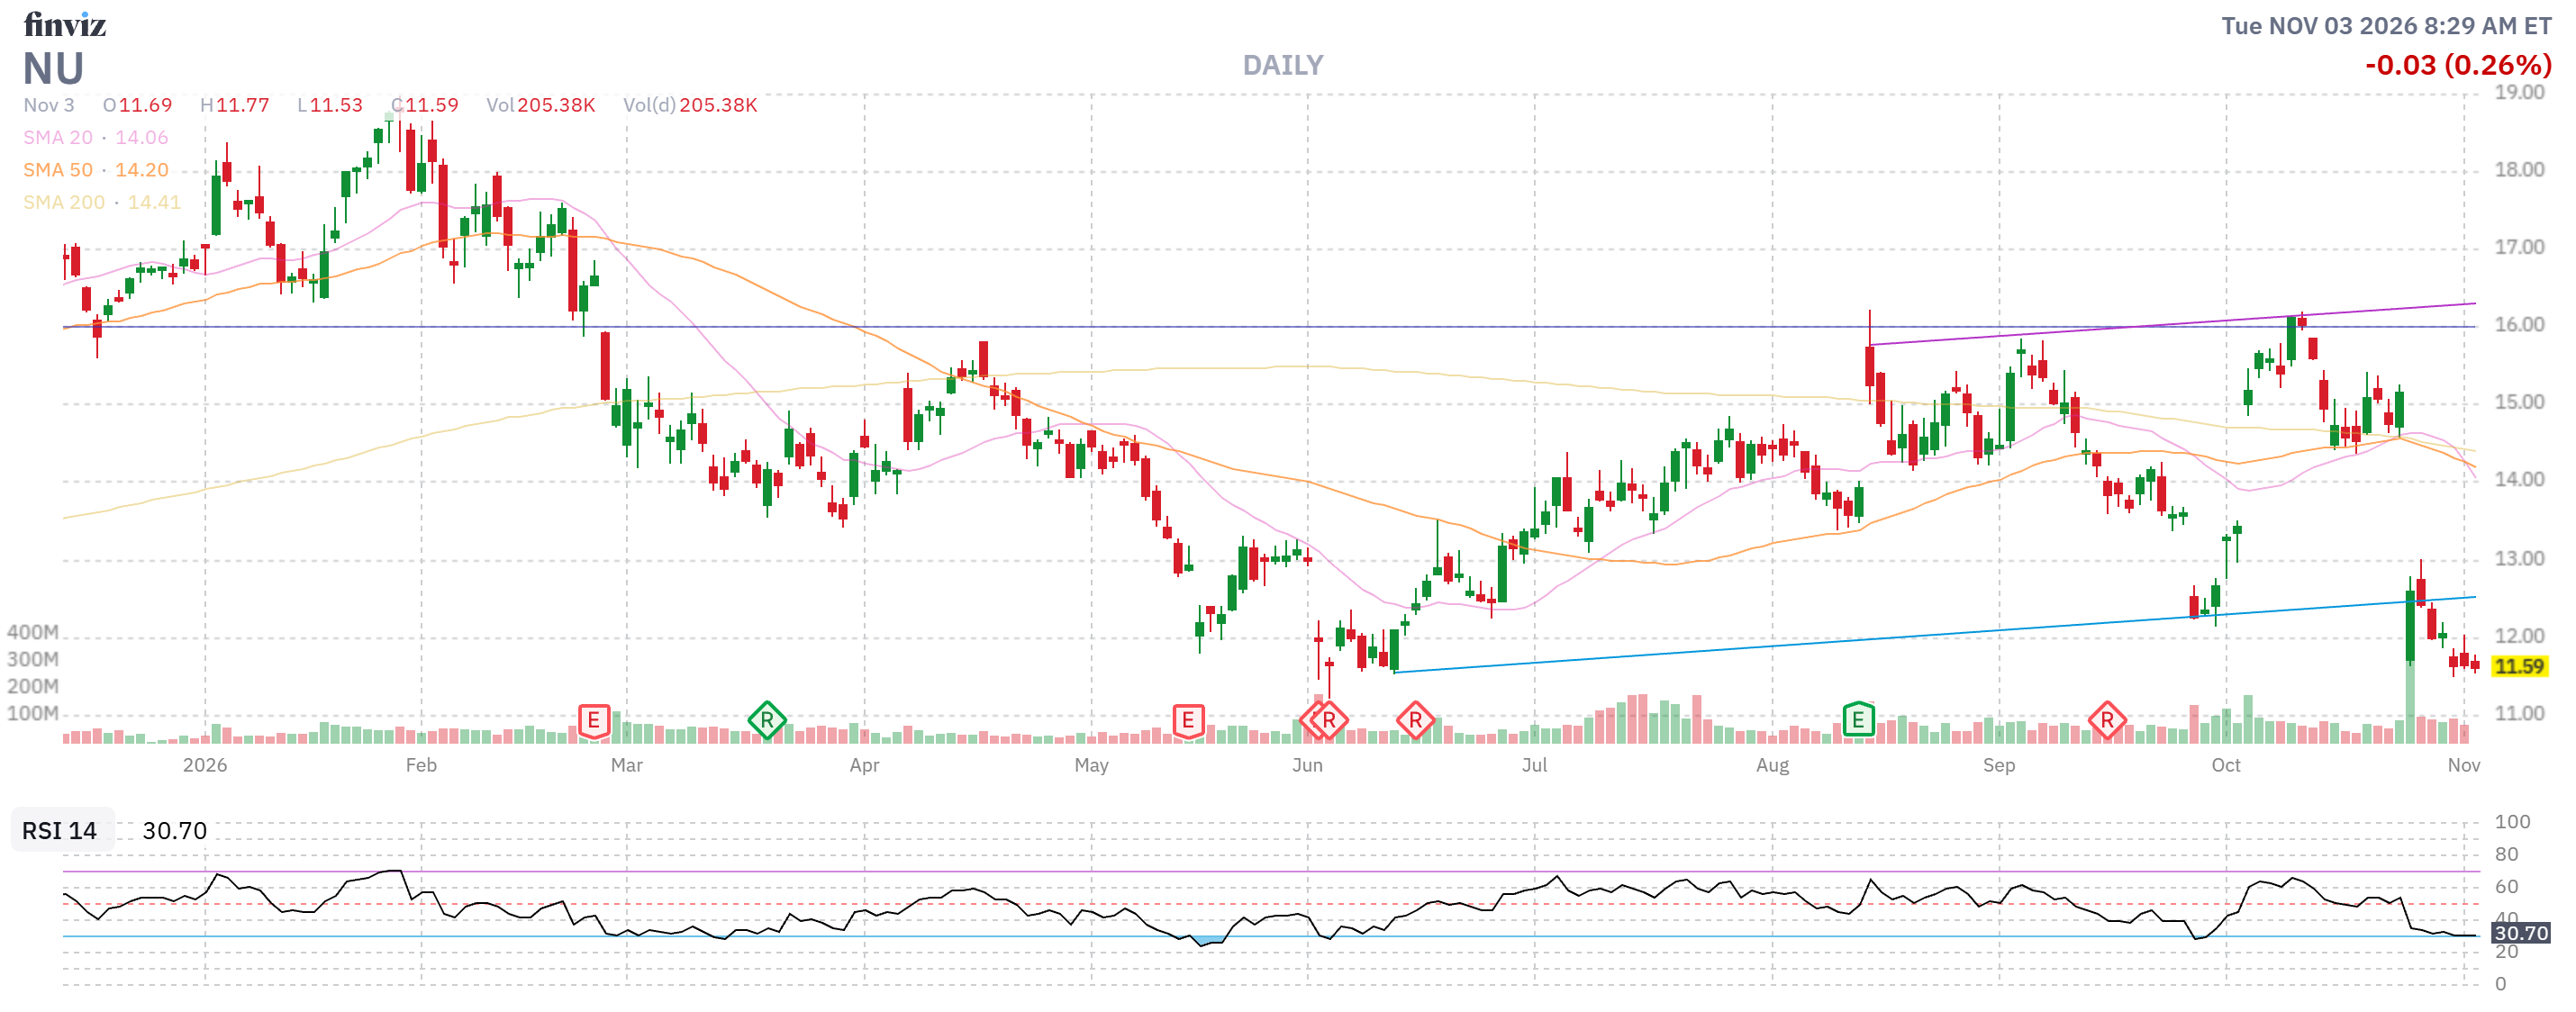
- NU – NU is new and Good for a New Trade at net $1,649 on the $2,500 spread that’s mostly in the money with $851 (51.6%) upside potential PLUS $1,360 (82.4%) in premium sales potential.
-
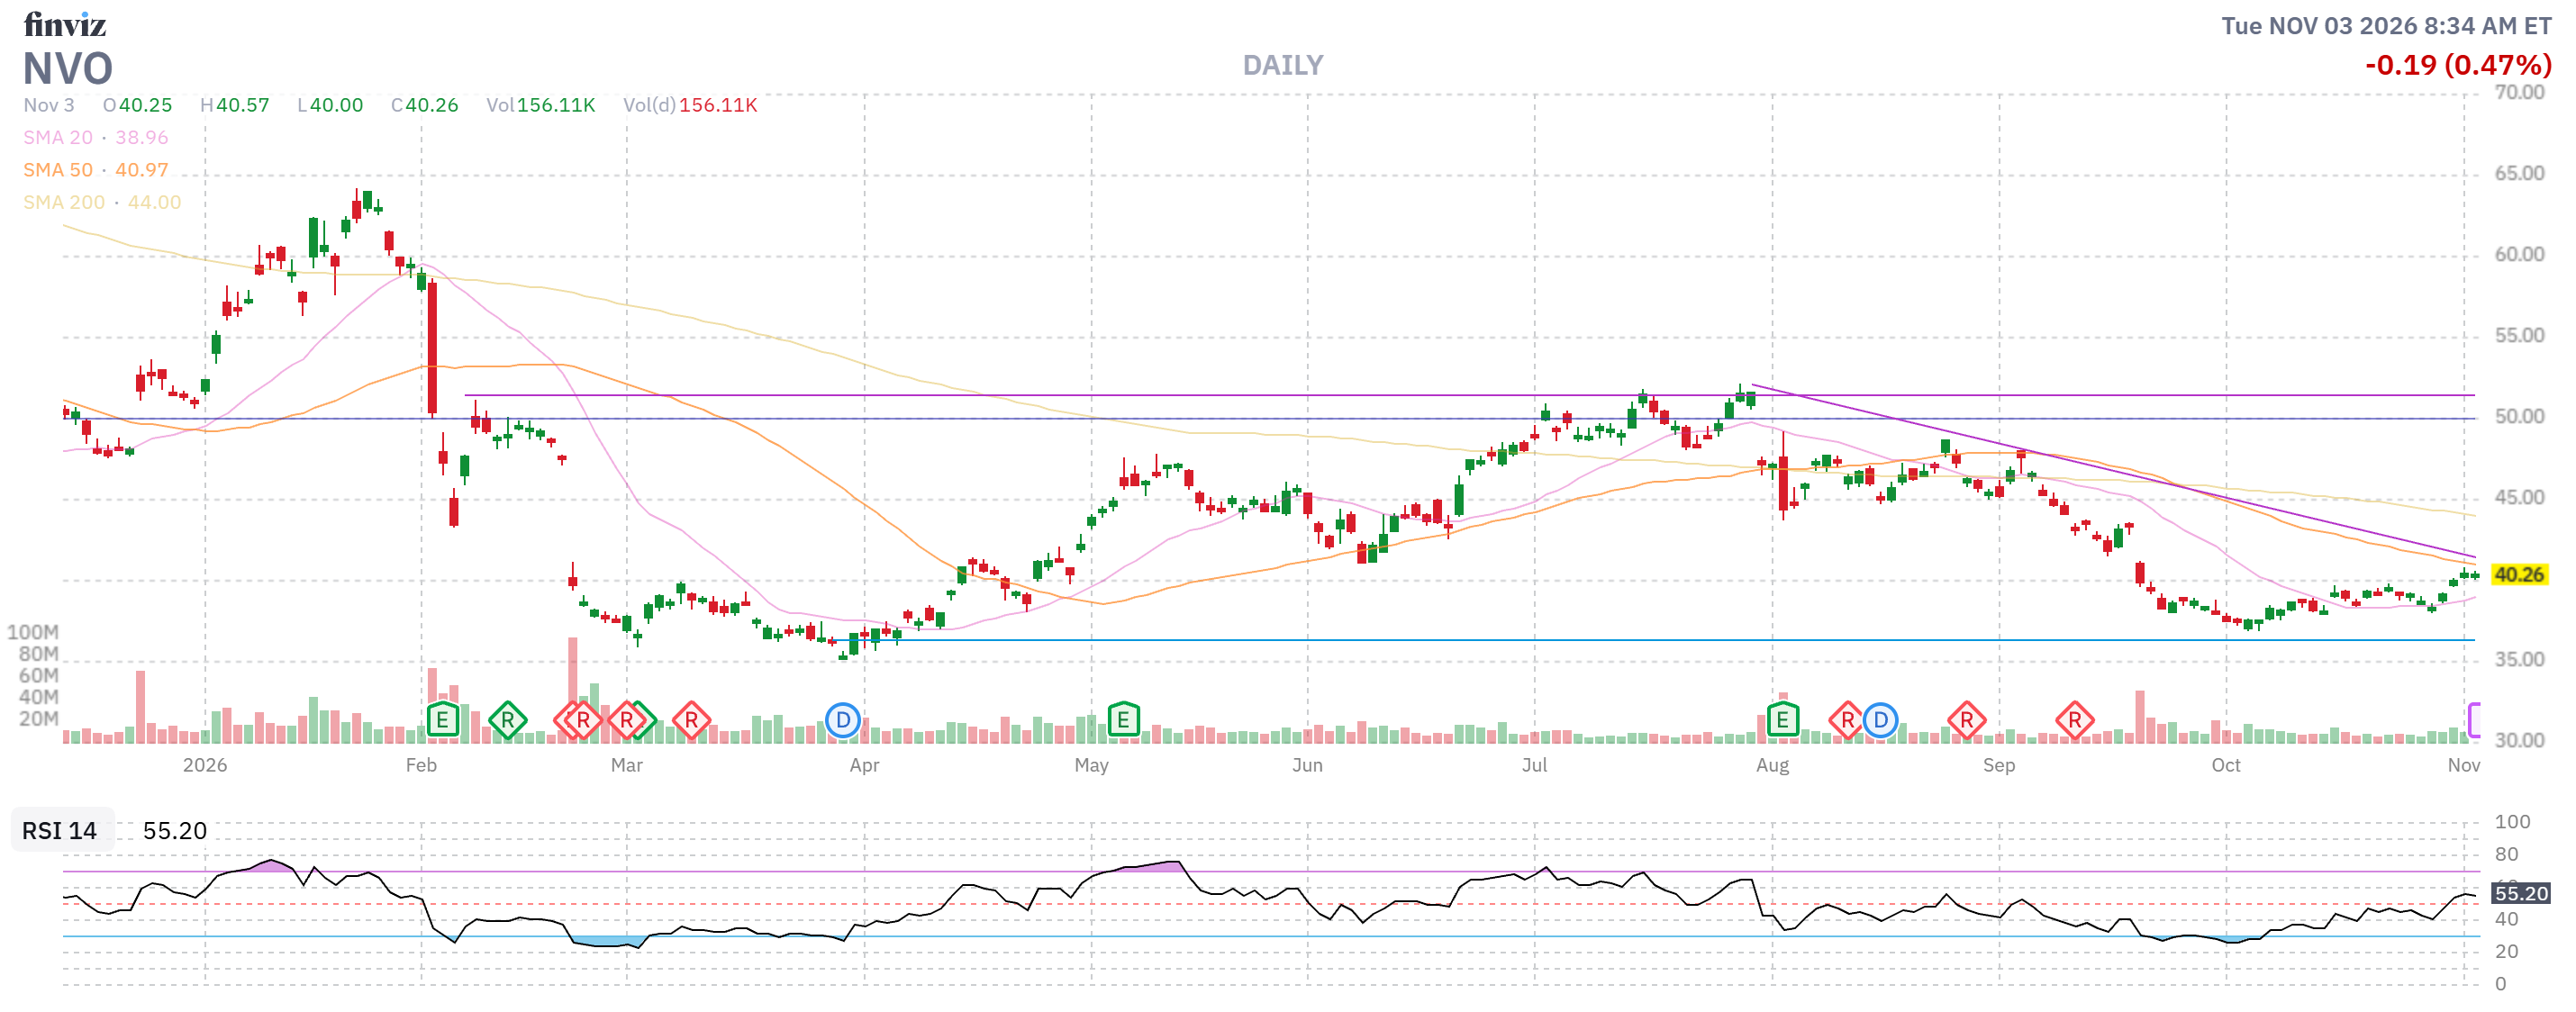
- NVO – Earnings are tomorrow so we’ll see what happens. It’s a potential $15,000 spread at $50 and currently just net $5,463 so there’s $9,537 (174%) upside potential on a 25% gain in the stock PLUS $4,400 (80.5%) in potential premium sales so – Good for a New Trade – but no need to risk earnings.
Aren’t options fun?
-
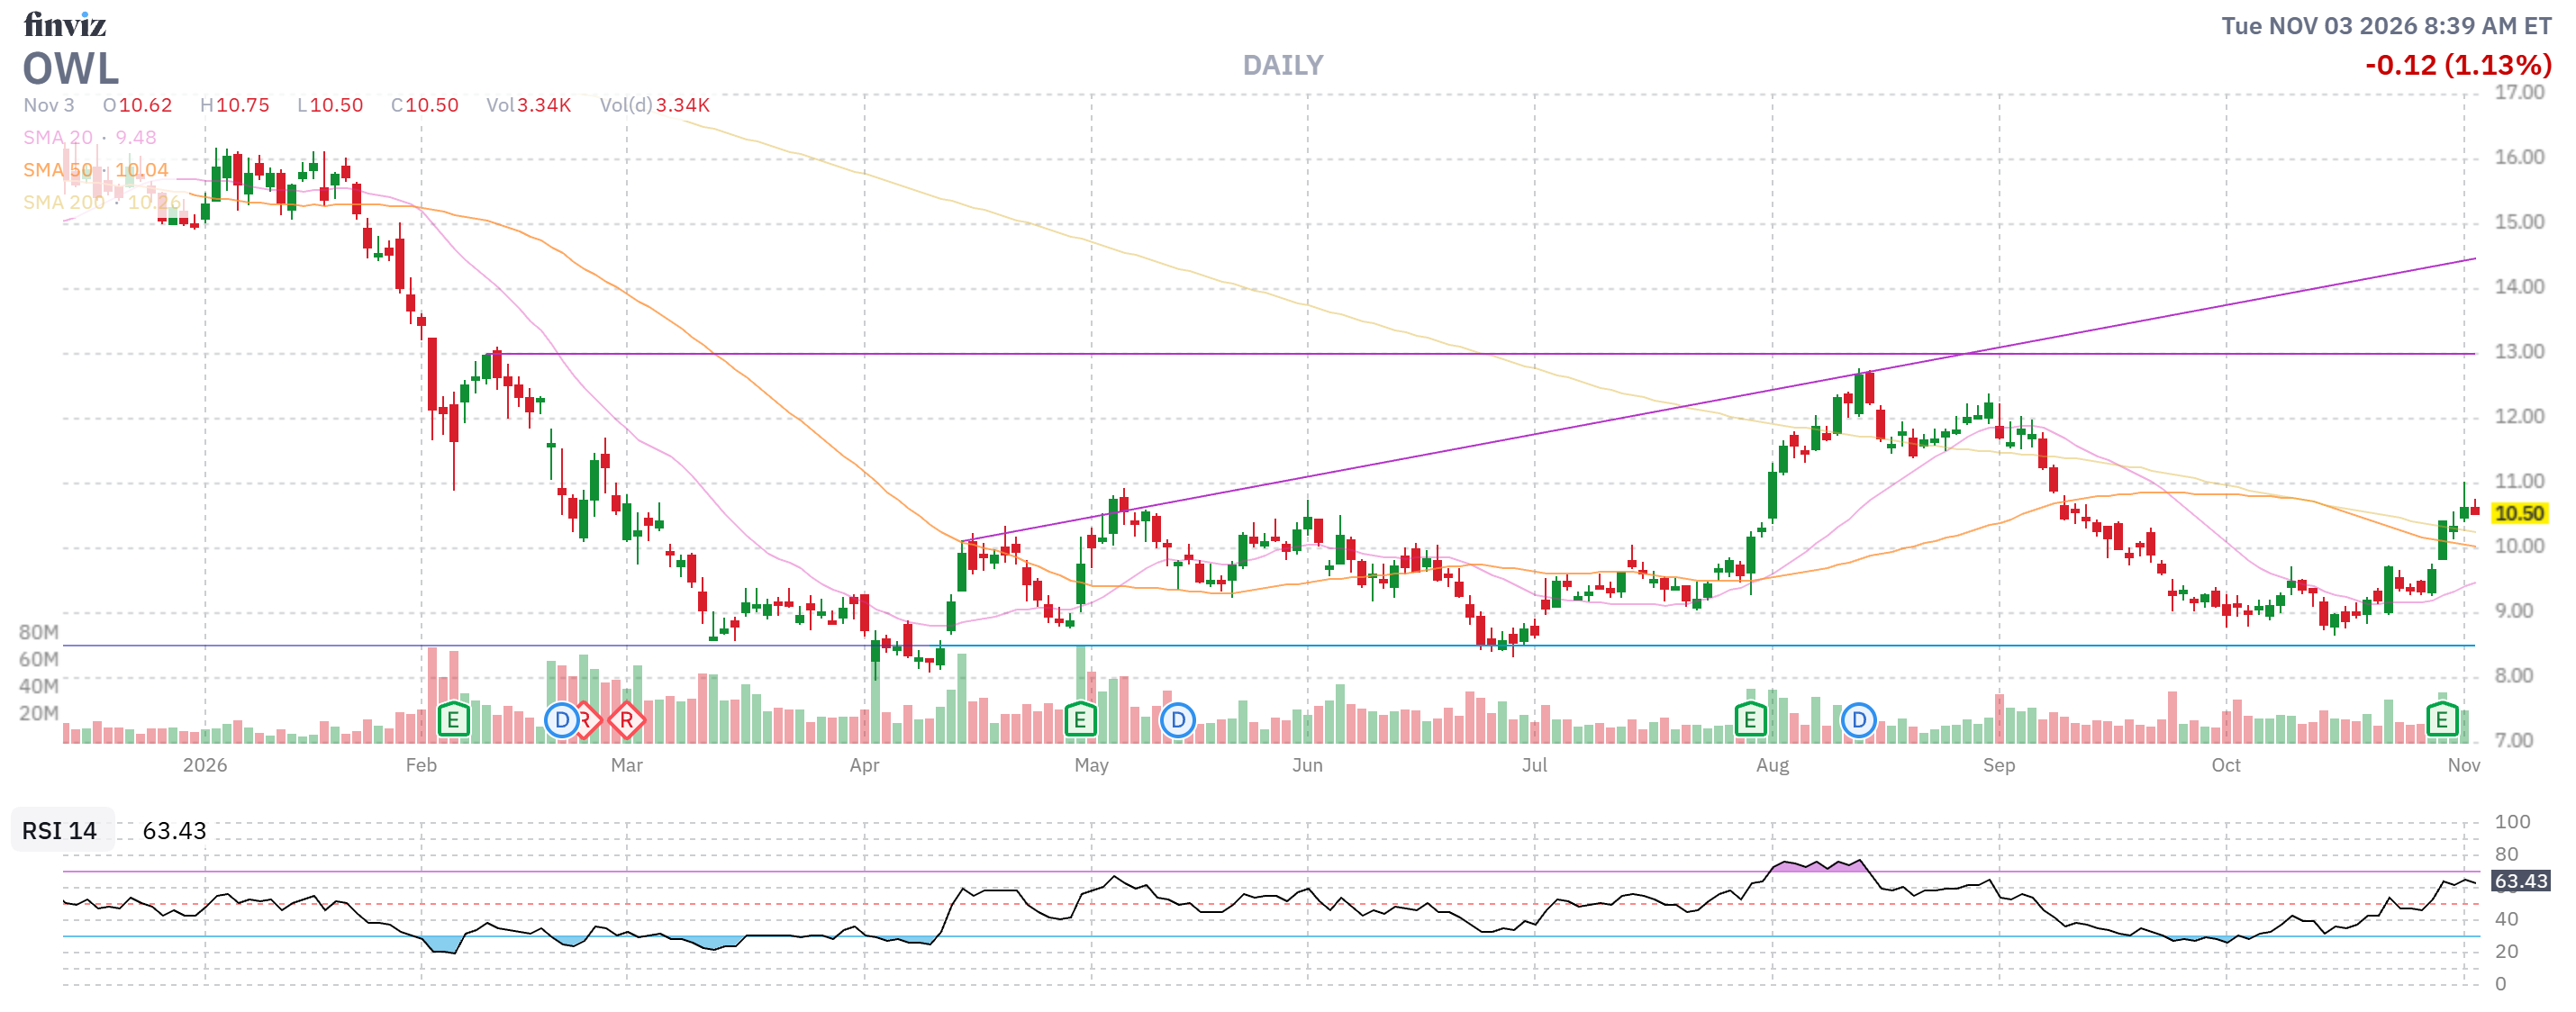
- OWL – Robo John Oliver JUST warned us about them last night, so proceed with caution! We’re at net $2,912 on the $6,000 spread so we have net $3,088 (106%) upside potential PLUS 8 more chances to sell $250 is another $2,000 (68%) in potential premium sales so we’ll hold it for now but NOT safe enough for a new trade (we are already up $1,062).
-
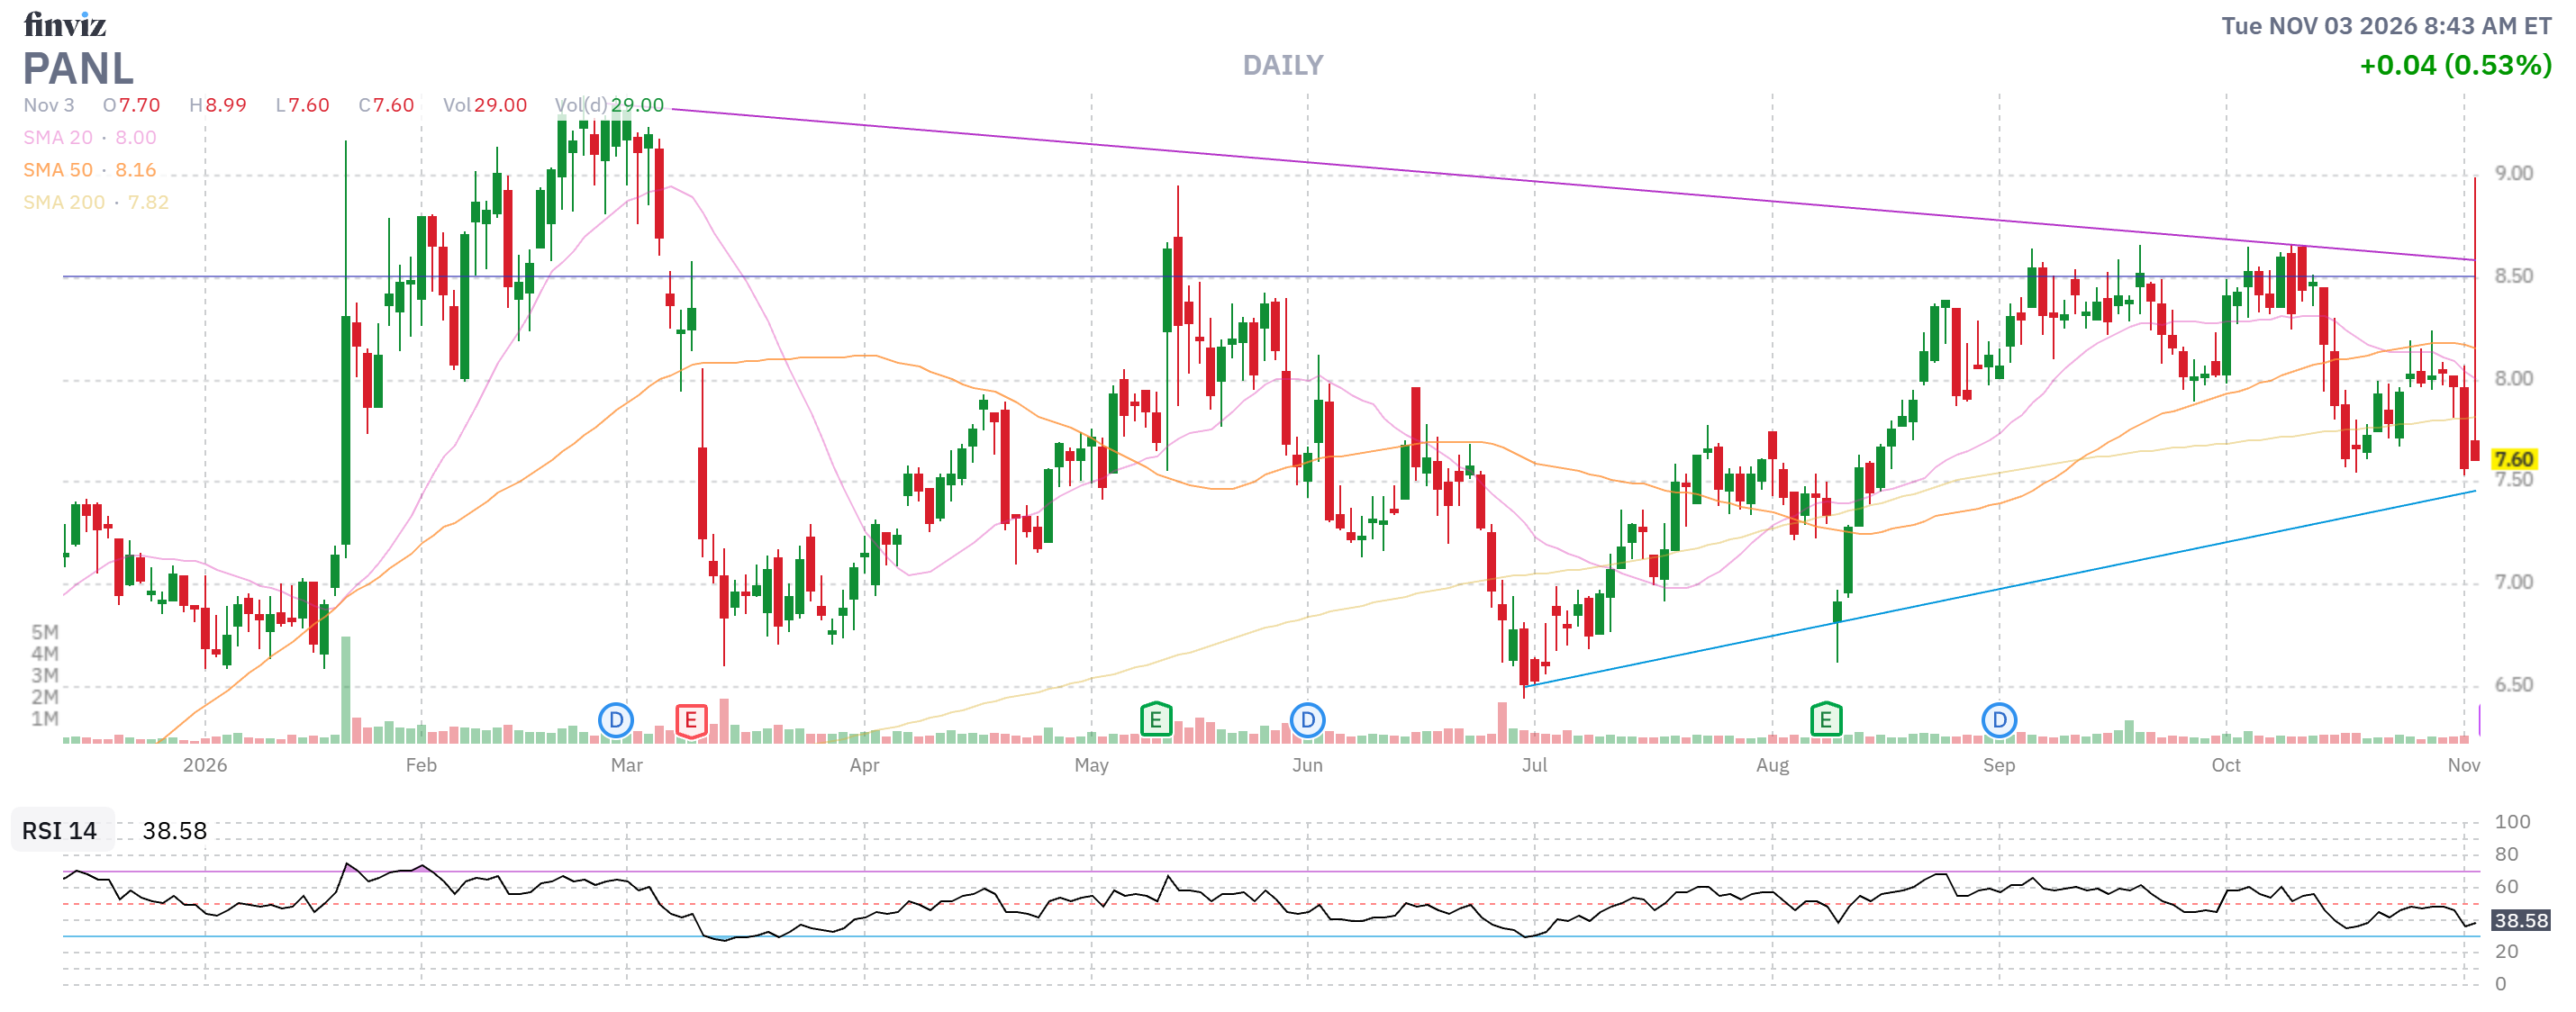
- PANL – A rare put sale has the net cash of this spread at $2,037 and it’s a $2,500 spread with $463 (22%) upside potential by February PLUS another $240 (11.7%) in potential premium sales over 108 days is not something to throw away.
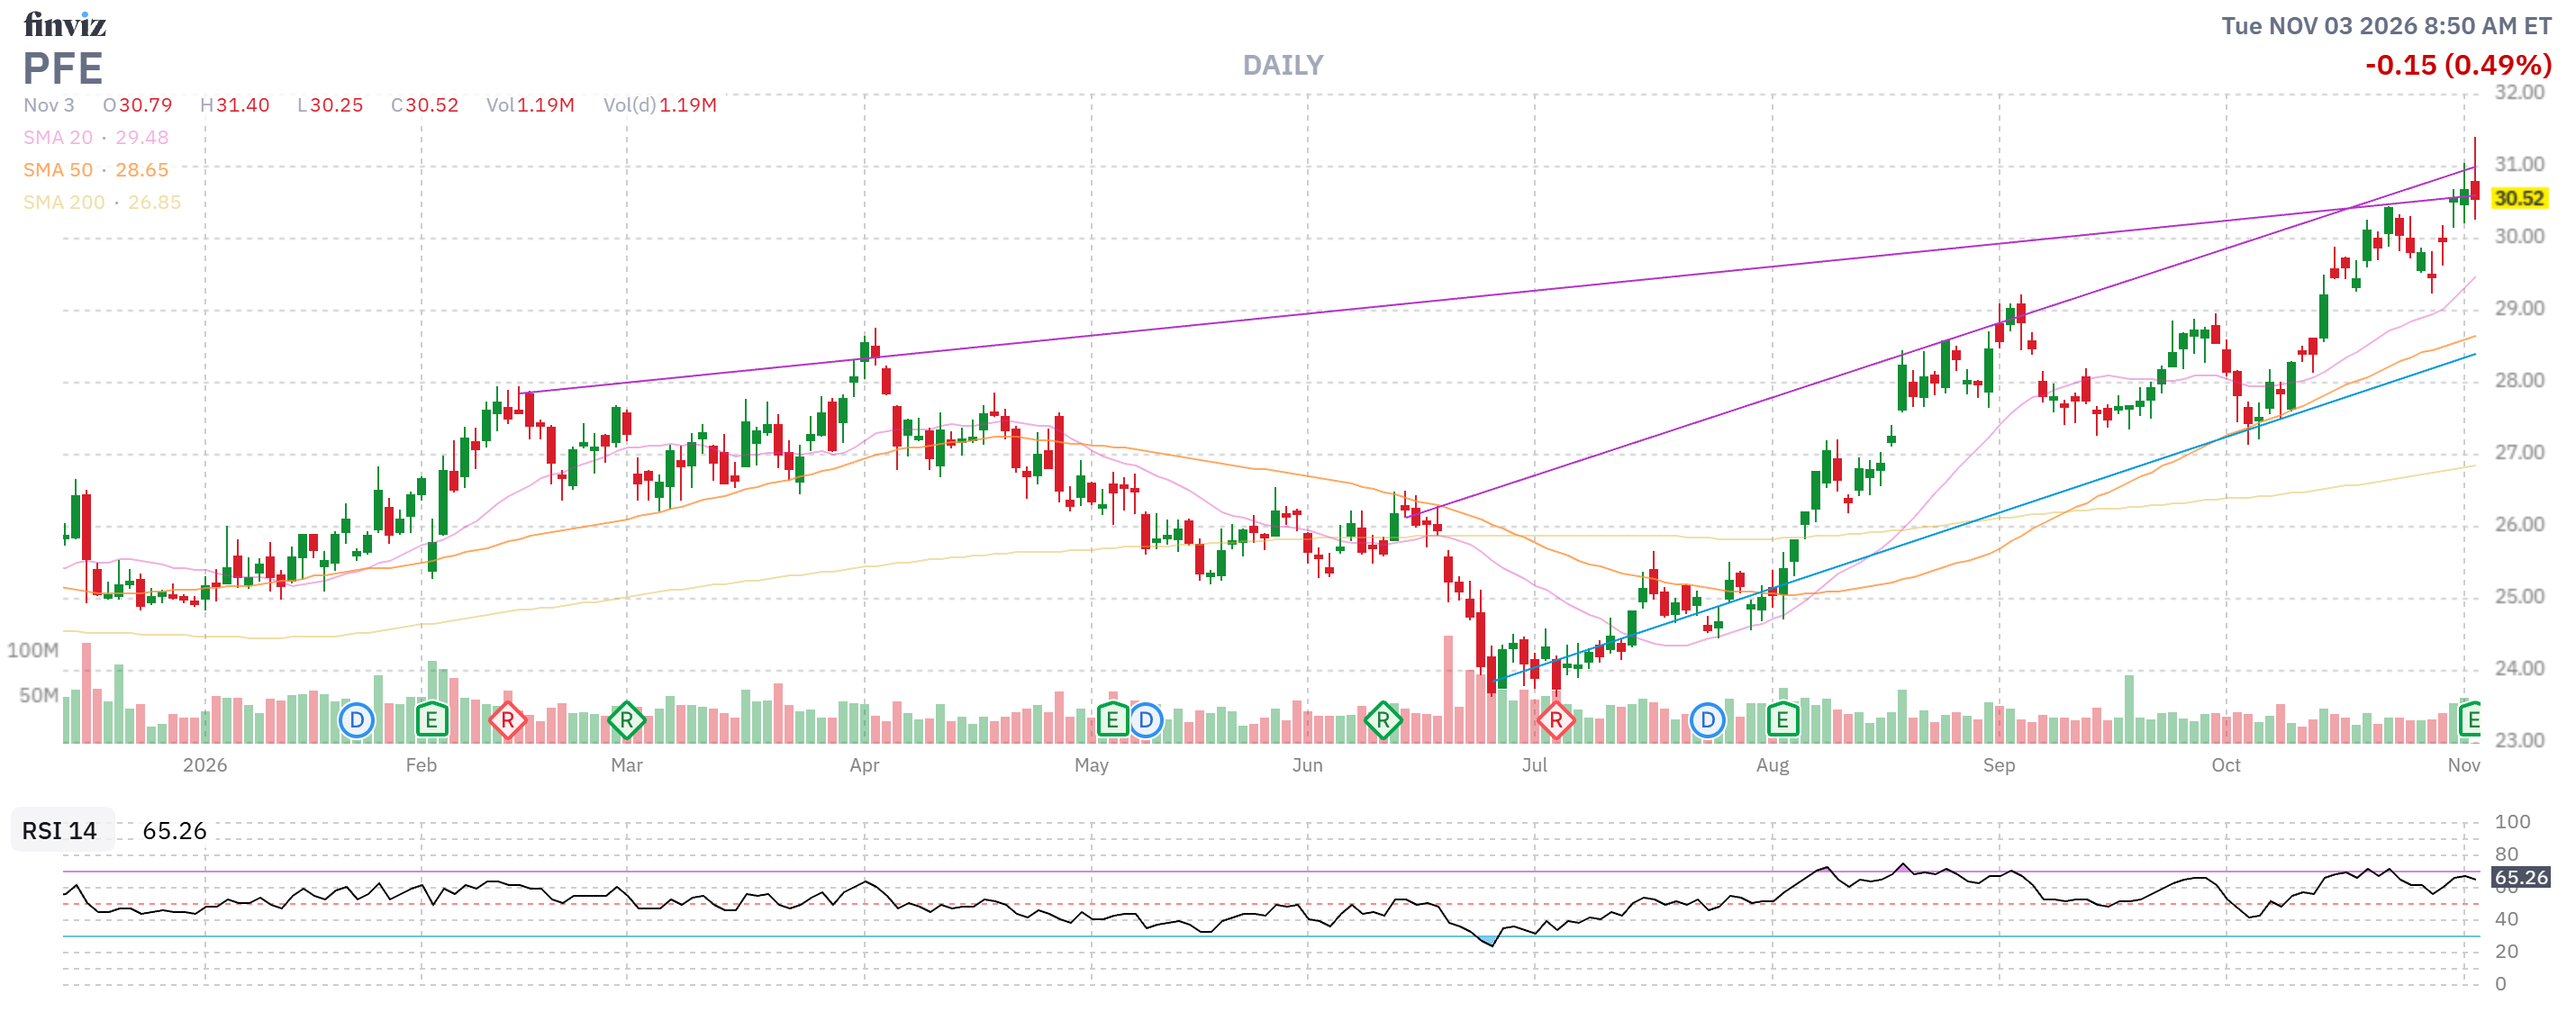
PFE – Our 2026 Trade of the Year is performing as expected and this $5,000 spread is net $2,795 with $2,205 (78%) upside potential if $30 holds and we may as well roll the 4 short March $27 calls ($1,670) to 4 short June $29 calls at $3.50 ($1,400) for net $270. We’ll still have a chance to sell another set of short calls for another $1,400 (50%) in premium sales potential – but at least the spread is working and it’s still Good for a New Trade as PFE is rock-solid with great earnings just reported!
IN PROGRESS