


A chart pattern is a clue, not a command. Advanced market chart analysis techniques treat patterns as possible continuation signals, suggesting a trend may persist, or reversal signals, which may indicate a change in direction.
It’s natural to look for a clear signal, especially when prices move quickly. The key is to read the evidence in context: a pattern on its own tells only part of the story.
This guide explains how chart patterns, the Relative Strength Index (RSI), moving averages, and support and resistance work together to clarify market action. You’ll see how peaks and troughs reveal trends, how momentum and trend indicators add perspective, and why a possible breakout or reversal calls for closer scrutiny rather than an automatic reaction. The aim is to build a fuller picture from the chart’s clues, not find a magic signal.
Key Takeaways
- Read price peaks and troughs to judge whether a market is trending, then use chart patterns to consider whether that move may continue or turn.
- Use RSI to add momentum context and moving averages to assess the broader trend and potential shifts.
- Treat support and resistance as areas where buying or selling pressure may change, not as signals to act on automatically.
- Combine chart evidence with the timeframe and wider market context to build a more balanced reading of price action.
Technical indicators including RSI and moving averages
Advanced market chart analysis techniques combine price, volume, and technical indicators to interpret market action. Each tool highlights a different feature, so its value depends on the question being examined.
RSI and Moving Average Signals
The Relative Strength Index (RSI) measures momentum and can help identify potentially overbought or oversold conditions. Moving averages smooth price data to help reveal the broader trend and possible turning points. These indicators are more useful in combination: rising prices above a rising moving average, alongside strengthening RSI, present a different picture from a rally with fading momentum.
Combining Indicators With Chart Analysis
Chart structure puts indicators in context. A trend line, candlestick pattern, or nearby price level shows where a signal appears, while volume helps describe participation in the move. Market breadth offers another perspective by showing whether gains involve a broad group of securities or a narrower set. For example, a stock rising as breadth weakens may have less widespread support than a move shared across the market.
Fibonacci ratios can help technical analysts identify potential support, resistance, and retracement levels. Applied to a previous move, these levels offer reference points for assessing the size of a pullback. Compare them with actual price behavior rather than treating a ratio as a signal on its own.
MACD and Indicator Comparisons
RSI measures momentum, MACD compares moving-average behavior, and moving averages help clarify trend direction. Combining MACD with RSI or price structure can show whether a momentum shift aligns with a possible trend change. When signals disagree, treat that difference as context rather than forcing a single interpretation.
To backtest a chart strategy, define its entry and exit conditions, then apply them consistently to historical price data. Review gains, losses, and profitable trades, and include volume conditions if the strategy depends on them. Consistent rules help distinguish a testable approach from a pattern that looks persuasive only in hindsight.
What are advanced chart patterns?
Chart patterns organize historical price action into possible continuation or reversal signals. Read each pattern against market peaks and troughs, which help establish the trend’s direction.
Continuation and Reversal Patterns
Continuation patterns suggest a trend could resume after a pause, while reversal patterns suggest its direction could change. This distinction helps describe what a chart shows without treating a familiar shape as a forecast.
A flag is a continuation pattern that may indicate an upward trend will resume. An inverted head and shoulders, by contrast, may signal a shift from a downtrend to an uptrend. Position matters: compare the pattern with the preceding trend and the sequence of price peaks and troughs.
Historical patterns provide context, not a script. Rising peaks and troughs indicate an upward trend; falling peaks and troughs indicate a downward trend. If a supposed reversal appears while the existing trend remains intact, examine the surrounding price action before interpreting it as a change in direction.
Engulfing Candlestick Patterns
Engulfing patterns use two complete candlesticks across consecutive time periods to describe a possible shift in buying or selling pressure. Their direction offers a concise way to read a change in market action, but the broader trend helps explain why the signal may matter.
A bullish engulfing pattern usually consists of two complete candlesticks spanning two time periods. In an example involving the FTSE 100, the market had been falling for more than a week before a large up day. That sequence illustrates why traders consider both the preceding trend and the engulfing candles.
A bearish engulfing pattern can be examined using an hourly chart of the GBP/USD forex pair. This timeframe shows the pattern against shorter-term price action. Compare the candles with the surrounding trend rather than reading the pattern without its chart context.
Support and resistance
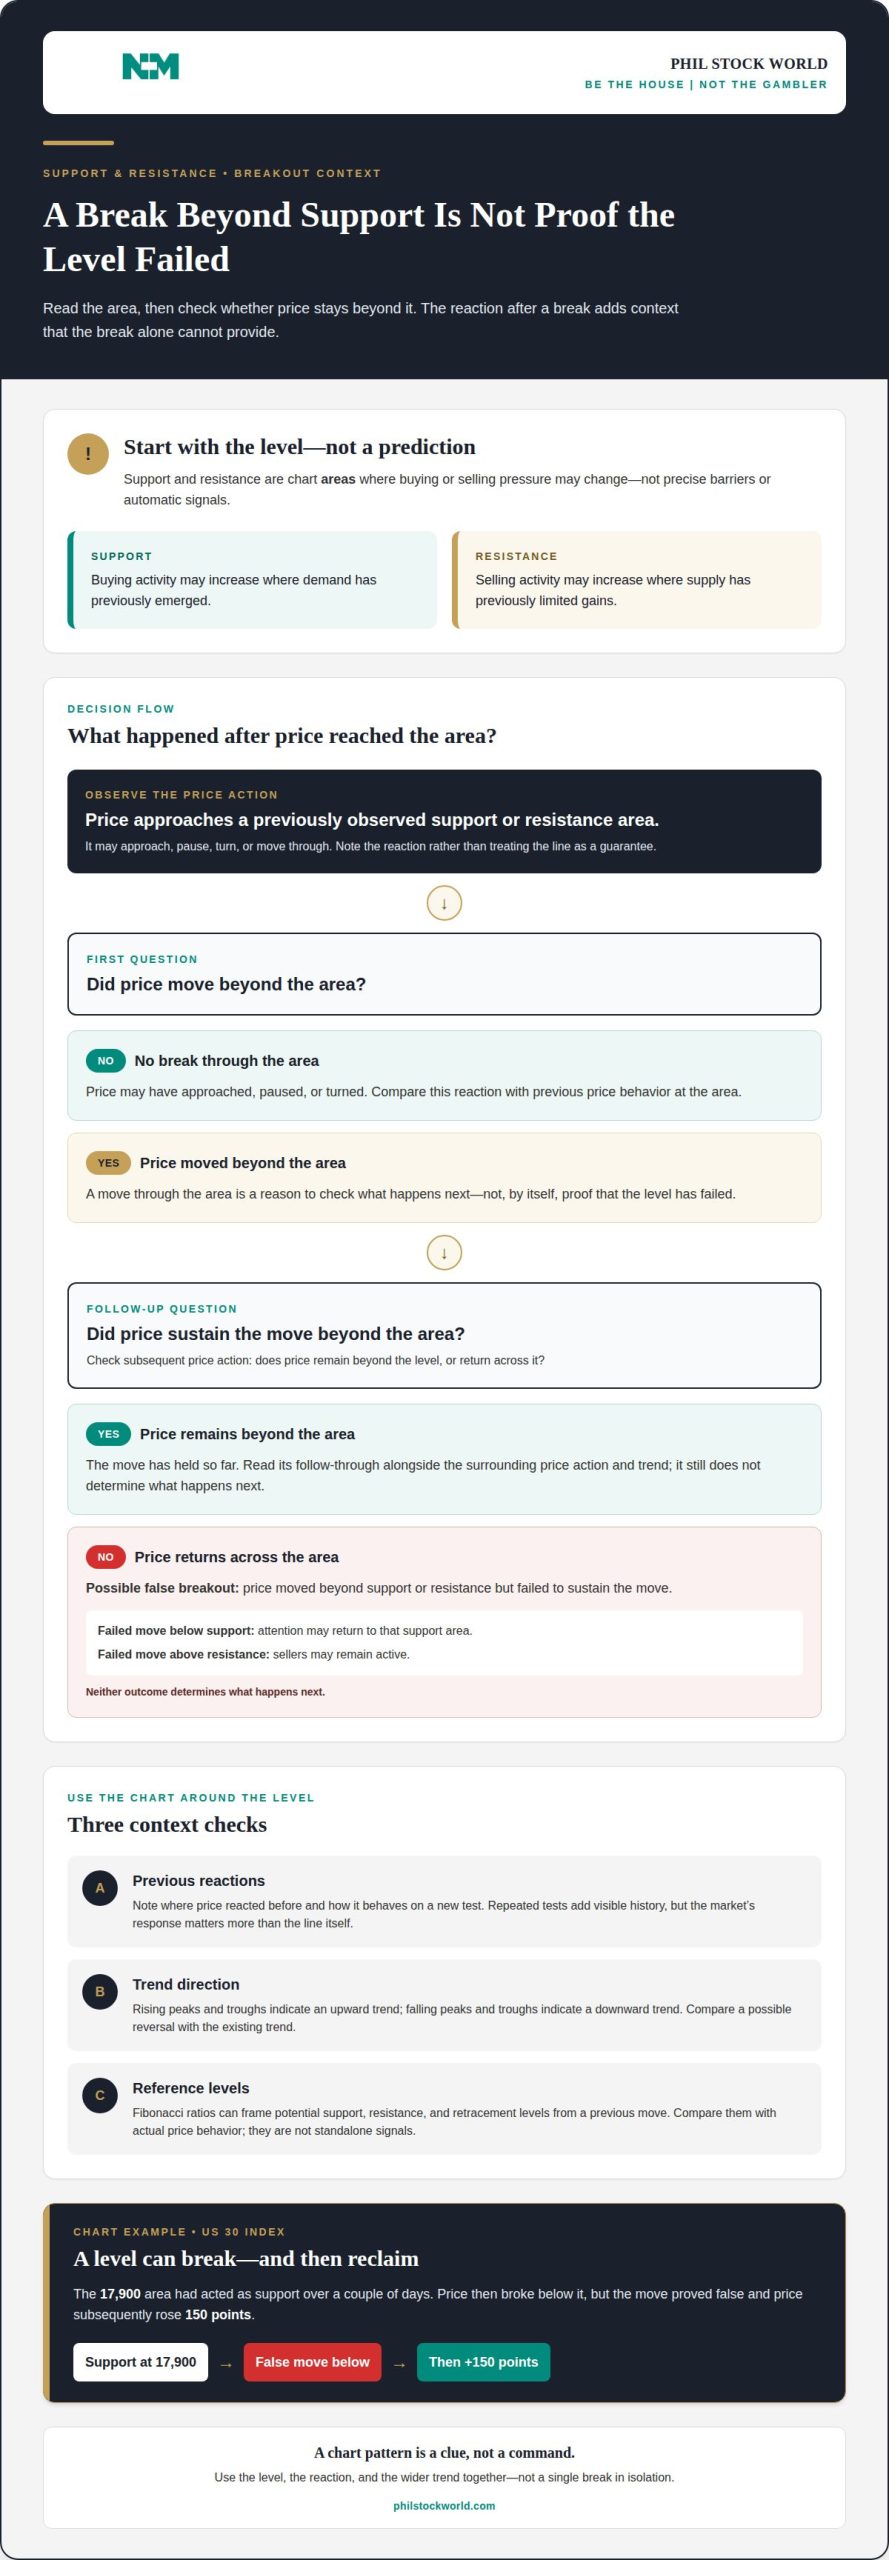
Support and resistance are chart areas where supply and demand meet. For stocks and other securities, technical models use past price behavior to identify these levels and frame possible changes in market action.
At support, buying activity may increase as a security reaches a price area where demand has previously emerged. At resistance, selling activity may increase where supply has previously limited gains. Treat each as an area, not a precise barrier: price may approach, pause, turn, or move through it. Previous reactions help show how relevant the area may be.
For example, in a US 30 index chart, 17,900 had acted as support over a couple of days. The market then broke below that level, but the move proved false and price subsequently rose 150 points. This shows why a brief move through support alone doesn’t establish that the level has failed. The reaction after the break adds important context.
A false breakout occurs when price moves beyond a support or resistance area but fails to sustain the move. Compare the break with subsequent price action: does price remain beyond the level or return across it? A failed move below support can draw attention back to that area; a failed move above resistance can indicate sellers remain active. Neither pattern determines what happens next.
Fibonacci ratios offer another way to map potential support, resistance, and retracement levels. Applied to a previous price move, they help frame how far a pullback has traveled. Use them as reference points within the wider chart, alongside previous turning areas and trend direction, not as standalone signals.
When studying chart patterns, note where price reacted before and how it behaves on a new test. A level tested repeatedly has more visible history, but the market’s response still matters more than the line itself. Combining past price behavior, Fibonacci reference levels, and follow-through keeps the analysis tied to actual market action.
Technical analysis and market action
Technical analysis reads historical price and volume to interpret market action. A chart becomes more useful when its timeframe, structure, and relative benchmark are clear.
Market Structure and Trends
Market structure describes how price forms peaks and troughs, giving traders a way to assess trend direction. Rising peaks and troughs indicate an upward trend; falling ones indicate a downward trend. This sequence helps distinguish a directional move from a sideways market.
A trend line connects at least two peaks or two troughs, while a channel uses a pair of parallel trend lines. Together, they show the slope and boundaries of a price move. Before interpreting either, set the chart’s period, type, and benchmark: a daily view may show a different structure from an hourly view.
Price Action in Market Analysis
Price action is the movement a chart records over time, including changes in direction, momentum, and volatility. Traders study it to understand how a security responds as new highs, lows, and turning points form. For example, a breakout followed by continued movement beyond a trend line differs from a quick return inside the channel.
Chart type determines which details are visible. On a candlestick chart, each candle can represent an hour or a day, so the selected period matters. Bollinger bands show a range of price volatility, while momentum describes the rate of price change. These tools offer different views of the same price action.
Technical analysis examines historical data and indicators for recurring patterns; fundamental analysis evaluates economic, financial, and political factors. They answer different questions, so interpret chart signals within the analytical approach you’re using. A benchmark adds relative context: a stock rising while its benchmark falls behaves differently from one rising alongside it.
Market structure makes chart reading a sequence: identify direction, inspect price behavior within the trend, then compare the move with its timeframe and benchmark. This helps traders assess possible opportunities without confusing a short-term fluctuation with a broader shift.
Phil Stock World: Market Charts and Analysis
Phil Stock World’s Market Charts and Analysis gives readers a way to study price trends alongside market commentary. After reviewing patterns, indicators, and key price levels, chart-focused analysis can add perspective on how market action is developing.
Premium Membership includes access to exclusive content such as market charts, sector-specific insights, and top trades. A Virtual Portfolio Review or Educational Webinars can also help readers explore portfolio ideas or build their understanding of chart analysis.
If you’d like to continue exploring market charts and analysis, contact Phil Stock World.
Make your next chart read more deliberate
Make chart reading repeatable by defining what would change your interpretation before market action tests it. Note the evidence behind a view, the condition that would weaken it, and what you’ll reassess as new price information appears. This keeps a compelling pattern from quietly becoming a fixed prediction.
Advanced market chart analysis techniques are most useful as a framework for asking sharper questions, not as a shortcut to certainty. Keep the timeframe and purpose of each indicator consistent when comparing chart reviews. That discipline can help separate a well-supported reading from an impulse driven by a dramatic candle or a fast move.
If you’d like to discuss how market charts and analysis can inform your perspective, contact Phil Stock World. Bring the market question you’re considering, and take the next step with a clearer focus.
Frequently Asked Questions
What is an indicator?
An indicator is a calculation or visual tool applied to market data to help interpret price behavior. RSI, for example, focuses on momentum, while a moving average smooths price movement. Each indicator highlights one feature, not the entire market. Before comparing it with the chart, identify the data it uses and the question it helps answer.
What are advanced techniques for analyzing market charts?
Advanced chart analysis combines forms of evidence instead of relying on one signal. A trader might compare a price pattern with momentum, volume, and a benchmark, then record what would change the interpretation. For instance, a breakout without broader participation tells a different story from one supported by rising activity across the market. The goal is disciplined interpretation, not prediction from a pattern alone.
How do traders use multiple time frame analysis?
Multiple time frame analysis compares the same security across charts covering different periods. A longer-period chart provides context for the broader direction, while a shorter-period chart shows more immediate price movement. If the shorter view moves against the longer trend, recognize that tension instead of treating the latest move as the whole market picture. Keep the security consistent across views.
How can volume profile and order flow improve chart analysis?
Volume profile organizes trading volume by price, showing where activity has concentrated during the selected period. Order flow focuses on transactions and the balance of buying and selling activity. Together, they add detail to a price chart: traders can examine whether activity clusters near a level or changes as price approaches it. These tools complement price analysis rather than replace it.
What are the rules for identifying support, resistance, and supply-demand zones?
There’s no single formula for drawing these zones. Start with visible areas where price previously paused or reversed, then mark the area rather than forcing a precise line. Review how price behaves on later visits and whether it moves decisively through the zone. After a sustained move below former support, that area may become resistance, changing how traders interpret a retest.
How can candlestick patterns be confirmed with volume and trend context?
Read a candlestick pattern alongside the preceding trend and activity during its formation. A bullish-looking candle after a decline has different context from the same candle during an established rise. Compare its volume with nearby periods, then note whether subsequent price action follows through or quickly reverses. This helps assess whether the candle reflects meaningful participation or a brief change in trading activity.