

Courtesy of Jean-Luc Saillard.
Following my post on the ETFs tracking the VIX and looking at some of the performances achieved over the last 4 years or so, I decided to compare traditional leveraging and hedging options for the S&P 500 with some alternatives. In Part 1, I will look at ETFs for protection against a correction. Part 2 will look at leveraging for going long.
Usually, investors looking for leveraging or hedging use the following instruments:
- Leveraged ETFs
- Options
- Futures
Futures are not the easiest instrument to trade for the long term and are probably better day traded as swings in the wrong direction can lead to very large losses. Options can actually be also bought and sold on leveraged ETFs so in essence, adding leverage to already leveraged instruments. They look like the ideal instrument, but trading options requires a lot of education. The casual investors might not be aware of premium decay which means that you can bet in the right direction but still lose money as your option loses value, expiration dates and other characteristics of options. There are 2 more possible issues:
- On long dated options, the spread between the bid and ask can be wide especially with more illiquid leveraged ETFs. That can rob the investor of a good portion of the investment.
- Some IRA and 401K accounts will not let you trade options.
For these 2 posts, I will only consider leveraged ETFs since they can be traded in a regular or retirement account. There are many leveraged ETFs for the S&P 500 on the market but I will look at the most actively traded. They are:
SSO – A long 2x ETF tracking the S&P 500
UPRO – A long 3x ETF tracking the S&P 500
SDS – A short 2x ETF tracking the S&P 500
SPXU – A short 3x ETF tracking the S&P 500
Since I also want to look at alternative options (looking for possible correlations) that might be overlooked, I will add the following ETFs to the comparisons:


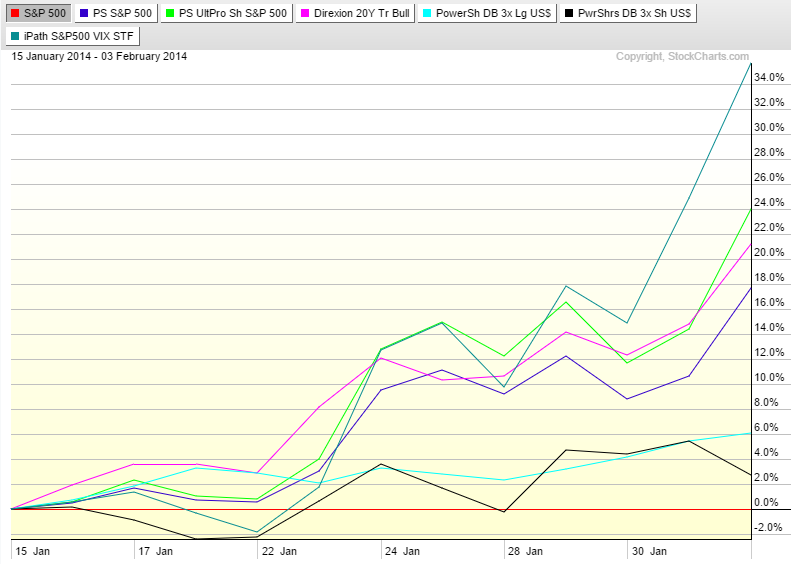
- Both dollar ETFs outperform the market with the short ETF actually ending slightly better. The correlation is not clear in that set.
- The short Treasuries ETF does pretty well, up 15% and outperforming the index by over 20%.
- The short leveraged ETF do their jobs, pretty much doubling and tripling the index loss as expected with the leverage factor.
- But the big winner in that short period is the long VIX ETF VXX. It’s up about 29% and outperforms the index by a whopping 35% in 3 weeks. It does take a while to get started, but as the index goes further down, the gains accelerate.
We need to look at more corrections to draw some definite conclusions so let’s look at the next one between July 23 and August 7.


Symbols are in the same order as the previous chart.
- Long treasuries and long dollar ETFs do outperform the market again by 6 and 7% respectively. Not the best of hedges, but safe places to park your money!
- The leveraged ETFs perform as expected, returning performances in line with their leverage factors.
- But the winner is once again VXX and by a 10% margin like during the earlier period.
Let’s look at 2 more 2014 corrections to see if the trend holds. We had another longer and deeper correction in September:

And with the S&P 500 as baseline:
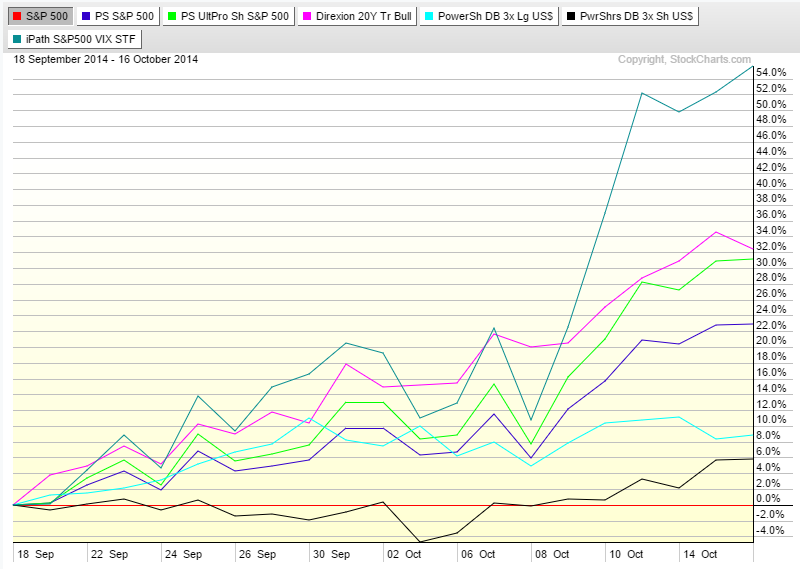
Symbols are in the same order as the previous chart.
- No big surprise with the leveraged ETF again. Their performance in short periods of time seems to be reliable.
- Being long the dollar does seem to provide some protection although it does not have very high returns.
- The long Treasury ETF is a big winner in that period as money flowed from the market to treasuries. It even outperformed the leveraged ETFs in that month.
- And once again, VXX is a huge winner, outperforming the second best ETF by over 20% and beating the market by 55% in one month!
The final correction I want to study was in December:

And with the S&P 500 as baseline:

- Being short the dollar worked better than being long as opposed to the other times.
- The short Treasuries ETF outperforms the leveraged ETFs again although not by much.
- Leveraged ETF are consistent with the previous periods.
- But look again at VXX! Getting double the performance of the second best ETF.
Conclusion
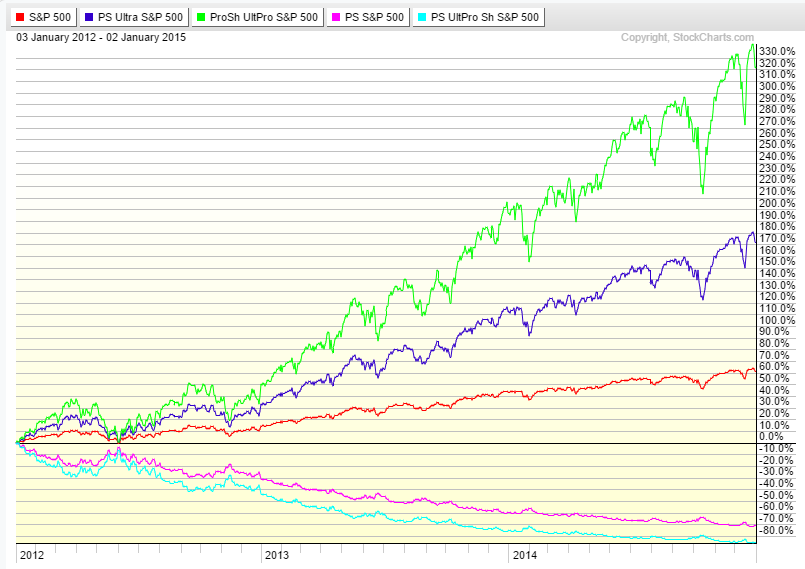
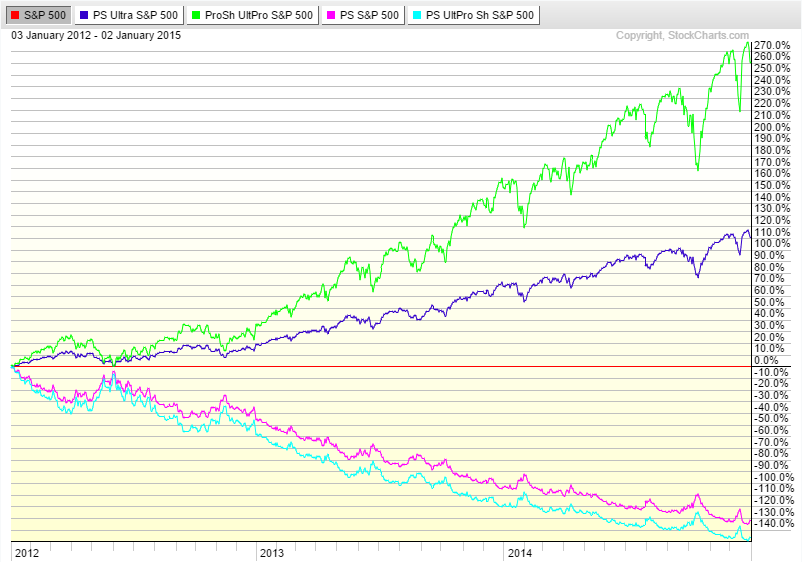
It is difficult to draw conclusions over only 4 sets. Especially given the fact that these periods were very short since the market has been up almost the entire year. The dollar ETFs are not reliable enough to make good edges. They will not lose you any money mostly, but they won’t make you much either. The leveraged ETFs perform as expected offering good protections against short-term corrections. We would need to look at longer down periods to see what kind of damage decay does to these ETFs. The long Treasuries ETF does outperform the leveraged ETF in 2 out of 4 sets and does offer some level of protection. There are some outside factors at play such as the geopolitical situation which does influence the flow of money. Still, seemingly a safe alternative to the usual hedge options. But it seems that we have a winner with VXX. In these short corrections, it outperforms even the 3x ETF by a wide margin. The problem with VXX is the long term decay though. The VIX goes through quick spikes and long periods of calm which are deadly to VXX. If you look at the long term chart above, you can see that VXX is the worst performer over the last 3 years. But as a short term hedge, it clearly has a lot of potential! Now it’s all in the timing.
I will check some corrections from previous years and update this post with that data to see if these conclusions hold over time.
Part 2 will look at the longer periods of 2014 when the market was up. I will post that sometimes this week.