

The State of the Stock Market
Courtesy of Michael Batnick
The S&P 500 closed at an all-time high on Friday for the 15th time this year.
This market’s strength is impressive, considering that of the top 5 stocks by market cap, none are at all-time highs. Only two of them, Google and Microsoft, hit that mark over the last two months. Apple, the biggest stock in the world, is 16% below its peak in January.
If you break the S&P 500 into deciles by market cap, you can see complete randomness into how far the median stock is from its 52-week high. This is a 180 from early in the pandemic where the only thing you needed to know about the condition of stock was its relative size. Small worst, big best. It’s not that simple anymore.

The strongest stocks in today’s market are the ones most levered to the economic recovery. The median industrial stock, for example, is just 2.5% below its 52-week high. 36% of the members in this group closed at a 52-week high on Friday.

If you did nothing but look at a chart of every stock in the S&P 500, you would conclude that the economy was booming. Pull up a chart of Lennar, or CSX, or CAT, or AA. Yes, that Alcoa.
None of the aforementioned companies are considered glamour stocks. You wouldn’t find them trading with valuations sported by some of the high-flying tech companies.
If you sorted the market on a price-to-sales ratio, you wouldn’t find any pattern. At least not until you got to the most expensive bucket. Those are where you’ll find the weakest names. But other than that, the distance from a 52-week high seems to be completely random as far as valuation goes.

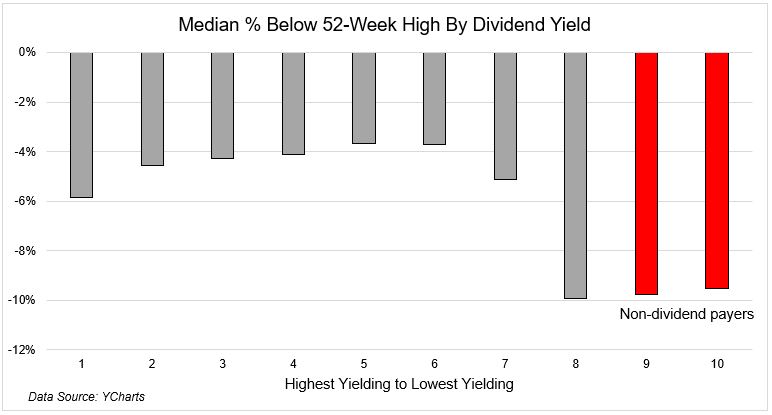
Another way of looking at a similar concept is to sort the buckets by their dividend yield. Again, no pattern develops until you get to the stocks with low or no dividends. This is where you’ll find Twitter, Tesla, and Take-Two Interactive.
The stock market is in a very healthy place right now. 93% of the stocks in the S&P 500 are above their 200-day moving average right now. The last time you saw a reading this high was 2013.

I continue to be impressed at the way sector rotation has kept this market afloat. If you told me 6 months ago that the momentum names would pause while industrial and materials lead us to a new phase of the bull market, I wouldn’t have believed you.
The only reason to be concerned right now is that things might look too good. Not exactly a persuasive argument, but I can understand this mentality. If you get nervous at all-time highs when the leadership is narrow, and when it’s broad-based, you’re going to have a difficult time making money.