

Why is it that in late 2026, with sophisticated AI signals at your fingertips and the restrictive Pattern Day Trader rules finally in the rearview mirror, most retail traders are still just feeding the institutional sharks? It’s a bitter pill to swallow. You find a textbook bull flag, set your stops, and then a single line of macro news sends the price screaming through your exit. You’re left staring at a screen, wondering how the house saw you coming.
We’ve all felt that sting of analysis paralysis, caught between a dozen conflicting indicators while the real move happens elsewhere. It’s exhausting to feel like a victim of institutional moves every time the 3.63% Fed funds rate fluctuates. The secret to breaking this cycle isn’t adding more lagging indicators to your screen; it’s combining technical and fundamental analysis to see the full field of play. You need to understand why the market is moving before the chart tells you where it’s going.
This guide promises to hand you a repeatable framework for merging macro economic drivers with micro price action. We’ll explore how to align the big picture with precision timing for your options entries, giving you the confidence to trade alongside the pros instead of against them. It’s time to stop guessing and start building a high-probability strategy that actually outmuscles the retail herd.
Key Takeaways
- Escape the “Chartist vs. Value Investor” false dichotomy that keeps retail traders stuck in a cycle of predictable losses.
- Identify “The House” bias by prioritizing macro drivers and global policy to determine if the market wind is at your back.
- Master the art of combining technical and fundamental analysis to pinpoint high-probability entries where institutional big money actually operates.
- Follow a repeatable 4-step confluence framework that filters for sector strength and sentiment before you risk a single dollar.
- Shift from simple stock picking to building professional-grade strategies that utilize options for consistent income and hedging.
The Great Trading Debate: Why Choosing One Side Is a Retail Trap
Walk into any trading forum and you’ll see a civil war. On one side, the “Chartists” swear by candles and oscillators. On the other, the “Value Investors” obsess over balance sheets. This false dichotomy is a retail trap. It’s designed to keep you focused on a single sliver of data while the institutional “House” takes your money. If you only look at one side of the coin, you’re trading with a massive blind spot. Success in the 2026 market requires combining technical and fundamental analysis to see the whole board.
Professional traders don’t care about being right; they care about being profitable. They use fundamentals to establish a directional bias. They ask, “Is the macro environment supportive of this move?” Once they have an answer, they use technicals to find the precise entry. Retail traders fail because they get religious about their chosen method. They’ll hold a “fundamentally sound” stock all the way to zero or buy a “perfect” breakout right before a massive earnings miss. Market Confluence is the intersection of economic reality and price psychology.
The Limits of Pure Technical Analysis
Charts are essentially a map of where the herd has already been. While Technical analysis is vital for timing, it’s often a lagging indicator. A perfect head and shoulders pattern doesn’t mean a thing if the Federal Reserve unexpectedly shifts its stance on the 3.63% funds rate. In a fast moving macro environment, these patterns can become traps. The “House” knows exactly where retail traders place their stops based on common chart patterns; they’ll hunt that liquidity before the real move starts. You’re just a data point for their algorithms if you don’t know the “why” behind the move.
The Limits of Pure Fundamental Analysis
You can be right about a company’s value and still go broke waiting for the market to agree. This is the “Right but Early” problem. Great companies can see their stock prices languish for months due to poor sector sentiment or broader market liquidations. Fundamentals are too blunt for modern trading. They won’t tell you where to place a stop loss or when an options entry is optimized for volatility. In 2026, where liquidity can vanish in seconds, valuation is often a subjective concept that plays second fiddle to immediate price action. You need a trigger, and fundamentals don’t provide one.
Fundamental Analysis: Identifying ‘The House’ and What to Trade
If you want to trade like the house, you have to understand who owns the casino. In 2026, the Federal Reserve remains the ultimate floor manager. With the Federal Funds Effective Rate holding at 3.63%, every policy tweak ripples through the market faster than a retail trader can refresh a chart. Fundamental analysis isn’t just about reading a balance sheet; it’s about determining the market’s path of least resistance. This is why combining technical and fundamental analysis is the only way to avoid being blindsided by a news cycle that ignores your support levels.
Professionals use the “Big Picture” to set their bias. Are we in a regime of tightening or easing? This macro filter tells you whether to be bullish, bearish, or neutral before you even look at a candle. You can dive deeper into macro market insights to see why this bird’s-eye view is the foundation of any professional strategy. Once the bias is set, you screen for sectors where institutional “big money” is parking capital. In late 2026, we’re keeping a close eye on the SEC’s upcoming proposal for retail access to private markets, which could fundamentally shift how liquidity flows between asset classes.
Economic Data Beyond the Headlines
Most people see a GDP or inflation print and react to the headline. That’s a mistake. The pros are looking for the narrative. Is the market currently priced for a “soft landing” or a “higher for longer” reality? Geopolitical shifts can change these valuations overnight, making a guide to combining technical and fundamental analysis essential for survival. It’s about understanding how policy and innovation connect into a unified worldview. When employment data drops, don’t just look at the number; look at how the bond market reacts. If the yields don’t budge, the “news” was likely already baked into the price.
Earnings and Corporate Health
P/E ratios are often a distraction. In the 2026 landscape, cash flow and debt sustainability are the metrics that matter most. With the Bank Prime Loan Rate at 6.75%, companies with heavy debt loads are facing a serious reality check. We focus on guidance because the “earnings beat” is usually priced in by the time you hear about it on the news. Smart analysts are already looking at transition planning for IFRS 18 to get a jump on how companies will structure their income statements starting in 2027. If you’re tired of being the last to know, a premium membership can give you the institutional-grade research needed to stay ahead of the herd.
Technical Analysis: Decoding the Footprints of the Herd
Think of a stock chart as a psychological map of everyone who has been trapped, elated, or liquidated before you. Technical analysis isn’t some mystical art of predicting the future; it’s the science of measuring human behavior in real time. While the macro drivers we discussed earlier tell you “what” should happen, the chart reveals the exact moment the herd decides to act on it. By combining technical and fundamental analysis, you stop treating a chart like a crystal ball and start using it as a tactical map to find where the institutional “big money” is actually setting its traps.
The key is identifying where the “House” enters the game. Institutions don’t buy millions of shares in a single click; they build positions over days and weeks at specific support levels. You can see these footprints when price holds firm despite negative headlines. Volume serves as your truth serum here. If a price breaks out on thin volume, it’s likely a retail-driven head-fake. If it moves on massive volume, the big money has arrived. You can learn more about how to read market charts to start spotting these institutional signatures before the rest of the herd catches on.
The Essential Toolkit for 2026
Keep your screen clean. A cluttered chart leads to analysis paralysis. Focus on the 50 day and 200 day moving averages to identify the dominant trend. In 2026, the market remains highly sensitive to these levels as algorithmic triggers. Use the Relative Strength Index (RSI) not just to find “oversold” stocks, but to spot exhaustion in the retail chase. When the RSI hits extreme levels while the macro narrative is shifting, a reversal is often imminent. Simple price action, such as higher highs and lower lows, often provides more clarity than a dozen complex indicators combined.
Technicals for Options Traders
For those of us utilizing options, technicals are about more than just direction; they’re about timing and volatility. Early 2026 has seen retail options volume surge 14% above 2025 levels, meaning premiums are often juiced by the herd’s emotions. We use volatility charts to ensure we aren’t buying at the peak of a “squeeze” pattern. Identifying these squeezes allows you to position yourself for explosive moves before the breakout occurs. By setting price targets based on Fibonacci extensions and historical pivots, you can exit your trades with the confidence of someone who knows exactly where the exit door is located.
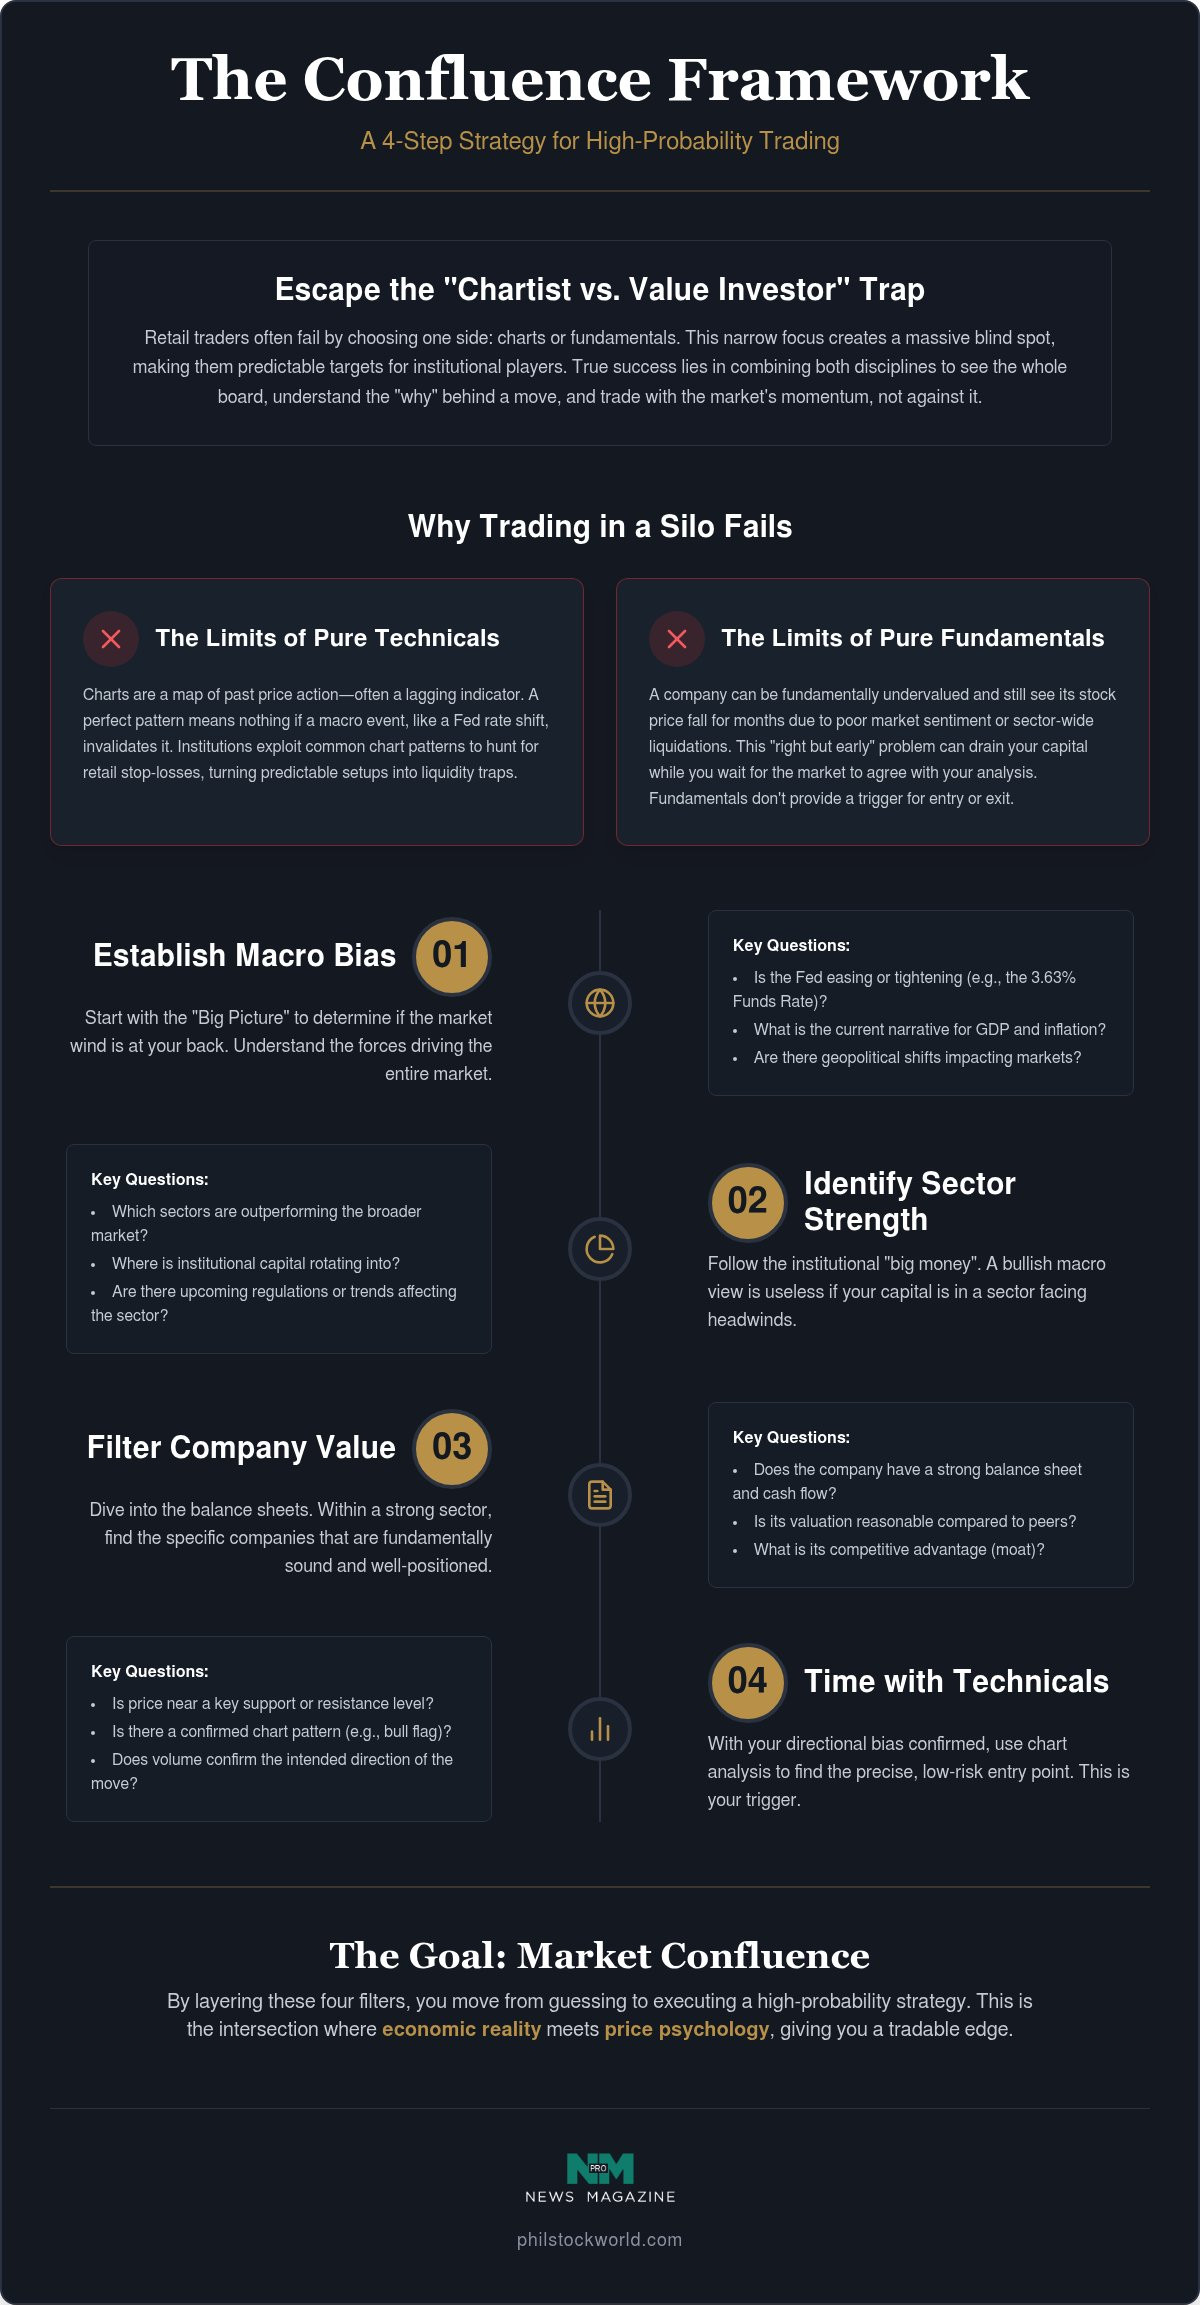
The Confluence Framework: A 4-Step Strategy for High-Probability Trades
Most retail traders treat news and charts like two separate languages. The “House” knows they’re just two different ways of looking at the same reality. By combining technical and fundamental analysis into a single, cohesive framework, you move beyond the guesswork that plagues the herd. Confluence isn’t about finding a dozen indicators that agree; it’s about ensuring the economic “why” aligns with the price action “when.” This four-step filter ensures you only risk capital when the odds are stacked heavily in your favor.
- Step 1: Macro Filter. Check the wind. If the Federal Reserve is maintaining a 3.63% funds rate and signaling hawkishness, buying growth stocks is like swimming against a riptide. Ensure the macro environment supports your directional bias.
- Step 2: Sector Strength. Don’t buy the best house in a bad neighborhood. Use relative strength to identify sectors where institutional money is currently rotating. You want to be where the liquidity is flowing, not where it’s drying up.
- Step 3: Technical Trigger. Once the fundamental thesis is set, wait for the chart to confirm. Look for institutional footprints like high-volume breakouts or successful tests of the 200-day moving average. The chart is your permission to enter.
- Step 4: Risk/Reward Calibration. If the math doesn’t work, the trade doesn’t happen. Calculate your exit before you enter. We look for setups where the potential gain is at least three times the potential loss.
Validating the Signal
Divergence is your best friend and your loudest warning. If a company reports “record earnings” but the stock price drops on heavy volume, the “House” is selling into the retail hype. This is a clear signal that the fundamental narrative is exhausted. We often employ the “Three-Day Rule” for major news events. Let the initial emotional spike settle for 72 hours. This prevents you from getting caught in a “bull trap” or a “dead cat bounce.” If you want to refine your approach without risking a dime, using a virtual portfolio review is a smart way to audit your strategy for the 2026 market.
Execution and Position Sizing
Even a high-confluence trade can fail. Risk management is the only thing that keeps you in the casino. We never “bet the farm” on a single fundamental thesis. Instead, we use options to hedge our positions. If we’re bullish on a sector but the macro environment is volatile, we might sell premium to lower our cost basis. This allows your fundamental thesis time to play out while the technicals churn. To see this confluence framework applied to real-time market moves, join our community of savvy traders at Phil Stock World today.
Trading with an Edge: How Phil Stock World Simplifies the Hybrid Approach
Beating the house requires more than just a subscription to a chart service. At Phil Stock World, our core philosophy revolves around the idea that individual traders can only thrive by operating with the same rigor as the institutions. We don’t just “pick stocks” based on a fleeting headline or a pretty candle. We build comprehensive strategies that account for hedging, income generation, and risk mitigation. By combining technical and fundamental analysis, we help you bridge the gap between the macro “why” and the technical “when,” turning market volatility into a source of opportunity rather than a source of stress.
Our live trading rooms aren’t just chat rooms; they’re real-time confluence labs. While the retail herd is busy chasing the latest social media hype, our members are watching institutional-grade research unfold. You get to see how policy shifts, such as the upcoming SEC changes to private market access, actually translate into price action. It’s about developing a street-smart intuition that ignores the noise and focuses on where the big money is actually moving. This community-oriented approach creates an atmosphere that is both intellectually stimulating and emotionally grounded, ensuring you never have to face a volatile 2026 market alone.
Real-Time Alerts and Market Commentary
Social media gurus often provide lagging advice that leads to getting blindsided by the news. We filter the daily chaos into actionable trade ideas through our “Daily Pulse” and real-time alerts. This isn’t about blind following; it’s about seeing the logic behind every move. A professional newsletter provides a consistent, rhythmic pulse that connects policy and economics into a unified worldview. This allows you to maintain a strategic edge without spending fourteen hours a day staring at a screen. You’ll learn to identify the narrative the market is currently priced for before the reversal happens.
Joining the Inside Circle
Stepping into a Phil Stock World membership means gaining access to a savvy, street-smart mentor who has been navigating these waters since 2006. You’ll have the opportunity to participate in educational webinars that break down advanced hybrid strategies into digestible, actionable steps. In a market where the 3.63% Fed funds rate can shift the landscape in an afternoon, having a reliable guide is the difference between being a victim of institutional moves and being part of the smart money. It’s time to stop being the retail herd and start trading like the house.
Take Your Seat at the Head of the Table
The 2026 market doesn’t reward those who pick a single side of the trading debate. You’ve seen how the retail herd gets trapped by textbook patterns that ignore macro realities like the 3.63% Fed funds rate. Success requires a shift in perspective. By combining technical and fundamental analysis, you transform your trading from a game of chance into a professional-grade operation. It’s about aligning the “why” of global policy with the “when” of price action to find true market confluence.
You don’t have to navigate this volatile landscape alone. Since 2006, we’ve provided daily expert market commentary and proven hedging strategies designed for markets just like this one. It’s time to stop reacting to the noise and start anticipating the moves. Access our real-time interactive trading rooms and learn to build strategies that prioritize risk management and consistent income. Start Trading Like ‘The House’: Join Phil Stock World Today. The tools are ready. The strategy is clear. Now, it’s time to execute with confidence.
Frequently Asked Questions
Is it better to start with technical or fundamental analysis?
You should start with fundamental analysis to establish your directional bias. Think of it as checking the weather before you set sail. Professionals use the macro environment to determine if they should be bullish, bearish, or neutral. Once you have the “why” settled, you switch to technicals to find the “when.” If you start with a chart alone, you risk buying a perfect breakout right before a massive news event ruins the setup.
Can you combine technical and fundamental analysis for day trading?
Yes, and it is actually a requirement for survival in 2026. Day traders use fundamentals to identify which sectors have the highest liquidity and the strongest catalysts for that specific session. Combining technical and fundamental analysis prevents you from getting caught in a “fake out” move. It ensures that your intraday entries are aligned with the larger institutional narrative rather than just reacting to the erratic noise of the retail herd.
How do I resolve conflicting signals between a chart and a news report?
When news and charts disagree, the price action is usually telling the truth about institutional sentiment. If a stock drops on “good” news, it often means the big money had already priced in the event and is now using the retail buying frenzy to exit their positions. This divergence is a powerful signal. We recommend using the “Three-Day Rule” to let the initial emotional reaction pass before deciding which signal to follow with real capital.
What are the best fundamental indicators for long-term investors?
Long-term investors should prioritize cash flow sustainability and debt management over simple P/E ratios. In an environment with a 3.63% Fed funds rate, the cost of capital is a critical fundamental driver. You need to analyze how a company’s debt load will impact its growth over several years. Combining these macro insights with a look at the 200-day moving average helps you find entry points that offer the best possible long-term value.
Do professional traders really use technical analysis?
Pros definitely use technicals, but they treat them as a map of human psychology rather than a prediction tool. They look for key support and resistance levels where institutional orders are likely to be sitting. They know that moving averages and volume profiles act as algorithmic triggers for big money. While their conviction might come from fundamentals, their execution is almost entirely driven by the footprints they see on the chart every single day.
How much time does it take to perform both types of analysis daily?
It doesn’t take as long as you think if you have a repeatable framework. Most savvy traders spend about 45 minutes a day reviewing macro updates and checking their primary watchlists. You don’t need to be a macroeconomist; you just need to know which way the wind is blowing. Using professional resources like our daily market commentary or seeking structured professional development through Trainetics Academy can help you filter the noise and focus only on the data that actually moves the needle.
Confluence is the intersection of different analysis methods that all point to the same conclusion. It’s the “House” edge. When the macro environment is supportive, the sector is outperforming, and the technical chart shows an institutional entry point, you have found confluence. This is the ultimate goal of combining technical and fundamental analysis. It gives you the confidence to take larger positions because the mathematical probability of success is significantly higher than a single-signal trade.
Can fundamental analysis help with options trading?
Fundamentals are the secret weapon for options traders because they help you select the right strategy for the expected move. If the fundamentals suggest a stock is undervalued but the macro environment is volatile, you might choose to sell puts instead of buying calls. This allows you to generate income while waiting for your thesis to play out. Understanding the “why” behind the move helps you pick the optimal expiration and strike price for every trade.

